City, University of London Institutional Repository
Citation
:
Reyes-Aldasoro, C. C., Zhao, Y., Coca, D., Billings, S. A., Kadirkamanathan, V.,
Tozer, G. M. and Renshaw, S. A. (2009). Analysis of immune cell function using in vivo cell
shape analysis and tracking. Paper presented at the 4th IAPR International Conference on
Pattern Recognition in Bioinformatics, 07-09-2009 - 09-09-2009, Sheffield, UK.
This is the accepted version of the paper.
This version of the publication may differ from the final published
version.
Permanent repository link:
http://openaccess.city.ac.uk/4647/
Link to published version
:
Copyright and reuse:
City Research Online aims to make research
outputs of City, University of London available to a wider audience.
Copyright and Moral Rights remain with the author(s) and/or copyright
holders. URLs from City Research Online may be freely distributed and
linked to.
City Research Online:
http://openaccess.city.ac.uk/
[email protected]
cell shape analysis and tracking
Constantino Carlos Reyes-Aldasoro1, Yifan Zhao2, Daniel Coca2, Stephen A.
Billings2, Visakan Kadirkamanathan2, Gillian M. Tozer1 and Stephen A.
Renshaw3
1 - Cancer Research UK Tumour Microcirculation Group, Academic Unit of Surgical Oncology, The University of Sheffield, Sheffield, S10 2RX, UK.
2 - Department of Automatic Control and Systems Engineering, The University of Sheffield, Sheffield, S1 3JD, UK.
3 - MRC Centre for Developmental and Biomedical Genetics, Academic Unit of Respiratory Medicine, The University of Sheffield, Sheffield, S10 2RX, UK.
Abstract. In this paper, a tracking and shape analysis algorithm for neutrophils of zebrafish is proposed. The neutrophils were fluorescently labelled with Green Fluorescent Protein and observed in a time-lapse three dimensional video through a confocal microscope. The neutrophils were segmented from the background and tracked with a keyhole model of movement. Morphological analysis was performed by calculating the volume of the segmented objects together with the measurements of sphericity, tortuosity and average number of end points of the centre lines. We speculate that these measurements are related to the activation of the neutrophils as part of the process of killing and digesting bacteria. The algorithm is fully automatic and should provide a robust frame-work of analysis for posterior analysis of the neutrophils in zebrafish.
Keywords:Tracking Neutrophils, Zebrafish Model, Cell Morphological Analysis, Neutrophil Activation.
1
Introduction
Changes in cell shape, position and number underlie the development of all organs and give rise to the form and function of our bodies and those of all the organisms around us. To date, most of our knowledge about how cells arrange themselves in space and how this relates to their function has been worked out using static snapshots of cell shape and position in fixed tissues. This is
all changing with the advent of in vivo models such as the zebrafish, Danio
rerio. Two advantages of this model come together to make this possible. Firstly, because the larval forms of the zebrafish are transparent, it is possible to see through the outer layers, to structures deep within the fish. Secondly, these animals are readily genetically manipulated to allow labelling of individual cell populations with fluorescent tags, such as the Green Fluorescent Protein (GFP).
This protein, isolated from the jellyfishAequorea victoria, fluoresces when excited
widefield or confocal microscopy. This allows the study of the shape and position of individual cells within a living organism. Development of entire organ systems, and indeed the early stages of the entire embryo can now be tracked at a single cell level [1]. Datasets such as this demand new algorithms for tracking cells, and identifying dynamic changes in cell shape. The outputs from such analysis will provide new levels of understanding in a range of biological processes.
In addition to developmental cell migrations, a number of cell types within mature animals undergo defined patterns of migration and shape change. Per-haps the most dramatic of these are the cells of the immune system. Neutrophils and macrophages are the most important cells in our daily fight against infec-tious disease, and protect us from the microorganisms we encounter every day. In order to fulfil their function, these cells must migrate to sites of infection or tissue injury, and do so faster than any other migrating cell in the body. Once there, they take up bacteria and kill them, and contribute to wound healing in incompletely defined ways. In order to find areas of tissue damage and infection, these cells are able to detect gradients of chemical messengers called “chemoat-tractants”, and migrate up the gradient toward the area in question. On contact with pathogens, and some other chemoattractants, neutrophils in particular be-come “activated”. This renders them more capable of ingestion (phagocytosis), bacterial killing, and degranulation. Degranulation refers to the loss of neutrophil granules into the tissues around the immune cells. Neutrophil granules contain antibacterial peptides, and proteases which aid clearance of infection, but can also harm the host. Thus, understanding neutrophil movement and activation are important steps in understanding how we defend ourselves against disease, and how we can be harmed by inappropriate activation of these cells. In order to prevent this unwanted activity, neutrophils require a two step activation pro-cess. They must first be “primed” by exposure to a range of bioactive substances, such as Tumor Necrosis Factor (TNF) or a complement. After this, a “second hit” such as lipopolysaccharide (LPS) or formyl-methionyl-leucyl-phenylalanine (fMLP) can cause degranulation, and respiratory burst. This is the process of activation, and is usually assessed in living cells using assays of “shape change”. These assays are generally performed using changes in patterns of light scat-ter at flow cytometry [2] to infer shape change in response to chemoattractants such as fMLP (a synthetic analogue of bacterial cell wall peptides). We aim to
transfer these assays to anin vivosituation using image processing algorithms to
infer neutrophil activation state from dynamic changes in shape [3]. To do this we have imaged transgenic zebrafish expressing GFP exclusively in neutrophils,
using the Tg(mpx::GFP)i114 transgenic line [4].
Our aim is to use transgenic zebrafish models to study neutrophil function
during inflammationin vivo. Individual neutrophils are imaged as they respond
the neutrophils with a hysteresis thresholding, then applied a tracking algo-rithm [5] based on a “keyhole” model that describes the probable movement of fluorescently labelled neutrophils travelling in zebrafish and finally analysed the shape of the neutrophils in 3D with a series of measurements as a function of time.
2
Materials and Methods
2.1 Image acquisition and processing
Zebrafish larvae were anaesthetized by the addition of 0.017% Tricaine to the E3 medium in which they were maintained [6]. GFP was visualized by excitation
with the 488nm laser line. Images were acquired at 20-22◦C using a Perkin-Elmer
UltraVIEW VoX spinning disk confocal microscope mounted on an Olympus BX61 d driven by Volocity 5.0 software (Perkin Elmer Inc., Waltham).
2.2 Algorithm description
The algorithm consisted of the following steps:
1)Pre-processingtransformed the data into a sequence of binary images that contained segmented foreground objects (neutrophils). Computational complex-ity (number of operations and time required to process) was reduced by lev-els like a Gaussian Pyramid [7]. For each level, groups of 4 contiguous voxlev-els were averaged and their mean value assigned to a new pixel thus halving the rows and columns dimensions. Two levels of the pyramid reduced the data from
1000×1000×24 to 250×250×24 voxels. Besides reducing the dimensions, a
smoothing effect was produced and noise was reduced. The intensities of each frame were thresholded with a hysteresis threshold as follows: voxels below a lower threshold were classified as background, and those above a higher thresh-old were classified as neutrophils. The remaining voxels, between these two levels, were then classified as neutrophils if they were in contact with voxels above the high threshold or background otherwise. Both thresholds were automatically de-termined using Otsu’s algorithm [8], first on the reduced data for the high level and the logarithm of the data for the lower level. Once the neutrophils had been segmented, they were individually labelled. Finally, the centroids of each seg-mented neutrophils were determined, together with the distances that separated them from neighbours, if any.
2) Tracking linked the objects in contiguous frames to form the tracks by means of a keyhole model [5], which predicted the most probable landing position
of a neutrophil at timet+ 1 from the position in times t−1 and t. The most
probable step for a neutrophil that is moving from frame t−1 to frame t, is
to follow the direction of the previous steps with the same velocity to frame
t+ 1. If we assume that a child neutrophil will move with the same direction
neutrophil is most probable to land were therefore defined: a narrow wedge (60◦
wide) oriented towards the predicted landing position, and a truncated circle
(300◦) that complements the wedge; together they resemble a keyhole. Once all
segmented neutrophils had been examined for possible parent-child relationships, a reduced number of them formed a series of tracks of different lengths.
3) Post-processing removed links in tracks that could have resulted from noise, and joined sections that were considered to be split sections from a single track. The same keyhole model was used analysing the movement backwards.
That is, the same keyhole model used child (t+ 1) and grandchild (t+ 2) to
generate a keyhole at time (t). If the neutrophil of a previous time point was
found to land inside the keyhole, it remained as part of the track, otherwise it was removed. Finally outliers were removed: those tracks whose average velocity exceed 3 times the standard deviation from the mean average velocity of the whole distribution were discarded together with tracks of 3 or less hops. One hop was a link between consecutive frames, thus only objects that were tracked between 5 or more frames were considered. In some cases, as neutrophils moved next to each other, they were too close to be distinguishable by the segmentation algorithm. In this case, the algorithm recorded which neutrophils formed the merger, together with their volumes. These data were later used to identify the individual objects, if the merged neutrophil split into two.
4)Morphological Analysis. The last stage of the algorithm estimated a series of measurements related to the morphology of the neutrophils. The following measurements were extracted from each individual neutrophil (segmented ob-jects) at every frame:
– Sphericity,
– Tortuosity,
– End points of a centre line.
Sphericity measured how compact or close to a perfect sphere each object was [9]. It was calculated as the ratio of surface of a sphere with equivalent
volume to the surface of the object: Sp = (36πVS2)1/3 where V is the actual
volume of the object andS is the object’s surface. A perfect sphere hadSp= 1,
and any other volume a value lower than 1. For the two other measurements, the centre lines of each object were obtained in the following way. For each 2D slice of the object, a centre line was obtained by a parallel thinning algorithm (Lam et al., 1992), which deleted successive layers of pixels on the boundary of the object until a line-like (similar to a skeleton) representation of the algorithm remained.
The tortuosity was calculated as the arc-chord ratio:T o= 1
N
PL
C , whereLis
the total distance of each segment of the centre line (in case there were branching
points), C is the Euclidean distance between the extremes of the segment and
N is the number of segments of the centre lines. The last measurement was the
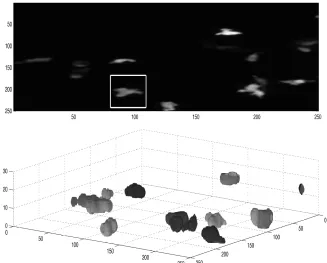
Fig. 1.(a) Maximum intensity projection of all slices, white box denotes a Region of Interest with a single neutrophil. (b) Volume rendering of all segmented neutrophils of the first frame. zaxis (upwards) corresponds to the slices of the volume, while x, y
axis correspond to rows and columns. Random shades of grey were assigned for visual purposes.
3
Results
The algorithm was tested with a 344 frame sequence, each frame consisting of a
1000×1000×24 voxel volume stored as 24tiffimages. Neutrophils have variable
size, intensity and shape (Fig. 1a) and they are distributed through the rows, columns and slices of the volume (Fig. 1b). Although it is not immediately clear from the volume rendering, the pseudopods of some neutrophils may extend through different slices, and if the segmentation were to be performed in 2D, these would be segmented as two separate objects. It is therefore very important to segment the data in 3D.
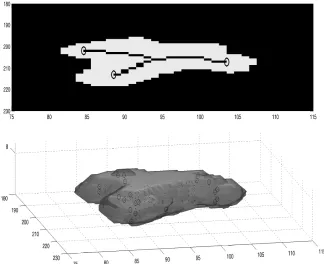
sometimes used for neutrophils [10]. When this centre line was extracted for all the slices spanned by the neutrophil (Fig. 2b), the complexity, in terms of tortuosity and number of end points was averaged to obtain a single value for the neutrophil.
Fig. 2.A single neutrophil from the ROI in Fig. 1. (a) A single slice of the segmented neutrophil with the centre line and end points overlaid in black, (b) Volume render of the neutrophil.zaxis (upwards) corresponds to the slices of the volume, whilex, yaxis
correspond to rows and columns. Dots represent the points of centre lines at each slice and circles represent the end points of each centre line.
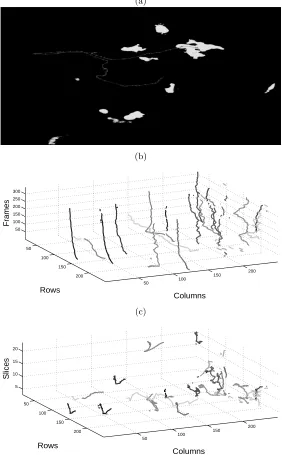
The tracking algorithm produced a series of 4D vectors [row×column×
slice×time] for each neutrophil. These vectors can reveal different information depending on the way they are displayed. Fig. 3a shows a well-known plot of a single track overlaid on a slice of the intensity data, with arrows added to indicate the direction of movement of each hop. The next two figures show 3D
plots with rows and columns in thex, yaxis with time as thez-axis (Fig. 3b) and
volume slices as thez-axis (Fig. 3c), the colour of the tracks denotes the velocity
the 2D plot helped to identify the movements a particular neutrophil of interest, the 3D plots revealed information of the population in a different way, both in terms of motility and speed. In Fig. 3b it is easy to identify the general direction of the neutrophils (most of them are moving towards the left) and its velocity (vertical tend to be slower than those with a slope). In Fig. 3c it is easier to perceive the directionality of the movement, some objects move towards a single direction while others seem to have a more erratic behaviour.
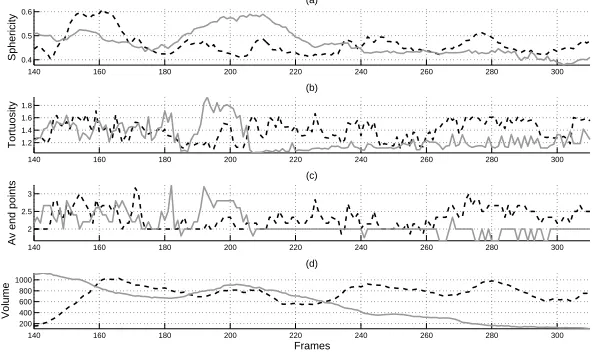
Three measurements of shape were obtained for all neutrophils: sphericity, tortuosity and average number of end points of the centre lines. In addition to these measurements, the volume of the objects was also analysed as it has been suggested that as neutrophils become activated, their volume increases with water [11]. The means and the standard error of the mean (black thick line and thin grey lines respectively) for all the objects in each frame are shown in Fig. 4. The sphericity showed an interesting trend: it increased in the first 50 frames and then it decreased with time, thus indicating an initial compaction of the neutrophils, which later became more irregular and possibly more acti-vated. This trend seemed to be correlated with the volume that also showed an initial increase and a posterior decrease. The tortuosity did not follow this trend, and, together with the average end points, showed a higher variability at periods where sphericity remained fairly constant (between frames 250 and 300 for instance). Whether this variation is due to a greater sensitivity of the measurements or a higher response to noise remains to be analysed.
In Fig. 5 the measurements of two neutrophils were plotted next to each other. One of them (dashed black line) again showed an increased sphericity at the same time as an increase in volume (frames 140-160) but this trend was not as pronounced when the second neutrophil (solid grey line) increased its sphericity (frames 180-210). The volume of the first neutrophil remained fairly constant while the second one decreased significantly with time.
As an indication of the computational complexity, the time to process 10
time frames each with 24 images of 1000×1000 pixels was 330 s (Matlab version
7.4.0 R2007a running on a MacBook Pro OS X 10.5.5 2.6 GHz Intel Core 2 Duo, 4 GB SDRAM). Individual subroutine times per frame were approximately: 6.6 s (read images into Matlab), 10.1 s (reduce the dimensionality of the data), 1.0 s (threshold data) 13.9 s (extract measurements of shape), 0.2 s (tracking algorithm).
4
Discussion
We have demonstrated the feasibility of shape analysis algorithms for the
in-vestigation of neutrophil function during inflammatory processes in vivo. The
position. In time, we hope to show how this data relates to functional changes within the neutrophil.
The zebrafish has considerable advantages over other models of cell tracking, since individual cells can be followed over time in living organisms. As vertebrates they are more similar to mammalian systems that other transparent model
or-ganisms such as the nematodeC. elegans. Other vertebrate models such as the
mouse require considerably more complicated procedures involving surgery [12]. In the case of the immune system, different classes of specialised phagocytic cells that we are interested in are not present below the vertebrates. Cells of the im-mune system have the advantage that their motility is rapid, and dependent on rapidly changing external cues, and that their shape is partly determined by the necessities of rapid locomotion, and environmental sensing. Changes in shape are a feature of activation, although the relationship between activation and the measures of shape changed used here remains to be determined.
A particular strength of this work is the integrated environment where track-ing and shape analysis can be performed together in an automatic way without need of manual selection of thresholds, cells or any other user interaction. All
the processing is done in Matlab, which although commercial is ade facto
stan-dard for engineering and computing and widely available, without the need to use different software packages for different procedures [13, 14]. The algorithms developed herein have many advantages over existing commercially available al-gorithms. First, it is important that the neutrophil segmentation is performed in three dimensions. Since the cells are irregular, if segmentation is performed in 2D, elongated pseudopods of a single neutrophil could appear as separate objects. Second, the use of hysteresis thresholding increased robustness to the segmentation compared with a single threshold that could include noise if it is set too low, or reduce the size of the objects and break them into separate ob-jects if set too high. Third, the tracking algorithm with the keyhole model of movement exploited the pattern of cell motility and was able to track several neutrophils simultaneously. When simpler models such as a circle or a square sliding window are used around the object of interest, the algorithms become more complicated and require extra steps, such as using Artificial Neural Net-works, which require training [15], or complex gain functions based on directional and speed coherence that need initialising [16] to resolve the uncertainties of the correspondence between objects. Methodologies to track leukocytes with active contours and Montecarlo methods have been presented in [17–19] where the shape and size of a leukocyte are used to track its movements adequately, yet these algorithms are restricted to the analysis of a single leukocyte of interest. Fourth, the post-processing stage added robustness to the tracking by discarding possible outliers and introducing extra rules, such as the volume comparison in cases where neutrophils merged and split.
activa-tion of neutrophils. For this purpose a manual analysis of a reduced number of neutrophils will be compared against the measurements made by the described algorithm.
It should be noted that the algorithm builds on the strength of the imaging procedures: the zebrafish model and the fluorescent labelling of the neutrophils. The labelling of the neutrophils is very important because this procedure allows their recognition by an intensity-based segmentation method. Under light mi-croscopy, the objects of interest would have to be detected in the presence of dense background clutter. in those cases a shape-based methods such as Conden-sation [20] would be required and it may be possible to use more sophisticated methods such as the one proposed in [16] to assign the correspondences between the objects in consecutive frames. Currently a technical difficulty of cell tracking algorithms such as this is that individual cells, when touching are difficult to sep-arate and appear as a single brighter object. Transgenic lines are in preparation which label the cell membrane with one fluorescent tag (such as GFP), and the cell nucleus with another, different coloured fluorescent protein (eg. mCherry - a red fluorescent protein), thus allowing discrimination of close or touching objects.
Since the final objective is to relate the changes in dynamic neutrophil shape and motion to the internal state of the neutrophil, and eventually to its state of activation, the important question is “How much can changes in the parameters measured be seen as changes in neutrophil activation?” We are not currently able to answer this question, but hope that future studies to address this will be illuminating. The zebrafish model gives us the ability to modulate the genetic makeup of the neutrophils, to favour an activated or inactivated phenotype. In parallel, the small size and permeability of the larvae to small molecules, mean that we can also pharmacologically manipulate the neutrophils.
These algorithms could easily be extended for models with more than one type of cell, the most obvious extension of this model being combination of macrophages and neutrophils, which is technically possible with current tech-nology. In addition, using different data acquisition parameters, they can be extended to any individually labelled cell population. Many such transgenically labelled cell populations exist in the zebrafish, and a large body of data has already been acquired. Image analysis of this data might provide insights into cell systems other than immune cell populations, and tracking of neuronal pro-genitors, or developing blood vessels would lend itself well to such an analysis.
5
Acknowledgements
The authors would like to acknowledge Catherine Loynes and Philip Elks for technical assistance in the acquisition of the data.
References
322(5904) (2008) 1065–9
2. Ehrengruber, M.U., Deranleau, D.A., Coates, T.D.: Shape oscillations of human neutrophil leukocytes: characterization and relationship to cell motility. J Exp Biol
199(Pt 4) (1996) 741–7
3. Edwards, S.W.: Biochemistry and Physiology of the Neutrophil. CUP, Cambridge (1994)
4. Renshaw, S.A., Loynes, C.A., Trushell, D.M., Elworthy, S., Ingham, P.W., Whyte, M.K.: A transgenic zebrafish model of neutrophilic inflammation. Blood108(13) (2006) 3976–8
5. Reyes-Aldasoro, C.C., Akerman, S., Tozer, G.M.: Measuring the velocity of flu-orescently labelled red blood cells with a keyhole tracking algorithm. J Microsc
229(1) (2008) 162–173
6. Nusslein-Volhard, C., Dahm, R.: Zebrafish. Practical Approach. OUP, Oxford (2002)
7. Burt, P.J., Adelson, E.H.: The laplacian pyramid as a compact image code. IEEE Trans on Communications31(4) (1983) 532540
8. Otsu, N.: A threshold selection method from gray level histograms. IEEE Trans on Systems, Man and Cybernetics9(1979) 62–66
9. Wadell, H.: Volume, shape, and roundness of quartz particles. Journal of Geology
43(3) (1935) 250–280
10. Lord, R.A., Roath, S.: Evaluation and comparison of neutrophil bipolar shape formation with a migration assay. J Clin Pathol43(4) (1990) 342–5
11. Griffith, A.W., Cooper, J.M.: Single-cell measurements of human neutrophil acti-vation using electrorotation. Anal Chem70(13) (1998) 2607–12
12. Tozer, G.M., Ameer-Beg, S.M., Baker, J., Barber, P.R., Hill, S.A., Hodgkiss, R.J., Locke, R., Prise, V.E., Wilson, I., Vojnovic, B.: Intravital imaging of tumour vascular networks using multi-photon fluorescence microscopy. Adv Drug Deliv Rev57(1) (2005) 135–52
13. Mathias, J.R., Perrin, B.J., Liu, T.X., Kanki, J., Look, A.T., Huttenlocher, A.: Resolution of inflammation by retrograde chemotaxis of neutrophils in transgenic zebrafish. Journal of Leukocyte Biology 80(6) (2006) 1281–1288
14. Lokuta, M.A., Nuzzi, P.A., Huttenlocher, A.: Calpain regulates neutrophil chemo-taxis. Proceedings of the National Academy of Sciences of the United States of America100(7) (2003) 4006–4011
15. Eden, E., Waisman, D., Rudzsky, M., Bitterman, H., Brod, V., Rivlin, E.: An automated method for analysis of flow characteristics of circulating particles from in vivo video microscopy. IEEE Trans Med Imaging24(8) (2005) 1011–24 16. Shafique, K., Shah, M.: A noniterative greedy algorithm for multiframe point
correspondence. IEEE Trans Pattern Anal Mach Intell27(1) (2005) 51–65 17. Cui, J., Acton, S.T., Lin, Z.: A monte carlo approach to rolling leukocyte tracking
in vivo. Med Image Anal10(4) (2006) 598–610
18. Ray, N., Acton, S.T., Ley, K.: Tracking leukocytes in vivo with shape and size constrained active contours. IEEE Trans Med Imaging 21(10) (2002) 1222–35 19. Acton, S.T., Wethmar, K., Ley, K.: Automatic tracking of rolling leukocytes in
vivo. Microvasc Res63(1) (2002) 139–48
(a)
(b)
50 100
150 200
50 100
150 200 50
100 150 200 250 300
Columns Rows
Frames
(c)
50 100
150 200
50 100
150 200 5
10 15 20
Columns Rows
[image:12.612.167.449.69.524.2]Slices
50 100 150 200 250 300 0.55 0.6 0.65 Sphericity (a)
50 100 150 200 250 300
1.2 1.3 1.4 1.5 Tortuosity (b)
50 100 150 200 250 300
2.2 2.4 2.6 2.8
Av end points
(c)
50 100 150 200 250 300
[image:13.612.160.457.74.248.2]800 1000 1200 1400 1600 1800 Frames Volume (d)
Fig. 4. Measurements extracted from all the neutrophils. (a) Sphericity of the seg-mented volume, (b) Tortuosity of the centre lines, (c) Average number of end points of the centre lines, (d) Volume as number of voxels of the segmented objects. Black thick lines represents the mean for all the objects in each frame and thin grey lines the standard error of the mean. Changes in sphericity are smoother than tortuosity and average end points, this may be due to a greater sensitivity to change in shape of the two later measurements.
140 160 180 200 220 240 260 280 300
0.4 0.5 0.6
Sphericity
(a)
140 160 180 200 220 240 260 280 300
1.2 1.4 1.6 1.8 Tortuosity (b)
140 160 180 200 220 240 260 280 300
2 2.5 3
Av end points
(c)
140 160 180 200 220 240 260 280 300
200 400 600 800 1000 (d) Volume Frames
[image:13.612.160.457.367.543.2]