An Alternative Protection Strategy for
Multi-terminal HVDC
Frederick Page, Stephen Finney, Lie Xu
Power Electronics, Drives and Energy Conversion groupUniversity of Strathclyde Glasgow, UK [email protected]
Abstract—Development of multi-terminal HVDC has been held back by the lack of adequate dc breakers. This has led to a number of novel breaker designs being developed by manufacturers. However, perceived operating time constraints have resulted in complex solutions with associated cost and size penalties. For this reason system operators have yet take up any of the proposed designs for use within real systems. To realise any multi-terminal system the cost of the dc breakers must, therefore, be reduced. Given that the complexity of the breakers is driven by the requirements of their speed it is prudent to question why there is this requirement. A relaxation of the operational speed will enable simpler, cheaper solutions to appear, in turn assisting the economic case of multi-terminal systems. This paper re-evaluates the requirements for dc circuit breakers with an emphasis on the impact of dc faults on converter stations and ac connections. It is shown that ultra-fast dc breakers are not necessary in order to have adequate performance from the ac grid’s point of view. The converter is also shown to survive for the required period of time. This allows slower, less complex dc breakers to be used, which could lead to a swifter uptake within commercial systems and eventually multi-terminal systems.
HVDC; Modular Multi-level Converter; DC Breakers
I. INTRODUCTION
The drive to produce a larger proportion of electrical energy from renewable sources has led to the rapid growth in wind generation. Within Europe planning constrains and high average wind speeds has driven interest in large scale exploitation of offshore wind resources.
Increasing distances from shore result in long subsea cables, which present difficulties for conventional high voltage ac (HVAC) connections. High voltage dc (HVDC) has been proposed for this purpose for some time and has been found, in some cases, to be both technically feasible and economically favorable over equivalent HVAC arrangements [1] [2].
The dc connection of offshore wind has been facilitated by the emergence of high capacity voltage source converters (VSC). Unlike ‘classic’ line commutated converter (LCC) based HVDC these allow full control over both active and reactive power flowing between the converter and the local ac grid (or wind-farm). This makes them ideal for connecting to weak or islanded ac systems such as wind farms [3].
Power reversal within an LCC system requires the dc voltage to change polarity. This presents a problem if multiple converters are to be linked through a common HVDC network. VSC HVDC operates with a fixed dc supply and the magnitude and direction of current flow is altered in order to change the power flow making this technology well suited to network applications.
To date systems have been point-to-point. Through the use of VSC technology, multi-terminal systems are possible, which allows several converters to be connected to a common dc bus. Such multi-terminal systems bring potential benefits in terms of improved utilisation of cables and the provision of redundancy in larger meshed systems [4] [5].
Voltage source converters are susceptible to dc side faults, where the collapse in dc voltage causes the converter to turn into an uncontrolled ac rectifier drawing large currents from the ac grid which cycle through the converter [4]. With point to point cable systems there is no requirement to clear the fault as it can be assumed to be permanent. Power can no longer be exchanged between the two converters and the whole system may be shut down through the use of ac side protection. However, within a multi-terminal system this is desirable that the faulted area of network is isolated and the healthy areas would continue to exchange energy.
The first generation of VSC systems to be constructed have employed two-level converters, based on series connection of IGBTs. More recently this technology has been superseded by multi-level converters (typically variants of the modular multi-level converter (MMC)) with the resulting gains in efficiency and reduction in ac filter requirements[6].
MMC systems also contain no additional dc side capacitor and instead converter capacitance is split between the cells in each arm. During a fault the converter is blocked and the capacitors are isolated preventing discharge into the dc fault [7]. This improves the re-start capability of the converter as, depending on system topology, the amount of energy stored in the converter cells will dominate that of the parasitic cable capacitance, leading to a faster re-charge.
II. NEW PROTECTION STRATEGY
Fault ride through of a multi-terminal HVDC system will require dc circuit breakers which, by the nature of dc, are difficult to manufacture. The lack of natural zero current crossing, which is present in ac equivalents, presents a problem at high voltages – where relying on arc voltage to extinguish the dc current is impractical [8]. Recent designs for HVDC breakers utilise additional circuitry, be that passive resonant or active semi-conductor, to induce a current zero, to clear the fault. This makes them extremely complex and therefore expensive.
It has been assumed that it is critical in multi-terminal systems that dc breakers must isolated the faulted part of the network before the dc voltage falls below the peak of the ac envelope. This ensures that there is no interruption of power flow in the healthy areas of the system.
Studies to date have placed the required operation time at under 5ms and systems as fast as 2.5ms have also been proposed [9] [10]. The responsibility is therefore placed on the dc breakers to clear the fault before this point so that the converter can always maintain control of current flow from the ac side. To achieve these speeds requires complex devices with associated cost and size penalties. For offshore applications size and volume may be critical due to the high cost of space in off-shore platforms.
This paper re-evaluates the importance of dc voltage collapse in setting the speed requirement of dc circuit breakers. It instead focuses on the impact of the dc fault transient on the ac network and the stress it places on the converter components.
Given that faults on HVAC transmission lines must be cleared within 120ms it would be appropriate to adopt a similar criterion to fault clearance times within dc networks.
Rather than concentrating on the development of ultra-fast breakers, which appear to have such a high capital cost that they are unlikely be implemented, it is prudent to ask how slow can dc breakers be and still fulfil their functionality. That is, ensure that the disturbance to the ac grid is within acceptable limits and that the converters are not permanently damaged.
If, therefore, the system stays within the grid codes to which it connects and the converters are able to re-energise the system then the constraint of extremely fast dc breakers may be lifted. This paper aims to demonstrate that it may be possible to protect multi-terminal networks using much slower, less complex and, critically, cheaper dc breaker solutions. A representative three terminal system is used to demonstrate the concept of clearing a dc side fault with, relatively, slow dc breakers. It is shown that the impact of the ac connections may be kept to a minimum and the current within the converters remains within tolerable limits.
III. DEMONSTRATION SYSTEM
In order to demonstrate the functionality of clearing a faulty branch of a multi-terminal system a three terminal network has been used. This demonstrates the functionality of the dc breakers being used to clear a fault and isolate the faulted branch from the healthy area of the network, whilst minimising the complexity of the simulation model.
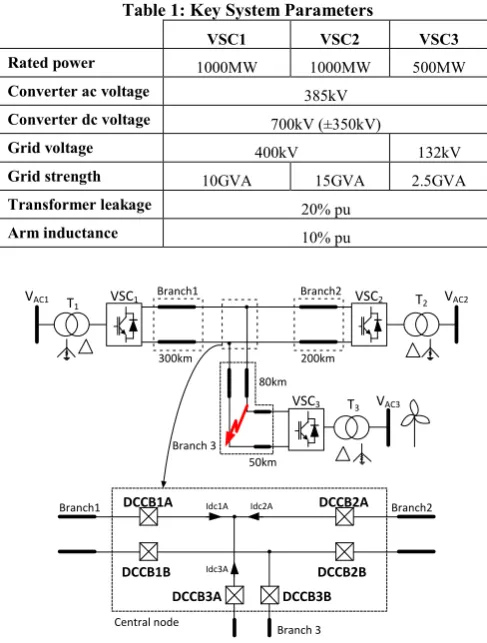
[image:2.595.303.547.115.437.2]The system is considered as a point to point link between independent ac networks with a spur connection to a wind-farm, as shown in Figure 1. The power ratings of the system have been chosen to represent realistic sizes, given the trend in growth of converters, given in Table 1.
Table 1: Key System Parameters
VSC1 VSC2 VSC3
Rated power 1000MW 1000MW 500MW
Converter ac voltage 385kV
Converter dc voltage 700kV (±350kV)
Grid voltage 400kV 132kV
Grid strength 10GVA 15GVA 2.5GVA
Transformer leakage 20% pu
Arm inductance 10% pu
VSC1 VSC2
VSC3
VAC2
VAC1 T
1 T2
T3
50km Branch1 Branch2
VAC3 80km
DCCB1A
DCCB1B
DCCB3A DCCB3B DCCB2A
DCCB2B Idc1A Idc2A
Idc3A Branch 3
Central node
300km 200km
Branch1 Branch2
Branch 3
Figure 1: Three terminal demonstration overview.
The converters are modelled as average value modular multi-level converters. These are faster to simulate than switched cell models, but replicate the same functionality in normal operation as well as during faults, although do not mimic the harmonic content of the voltage and current output.
The system includes dc breakers located on the positive and negative poles of each branch at the central node, as shown in Figure 1. These are used to isolate the faulted part of the system from the healthy areas.
A. Average value model
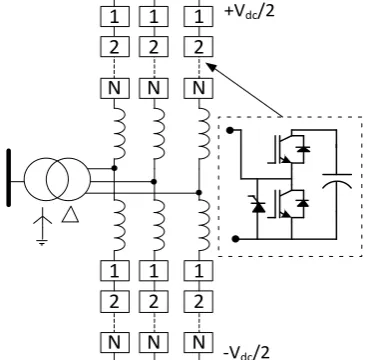
Modular-multi level converters contain large number, generally in the hundreds, of individual cells, or ‘sub-modules’, per arm, as shown in Figure 2. Each of these cells may be switched ‘on’ and ‘off’, impressing the capacitor voltage in series with the arm or excluding it. By controlling how many of these cells are on and off at any given time it is possible to produce a sinusoidal voltage output from the numerous discrete voltage levels. With enough cells the harmonic distortion of the current output at the grid is low enough that no additional ac filtering is required.
system level studies on pc based simulators. Many of these idealised models provide steady state operation satisfactorily, but do not replicate the action of the converter during faults [11, 12]. Further developments included additional circuit elements in order to represent converter blocking and fault current paths, but still use separate sections for the ac and dc side [13].
-Vdc/2
+Vdc/2
N 2 1 N 2 1
N 2 1 N 2 1
[image:3.595.77.261.139.319.2]N 2 1 N 2 1
Figure 2: Standard, detailed, MMC model. Each cell includes a bypass thyristor.
The equivalent circuit used for this study includes a scaled cell capacitor for each MMC arm, thus replicating the energy ripple in each arm over a cycle, as shown in Figure 3. This also allows the model to replicate current paths which may overcharge the cell capacitors, for instance during rapid ramping down of power into the ac grid or at worst case an ac fault [14, 15].
mVc
C/n Vc
Iarm
Iarm
Average cell Ty
S1 D2
D1
-Vdc/2
+Vdc/2
Figure 3: Average MMC model. A single cell is used in each arm, with an average cell internally. The cell contains all circuit elements necessary to replicate converter blocking and fault current paths.
B. DC Breakers
DC breakers are installed at the central node of the system in order to isolate the fault from the healthy section of system (Figure 1). There has been a large amount of literature published in the area on prospective designs [8] [16]. However, for the purpose of this paper it is only necessary to clear the fault. Therefore, a simple ideal switch and MOV model is used, as shown in Figure 4. When the switch is opened current is commutated into a non-linear resistance in a parallel path. This clamps the voltage to the desired level in order to force down the current, and isolate the fault.
A modest parallel capacitance (20µF) is required for the simulation to converge satisfactorily. The inductance in series with the non-linear resistance represents the stray inductance found due to the physical length of the MOV, which is non-negligible (10µH), given the voltage rating. A series, rate limiting inductance (100mH) is included in order to reduce peak current stress on the breaker [9]. The breaker is assumed to be relatively slow, at 25ms, when compared to the state of the art under development
Lsmov
MOV Cpmov
Breaker
Non-linear resistance Ldc
[image:3.595.326.537.161.237.2]DC reactor
Figure 4: Ideal dc breaker model consisting of an ideal switch and MOV to clamp the voltage and absorb energy
IV. SIMULATION RESULTS
To demonstrate the transient response of the system under a dc fault an example case is given. Firstly the power is ramped up at each of the power controlling terminals. The dc voltage controlling terminal then alters its power flow to match any imbalance in the system, in order to maintain the system voltage.
The fault is applied and protection is operated throughout the system as appropriate. The fault is cleared and the two healthy converters continue to exchange power. The faulted converter is disconnected from the ac grid with ac breakers and is then considered out of action. Time domain waveforms are given from key measurement points around the system so that the impact on the converters, ac network and dc system can be observed.
A. Steady state operation
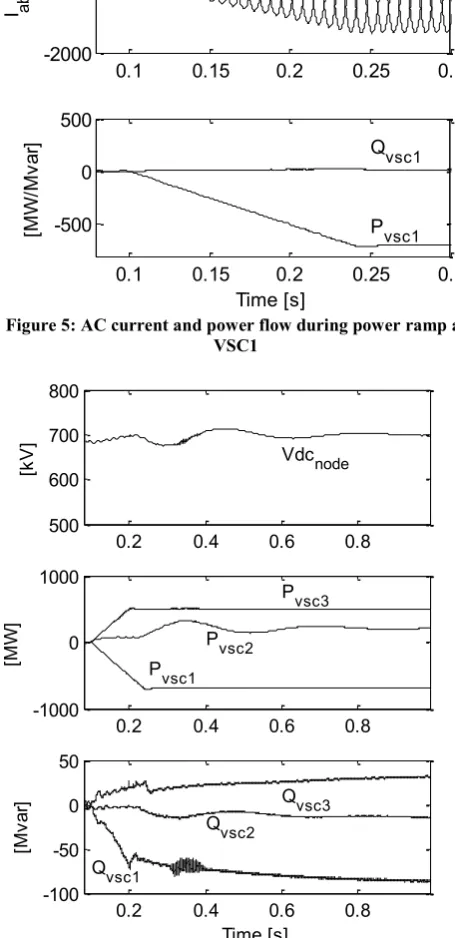
The power flows are built up in each converter to steady state operation before the fault is applied. Converter stations one and two are ramped up according to Table 2.
Table 2: Steady state station power demands
Station Power demand Ramp rate Start
VSC1 -700MW -5000MW/s 100ms
VSC2 400MW +5000MW/s 100ms
VSC3 N/A – DC Voltage control
Figure 5 shows the ac current and power flow for VSC1 The power flow follows the demand ramp to its set point of -700MW (700MW sourced to grid AC1). Reactive power is adjusted as necessary to maintain the nominal ac system voltage. AC current at the grid side is balanced.
[image:3.595.51.285.445.573.2]Figure 5: AC current and power flow during power ramp at VSC1
Figure 6: Real and reactive power flow in all three converters
B. Fault application
When the system has reached a steady state condition a fault is applied at one second into the simulation. A low resistance short circuit is placed between the positive and negative poles of branch three, as shown in Figure 1. The fault is permanent and does not clear when dc breakers produce a current zero, therefore re-closing the breakers and re-establishing power flow in the branch is not considered.
Faults are detected in each converter through one of the following; arm overcurrent, dc overcurrent, under/over dc voltage. On detection the converter is blocked and parallel thyristors are gated on, to draw current away from the free-wheeling diodes. If the fault detection persists then the ac
breaker is triggered after 35ms. On tripping the ac breaker then there is a further 50ms mechanical delay to open..
C. Central node dc current and dc breaker operation
DC breakers, located at the central. Measurements are taken locally on each branch at the node, so it is assumed that communication time delays are negligible while detecting and discriminating the fault. Once the fault has been detected and discriminated breakers on each pole of that branch are then tripped. The breakers are assumed to be reasonably slow and therefore a mechanical delay of 25ms is included before they open.
Shown below is the current in the positive pole of each branch and dc voltage as measured at the central node, Figure 7. The overcurrent trips the breakers 3A and 3B (see Figure 1). Upon the breakers opening the current in all three branches rapidly decays. Current in branch three (Idc3A) is brought to zero, isolating the fault from the healthy area of the system. The resulting current in branch two is higher to compensate for the outage of VSC3. DC voltage at the central node swiftly recovers once the dc breakers have begun to open, recovering to 80% of nominal within 28ms of the fault being applied.
Figure 7: DC current and voltage at the central node upon fault application
[image:4.595.50.278.112.582.2]When the fault is applied it propagates through the dc network extremely fast, as shown in Figure 8. The dc voltage collapses to zero in the first millisecond at the terminals of VSC3.
Figure 8: DC voltage, measured at the central node
The dc voltage at VSC1 and VSC2 go below 80% of nominal dc voltage within 3ms. It should be noted,
0.1 0.15 0.2 0.25 0.3 -2000
0 2000
I abc
[
A
]
0.1 0.15 0.2 0.25 0.3 -500
0 500
[M
W
/M
va
r]
Time [s]
Pvsc1 Qvsc1
0.2 0.4 0.6 0.8
500 600 700 800
[k
V
]
Vdcnode
0.2 0.4 0.6 0.8
-1000 0 1000
[M
W
]
Pvsc1 Pvsc2
Pvsc3
0.2 0.4 0.6 0.8
-100 -50 0 50
[M
va
r]
Time [s] Qvsc1
Qvsc2
Qvsc3
1 1.05 1.1 1.15 1.2
-10 -5 0 5
I dc
[
kA
] Idc1A
Idc2A
Idc3A
1 1.05 1.1 1.15 1.2
-500 0
500 Vdc+
V dc-V dc
[
kV
]
Time [s]
1 1.05 1.1 1.15 1.2
-500 0 500 1000
V dc
[
kV
]
Vdc1
Vdc2
[image:4.595.309.532.311.501.2] [image:4.595.311.530.597.738.2]however, that this in itself is not important. The majority of energy stored in the dc side is within the cell capacitors of the MMC, maintain their voltage when the converter is blocked. Hence, the dc voltage within the MMC system collapses much faster than for a two level converter because there is no reservoir dc capacitor to discharge. Similarly the MMC converter will recover faster once the dc fault is cleared.
D. Converter station ac voltage and current
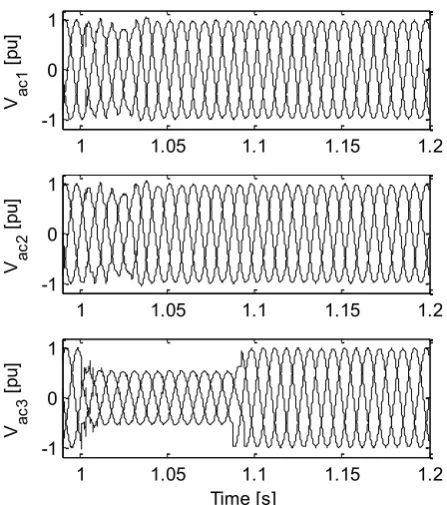
[image:5.595.311.532.52.305.2]Current is drawn through each of the three converters into the fault. This distorts the local ac network voltage as well as reducing its magnitude, as can be seen in Figure 9. The impact to Vac1 and Vac2 is clearly minor. There is a mild drop in voltage and it recovers within 40ms-50ms, when the dc breaker opens and isolates the fault.
Figure 9: Voltages at the point of common coupling for each of the three, independent ac networks
The reduction of Vac3 is more severe as well as prolonged as a result of the local ac grid strength being lower and the fault being closer. The ac network voltage recovers within approximately 100ms. Crucially though all ac network voltages recover within the 120ms time frame required for an ac transmission system.
The current drawn by the converters is given in Figure 10, as measured at the converter side of the transformer. The current through VSC1 and VSC2 are higher than that of VSC3 as transformer and arm impedances are smaller – in line with their higher rated power. The fault currents decay within approximately 35ms to 40ms in VSC1 and VSC2 when the dc breaker is opened. Normal current flow then begins to build back up as the dc voltage recovers. AC current in VSC3 continues for approximately another 70ms, until the ac breakers open.
Isolation of the fault quickly begins to restore voltage on the dc side. Converters VSC1 and VSC2 unblock and power flows to the ac networks are rapidly restored, as shown in Figure 11.
Figure 10: AC current for VSC1, VSC2 and VSC3, as
[image:5.595.50.274.232.485.2]measured at the converter side of the transformer
Figure 11: Recovery of converter real power flow
Clearly the wind-farm model used here is over-simplified. The almost instantaneous drop in power output from the converter has implications for the farm itself, such as increase in rotor speed. However, this is would be delt with in a similar way to a converter or ac fault and is outside the scope of this investigation. It is assumed that power output of the wind-farm may be curtailed satisfactorily.
Crucially though the impact of the fault is short in duration and the voltage recovers within the 120ms expected in standard HVAC transmission systems.
E. Converter survivability
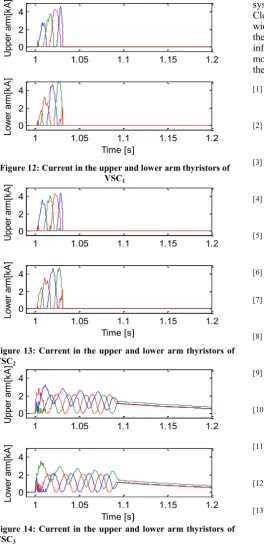
For the system to re-establish power flow in the healthy sections, after the fault is isolated, the converter components must not suffer any damage. Although the current that is drawn from the ac grid is high, it passes through the parallel thyristors, which have a much higher current capacity than the fast recovery, free-wheeling diodes within the cells. Figure 12, Figure 13 and Figure 14 show the current that is passed through the thyristors in the upper and lower arms of the three converters. Peak currents of 5kA are reached, however this is within the capabilities of high capacity thyristors [17].
1 1.05 1.1 1.15 1.2
-1 0 1
V ac
1
[
pu
]
1 1.05 1.1 1.15 1.2
-1 0 1
V ac
2
[
pu
]
1 1.05 1.1 1.15 1.2
-1 0 1
V ac
3
[
pu
]
Time [s]
1 1.05 1.1 1.15 1.2
-5 0 5
I abc1
[
kA
]
1 1.05 1.1 1.15 1.2
-5 0 5
I abc2
[
kA
]
1 1.05 1.1 1.15 1.2
-5 0 5
I abc3
[
kA
]
Time [s]
1 1.05 1.1 1.15 1.2
-1000 0 1000 2000
[M
W
]
Pvsc1 Pvsc2
[image:5.595.310.531.341.474.2]Figure 12: Current in the upper and lower arm thyristors of VSC1
Figure 13: Current in the upper and lower arm thyristors of VSC2
Figure 14: Current in the upper and lower arm thyristors of VSC3
I. CONCLUSION
The simulations here have shown that dc faults on a single branch of a multi-terminal network may be cleared using relatively slow dc breakers. The disruption to local ac network, in terms of voltage sag, is no worse than that experienced during a standard ac fault and is, therefore, tolerable.
This demonstrates that the proposed speed requirements for HVDC breakers have been over specified to date. A more relaxed requirement for the breakers will reduce their complexity, and more importantly cost – both in terms of capital and lifetime (due to losses). It is likely that resonant, mechanical breakers, similar to those developed for LCC
systems in the 1980’s, could suffice for this purpose. Clearly the results presented here need to be extended for a wider range of conditions. Future work is required to assess the disturbance to grid frequency, due to lack of infeed/export of power to the local ac grid. This requires more complex models which include simplified models of the larger ac network, including loads and rotating plant.
[1] N. M. Kirby, M. J. Luckett, L. Xu, and W. Siepmann, "HVDC transmission for large offshore windfarms," in AC-DC Power Transmission, 2001. Seventh International Conference on (Conf. Publ. No. 485), 2001, pp. 162-168.
[2] X. Kong and H. Jia, "Techno-Economic Analysis of SVC-HVDC Transmission System for Offshore Wind," in Power and Energy Engineering Conference (APPEEC), 2011 Asia-Pacific, 2011, pp. 1-5.
[3] X. M. Fan, L. Guan, C. J. Xia, J. M. He, S. K. Xu, and X. L. Li, "Active power control of VSC-HVDC transmission linked islanded wind farm," in Renewable Power Generation Conference (RPG 2013), 2nd IET, 2013, pp. 1-6.
[4] Y. Jin, J. E. Fletcher, and J. O'Reilly, "Multi-terminal DC wind farm collection and transmission system internal fault analysis," in Industrial Electronics (ISIE), 2010 IEEE International Symposium on, 2010, pp. 2437-2442.
[5] L. Weixing and B. T. Ooi, "Multi-terminal HVDC as enabling technology of premium quality power park," in Power Engineering Society Winter Meeting, 2002. IEEE, 2002, pp. 719-724 vol.2.
[6] L. G. Franquelo, J. Rodriguez, J. I. Leon, S. Kouro, R. Portillo, and M. A. M. Prats, "The age of multilevel converters arrives," Industrial Electronics Magazine, IEEE, vol. 2, pp. 28-39, 2008. [7] G. Yang, M. Bazargan, X. Lie, and L. Wuxing, "DC fault analysis of MMC based HVDC system for large offshore wind farm integration," in Renewable Power Generation Conference (RPG 2013), 2nd IET, 2013, pp. 1-4.
[8] C. Meyer, M. Kowal, and R. W. De Doncker, "Circuit breaker concepts for future high-power DC-applications," in Industry Applications Conference, 2005. Fourtieth IAS Annual Meeting. Conference Record of the 2005, 2005, pp. 860-866 Vol. 2. [9] B. J. JÜRGEN HÄFNER, "Proactive Hybrid HVDC Breakers -
A key innovation for reliable HVDC grids " presented at the The electric power system of the future- Integrating supergridds and microgrids, Bologna, Italy, 2011.
[10] A. Twenties. (2013). Feasibility tests of Direct Current Circuit Breaker prototype in DEMO3-DCGRID: breaking test
demonstration. Available:
http://www.twenties-project.eu/system/files/Feasibility-test-DEMO3.pdf
[11] J. Peralta, H. Saad, S. Dennetiere, J. Mahseredjian, and S. Nguefeu, "Detailed and averaged models for a 401-level MMC-HVDC system," in Power and Energy Society General Meeting (PES), 2013 IEEE, 2013, pp. 1-1.
[12] J. Xu, A. M. Gole, and C. Zhao, "The Use of Averaged-Value Model of Modular Multilevel Converter in DC Grid," Power Delivery, IEEE Transactions on, vol. PP, pp. 1-1, 2014. [13] H. Saad, J. Peralta, S. Dennetiere, J. Mahseredjian, J.
Jatskevich, J. A. Martinez, et al., "Dynamic Averaged and Simplified Models for MMC-Based HVDC Transmission Systems," Power Delivery, IEEE Transactions on, vol. 28, pp. 1723-1730, 2013.
[14] D. C. Ludois and G. Venkataramanan, "Simplified Terminal Behavioral Model for a Modular Multilevel Converter," Power Electronics, IEEE Transactions on, vol. 29, pp. 1622-1631, 2014.
[15] N. Ahmed, x, L. ngquist, S. Norrga, and H. P. Nee, "Validation of the continuous model of the modular multilevel converter with blocking/deblocking capability," in AC and DC Power Transmission (ACDC 2012), 10th IET International Conference on, 2012, pp. 1-6.
[16] C. M. Franck, "HVDC Circuit Breakers: A Review Identifying Future Research Needs," Power Delivery, IEEE Transactions on, vol. 26, pp. 998-1007, 2011.
[17] ABB, "5STP 45Q2800 Phase control Thyristor," ed. March 2014: ABB, 2014.
1 1.05 1.1 1.15 1.2
0 2 4
U
pp
er
a
rm
[k
A
]
1 1.05 1.1 1.15 1.2
0 2 4
Lo
w
er
a
rm
[k
A
]
Time [s]
1 1.05 1.1 1.15 1.2
0 2 4
U
pp
er
a
rm
[k
A
]
1 1.05 1.1 1.15 1.2
0 2 4
Lo
w
er
a
rm
[k
A
]
Time [s]
1 1.05 1.1 1.15 1.2
0 2 4
U
pp
er
a
rm
[k
A
]
1 1.05 1.1 1.15 1.2
0 2 4
Lo
w
er
a
rm
[k
A
]