Analysis error covariance versus posterior covariance in variational data assimilation
Full text
Figure


Related documents
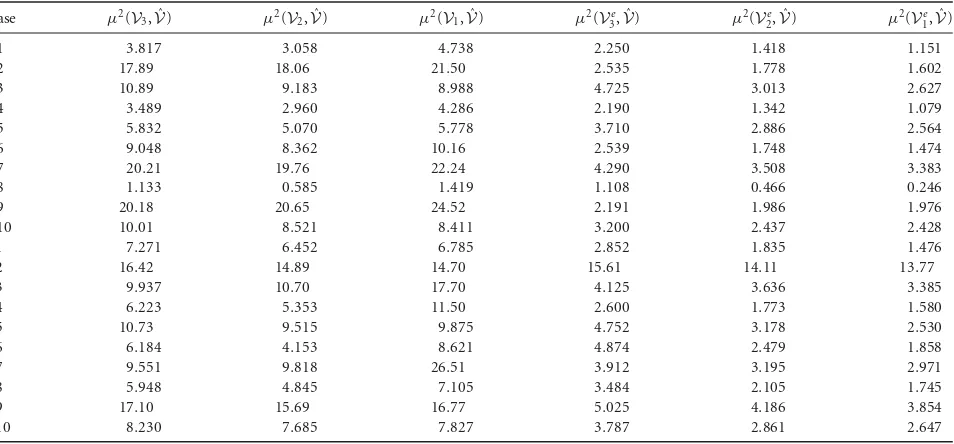
Each row of this table shows results for one reconfiguration request ( C I , C R , and t ), and respec- tively presents the number of: peers, distinct basic activities used in the
impaired iron absorption regulation associated with increased iron ab- sorption and iron overload (74), seemingly proposing im- portant role of β 2 -microglobulin in
Total phenolic content and in vitro antioxidant activities by using DPPH and β - Carotene/linoleic acid assay of methanolic extract from
The politically determined tax rate is decomposed to the marginal external damages, the imperfect competition effect, and the lobbying effect.. Under linear demand and cost
For regression problems, we report the root mean squared error (RMSE) for linear regression (no feature shaping), additive models with shaping with splines or trees (penalized
Dell'Ariccia (1999) uses the gravity model explaining bilateral trade by importer and exporter’s GDP, distance, importer and exporter’s population, dummy variables (i.e.,
