Metabolic scaling in solid tumours
E. Milotti
1,2, V. Vyshemirsky
3, M. Sega
4, S. Stella
1& R. Chignola
41Department of Physics, University of Trieste, I-34127 Trieste, Italy,2Istituto Nazionale di Fisica Nucleare (INFN, Italian Institute of Nuclear Physics) – Sezione di Trieste, I-34127 Trieste, Italy,3Department of Mathematics and Statistics, University of Strathclyde, G1 1XH Glasgow, Scotland, UK,4Department of Biotechnology, University of Verona, I-37134 Verona, Italy.
Tumour metabolism is an outstanding topic of cancer research, as it determines the growth rate
and the global activity of tumours. Recently, by combining the diffusion of oxygen, nutrients, and
metabolites in the extracellular environment, and the internal motions that mix live and dead cells, we
derived a growth law of solid tumours which is linked to parameters at the cellular level
1. Here we use this
growth law to obtain a metabolic scaling law for solid tumours, which is obeyed by tumours of different
histotypes both
in vitro and in vivo, and we display its relation with the fractal dimension of the distribution
of live cells in the tumour mass. The scaling behaviour is related to measurable parameters, with potential
applications in the clinical practice.
R
ecently we derived a growth law for solid tumours
1, where growth depends on the distribution of live cells in
the tumour mass. The model was suggested by the results of computer simulations
2, and it has been
validated using data from
in vitro
experiments. In this model the inter-vascular micro-regions of solid
tumours contain both live and dead cells, and the fraction of live cells is exponentially smaller as the distance from
the sources of nutrients and oxygen increases. Although the decay length
l
is weakly dependent on tumour size,
we found that an effective, size-independent
l
works nearly as well, and that
l
has values mostly in the range 50–
150
m
m. Notably, this is also the distance from the nearest blood vessel where the interstitial pO
2assumes hypoxic
and anoxic values and pH drops to acidic values in the micro-regions of vascularized tumours
3, and corresponds
to the typical thickness of the viable tumour cell layer around blood vessels
4. Here we show how the growth law
can be combined with basic metabolic parameters to yield a seemingly universal metabolic scaling law for
tumours, that holds both
in vitro
and
in vivo
.
We start from the tumour growth law, that can be expressed as a differential equation for tumour volume, and
combines proliferation of live cells in the tumour with the gradual shrinking of dead cells
1dV
dt
~
ð
a
z
d
Þ
V t
ð Þ
F V t
½
ð Þ
{
d
V t
ð Þ
;
ð
1
Þ
where
F V
ð Þ
~
3l
3l
z
ð
V
=
A
Þ
1=3ð
2
Þ
is the fraction of live cells in the tumour, derived from the assumption of exponential decay of the density of live
cells, so that the total volume of live cells is
V
a5
F
(
V
)
V
, and where the parameter
a
defines the individual cell
proliferation rate, while the parameter
d
is the shrinking rate of dead cells. The tumour volume is proportional to
x
3, where
x
is some characteristic length of the tumour, i.e.,
V
5
Ax
3. In the case of spherical tumours
A
5
4
p
/3
<
4.2, and
x
is the tumour radius, but here we consider the possibility of departure from a spherical shape. Still, we
assume that the tumour keeps roughly the same shape as it grows, so that
x
can be chosen as a substitute for radius,
e.g., as the length of a given chord between two fixed, recognizable surface features of the tumour shape. We note
that
A
is one of the factors that set the rate of tumour growth, at least for large tumour sizes, since in that case
F V
ð Þ
<
3l
A
1=3V
{1=3, and the growth term in Eq. (1) depends explicitly on
A
:
dV
dt
<
3l
A
1=3
ð
a
z
d
Þ
½
V t
ð Þ
2=3
{
d
V t
ð Þ
ð
3
Þ
In the context of this model, the nutrient consumption rate
m
of the whole tumour is given by the number of live
cells in the tumour
F
(
V
)
V
/
v
c, times the mean consumption rate per cell
c
SUBJECT AREAS:
POWER LAW CANCER METABOLISM CANCER MODELS BIOLOGICAL PHYSICSReceived
1 March 2013
Accepted
17 May 2013
Published
3 June 2013
m
~
c
F V
ð Þ
V
v
c~
g
3l
V
3l
z
ð
V
=
A
Þ
1=3;
ð
4
Þ
where
v
cis the mean tumour cell volume, and
g
5
c
/
v
cis the mean
nutrient consumption rate per cell and unit volume. We remark that
Eq. (4) shows that the nutrient consumption rate interpolates
between a linear behaviour
m
<
g
V
ð
5
Þ
at small tumour size, and a power law with exponent
a
5
2/3
m
<
3lg
A
1=3V
2=3ð
6
Þ
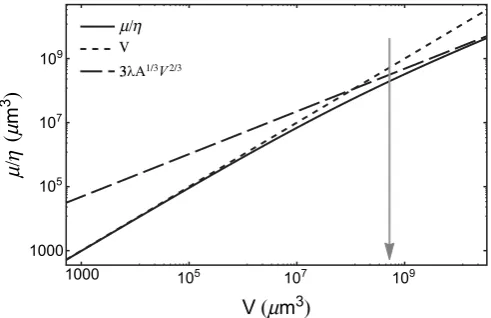
at large tumour size (see Fig. 1).
At this point we stress that the rate
g
5
c
/
v
cis cell-type specific,
while the area parameter
A
depends on the kind of tumour (and
therefore on the cell type), on the particular tumour history, and
finally on the choice of the characteristic length
x
. These latter two
dependences should normally be weak, if we assume that
x
is always
close to the diameter of a nearly spherical shape, and that the
development of a given kind of tumour is roughly the same in
dif-ferent experimental or clinical settings.
Results
We have considered the experimental values of the normalized rate
^
m
~
m=g
of glucose consumption in tumour spheroids obtained from
different cell lines, as well as in different histotypes of primary and
metastatic human solid tumours grown in rats
5–12(see Methods).
This normalization factors out the specific metabolic consumption
of different cell lines. From individual fits of each data set we find that
they are well described by
^
m
ð Þk~
m
g
k~
3l
kV
3l
kz
ð
V
=
A
kÞ
1=3ð
7
Þ
where
g
kis the cell-line specific consumption rate, and
l
kand
A
kare
the parameter values obtained for the corresponding
k
-th data set.
The values
l
kand
A
kobtained in these fits are reported in Table 5 in
Methods, and we notice that
l
kvaries in a very limited range, while
A
kdiffers markedly in
in vitro
and
in vivo
tumours. The specific
values
A
kwere used to define the doubly normalized rate
^
m
ð ÞNk~
^
m
k
ð Þ
A
k~
m
g
kA
k~
3l
ð
V
=
A
kÞ
3l
z
ð
V
=
A
kÞ
1=3~
3l
z
3l
z
z
1=3ð
8
Þ
where
l
is an effective value of the parameter – which is justified
by the limited variation found in the fits – and
z
5
V/A
. Using
the redefined rate
m
^
ð ÞNk~
m=g
kA
k, all individual data points
V
ið Þk=
A
k,
m
ð Þik=g
kA
k(
i
-th experimental value of the
k
-th data set),
from both
in vitro
and
in vivo
tumours, follow one common curve
^
m
N~
^
m
N
ð Þ
z
, shown in Fig. 2, that depends on the effective parameter
l, which we estimate from the fit.
[image:2.595.310.547.482.633.2]While we discuss the whole selection of data in the Methods
sec-tion, here it is important to note that in the case of human tumours
in
vivo
we must cope with the scarcity of available data. Indeed, for each
data set we need the metabolic rate – i.e., rate of glucose consumption
– of individual cells, their average volume and the metabolic rate of
the corresponding tumours, and the combined knowledge of these
data is quite rare. Therefore we group the few complete data on
human tumours
in vivo
in a single data set, and this produces an
additional variability which is not accounted for by the model.
However, we find that the
g’s for different human tumours all lie
within a factor 2 of their average (see the Methods section). While
this adds to the fluctuations about the scaling curve, we note that
log
102
<
0.3, and that the largest fluctuation about the scaling curve
is about 0.4 – 0.5 as measured on the log scale of Fig. 2, and therefore
we see that the largest contribution to the observed fluctuations is due
to this uncertainty on the value of
g. We also remark that the
fluctua-tions are partly due to our using the same
A
kfor all tumours of the
k
-th cell line, while, strictly speaking,
A
is a parameter related to an
individual tumour. Since the tumours in our dataset follow rather
neatly the scaling curve in Fig. 2, we argue
a posteriori
that the
contribution to fluctuations due to different
A
’s and to different
tumour environments is less than about 0.2 on the log scale of the
figure – i.e., a factor smaller than 1.6 on the total tumour metabolic
rate.
Even so, data points seem to follow rather nicely the predicted
model behaviour, and the curve of Fig. 2 provides an indirect
con-firmation of the validity of the growth law in real tumours. Moreover,
there seem to be common mechanisms that drive the growth of solid
Figure 1
|
Plot of the normalized nutrient consumption rate^m~m=g(mm3) vs. tumour volume V (mm3), as given by Eq. (4) (solid line).Here we
assume a spherical shape andl5100mm, which is close to the values
found in experimental tumour spheroids1. The dotted line is the normalized ratem^from Eq. (5), while the dashed line is^mfrom Eq. (6). The
volume range corresponds to a minimum radius of 5mm (i.e.,
approximately a single cell), up to a maximum of 2000mm. The arrow
[image:2.595.44.290.485.644.2]marks the volume corresponding to a nearly spherical avascular tumour with a diameter of 1 mm.
Figure 2
|
Doubly normalized glucose consumption ratem^N~^mNð Þz vs. z (z5V/A). Here we take glucose as representative of all nutrients (see Methods). The black line is a single fit of Eq. (8) to all data shown in the figure: the fit yieldsl510262mm, and it is compatible with the values found in the analysis of growth curves of tumour spheroids1. The dotted line is the linear approximationm^N<z, Eq. (5), at small tumour size, whilethe dashed line is the approximationm^N<3lz2=3, Eq. (6), at large tumour size. Data from human tumours (green circles) include breast, uterine and ovarian carcinomas, melanomas, thyroid carcinomas, colon and lung carcinomas.
109
107
105
105 107 109
1000 1000
V
(
μ
m
3)
V(
μ
m
3
)
μ
/
η
μ/η
3lA1/3V 2/3
10 μ/ηA
V/A (μm3)
(
μ
m
3)
(V/A)
3l(V/A)2/3 9
108
107
106
106 107 108 10
Human tumours in vivo 9L spheroids Rat1–T1 spheroids MR1 spheroids
9 1010
N
μ
tumours, in spite of their recognized biological differences. These
mechanisms are necessarily related to parameters
l
and
A
.
Discussion
We discuss the role of parameter
l
first, starting from the remark that
the volume taken by live cells is
1V
að Þ
x
~
F x
ð Þ
V x
ð Þ
~
3l
3l
z
x
Ax
3
ð
9
Þ
Eq. (9) shows that the volume of live cells scales as
V
a(
x
)
,
x
D, with
a size-dependent fractal dimension
D
~
d
ln
V
ad
ln
x
~
3
{
x
3l
z
x
ð
10
Þ
and that
l
determines this fractal dimension, which interpolates
between
D
5
3 at small
x
, and
D
5
2 at large
x
(see Fig. 3). This
behaviour is not associated to any irregularity of the external tumour
boundary surface, but rather to the dispersion of live cells in the
tumour tissue, as viable cells are mostly concentrated close to the
tumour surface in tumour spheroids or to blood vessels in
vascular-ized tumours, and gradually die away in the deeper layers
1. This
fractal behaviour may remind one of the nutrient distribution
net-work of the West, Brown, and Enquist
13(WBE) model, which has a
fractal-like subdivision, down to a ‘‘minimum tube size’’, and leads to
a scaling law for the basal metabolic rate of living organisms which is
a power-law with exponent 3/4. However, in the case of solid
tumours we do not find a single power-law, but rather a curve which
interpolates between two different power-laws, Eqs. (5) and (6).
Indeed, the concept of ‘‘minimum tube size’’ of the nutrient
distri-bution network introduced in the WBE model
13does not apply here,
since the data shown in Fig. 2 include both avascular and vascularized
tumours: it is the very fine-grained fractal behaviour associated to the
distribution of live cells – and therefore the value of parameter
l
–
that actually determines the observed metabolic scaling in the case of
tumour spheroids and solid tumours.
We already noticed in reference 1 that
l
somehow summarizes the
interplay of different microscopic processes – most notably, the
dif-fusion of nutrients and toxic metabolites, and the biomechanical
mixing of cells – and thus the exclusive dependence of the scaling
law (8) on
l
seems to downplay the role of the other parameter
A
,
which is related to the overall shape of the tumour. As remarked
above,
A
is one of the factors that set the timescale of tumour growth
and has an importance of its own, as it determines both the total
tumour volume,
V
5
Ax
3, and the tumour surface area,
S
<
3
Ax
2. It is
also important to stress that
S
corresponds to the boundary between
the bulk of the tumour mass and the non-cancerous environment,
and this includes the interface between tumour and blood vessels,
even where they penetrate the tumour mass (see Fig. 4).
In the case of highly vascularized tumours we expect to find large
values for
A
, and indeed the human tumours included in Fig. 2 yield
values of
A
much larger than those found in avascular
in vitro
models
(see Table 5 in Methods).
The wide-range generality of scaling law (7) – or its ‘‘doubly
nor-malized’’ version (8) – is noteworthy, and points to a common
mech-anism that drives tumour growth and bypasses the details of
vascularization and the peculiarities of different histotypes. More
accurate and specific experiments could establish this law with
greater precision, and eventually lead to a clinical scale of tumour
progression from measurements of glucose consumption.
Methods
Here we provide detailed information on selection and analysis of the experimental data that we used to test the metabolic model for solid tumours. We discuss the reasons for preferring and choosing a limited set of data among the many available in the literature. Basically, this choice depends on how experimental data have been obtained and reported. Eventually, we select a list of 83 independent observations, a number that we think it is reasonably large to test model behaviour.
Issues in the selection of experimental data.In spite of the large number of available
data, their usability is constrained by the following requirements:
. the scaling law (7) holds for individual nutrients as well as for the total nutrient
consumption, andcdepends on the specific nutrient addressed by the model as
well as on the cell line. Therefore we concentrate on glucose, because glucose data are those that are more readily available.
. The variability of tumour shape means thatAis variable as well, and therefore a
simple fit of expression
3lV
3lz(V=A)1=3
cannot determine eitherlorA, but only their productlA. This means that we
must fix the constantc/vcand this is only possible when the cell-specific
[image:3.595.51.287.50.205.2]para-meters are known: in other words, both cell-specific data and whole-tumour growth data must be available, and they must refer to the same cell line;
Figure 3
|
Effective fractal dimension of the set of viable cells vs. tumour characteristic sizex (mm), assumingl5100mm. The set of viable cells becomes surface-like as the tumour grows. Therefore nearly all activity is eventually confined to a thin layer between the bulk of the tumour andthe nourishing medium (whenin vitro), or between bulk and blood
vessels (in vivo).
Figure 4
|
Schematic illustration of a vascularized tumour (not to scale). Live cells (LC) are distributed along the tumour vasculature (TV) itself and on the tumour boundary where it is close to blood vessels in the normal tissue (NT; blood vessels in normal tissue are not shown). The value of A is determined by the interface between the bulk of the tumour and the non-cancerous environment, and this includes the interface with tumour blood vessels. Areas of tumour quiescence/necrosis (N) are also shown. 3.02.8
2.6
2.4
2.2
2.0
0 500 1000 1500 2000
x
(μ
m
)
D
(
x
[image:3.595.316.542.466.660.2]. for the same reasons, we discard data expressed in arbitrary units. This rules out many data like those obtained with uncalibrated imaging techniques, those obtained with radioactive markers without any indication of the specific activity of labelled compounds, and data normalized per gram of tumour tissue without any reference to the total amount of tissue used.
After an extensive search of the scientific literature, we found a limited set of data on glucose uptake in spheroids and solid tumours that fulfil these requirements. In the following we discuss the processing of these data to obtain the final dataset of 83 independent data points used to test the scaling model. We express all data in the
following units:mm3for volumes;mmol/min for the rate of glucose uptake.
While it is common to find published values of the rate of glucose uptake with its corresponding standard deviation in cell cultures, it is unusual to find more than one
measurement ofmin solid tumors, and often there is no estimate of its standard
deviation. Thus, instead of using the straightforward error propagation formula
s^m<
m g
ffiffiffiffiffiffiffiffiffiffiffiffiffiffiffiffiffiffiffiffiffiffiffiffiffiffiffiffiffiffiffiffiffi sm
m 2
z sg
g 2 s
ð11Þ
in most datasets we are limited to its more restricted version
s^m<
m
g2sg ð12Þ
where we make the minimal assumptionsm~0. We also assume that the cell volume
distribution is symmetric, and we take the median ofvcequivalent to the average.
9L cells and spheroids – data from ref. 5.9L cells are from an established rat
glioblastoma cell line. These cells form three-dimensional spheroids when grown under selective culture conditions and the data for both cultured cells and spheroids
are available5; in particular we take the data from Figs. 1 and 4 in ref. 5, respectively.
The maximum reported glucose consumption by 9L cells in culture isc51.336
0.042 pg cell21min21and the median cell volumev
c51200mm3, thusg5(6.156
0.194)
?
10212mmol min21mm23.The glucose concentration in spheroid culture media was measured by enzymatic methods, and the consumption rate was estimated by measuring glucose depletion at given time intervals. Care was taken to correct the glucose uptake due to single cells present in culture, and then data were normalized per spheroid, and these curated data are listed in Table 1.
Rat1-T1 and MR1 cells and spheroids – data from refs. 6–7.Rat1-T1 cells derive
from T24Ha-ras-transfected rat embryo Rat1 fibroblasts, and MR1 cells from myc/ T24Ha-ras-co-transfected rat embryo MR1 fibroblasts. Both engineered embryo fibroblasts acquire a tumorigenic phenotype and the cells can form spheroids under appropriate culture conditions. Glucose consumption rates for these cell cultures
have been measured and the data, already normalized per cell volume (i.e.gin our
notation), have been reported, see Table 2 in ref. 6. The reason for data normalization stems from the careful experimental observation that the two cell types change their volumes as the consequence of the transfection with different oncogenes, and thus the normalization is required for proper quantitative comparison. The rates of glucose
consumptions for exponentially growing Rat1-T1 and MR1 cells areg5(3.486
1.38)
?
10212mmol min21mm23for Rat1-T1 cells andg5(8.9460.3)?
10212mmolmin21mm23for MR1 cells.
Mean glucose turnover in Rat1-T1 and MR1 spheroids was measured photome-trically by quantifying the decrease in metabolite concentration per time interval in
culture media. Values ofmandsmcan be obtained from Fig. 4 in ref. 7, where they are
plotted as functions of spheroid diameter (inmm) and are expressed in units of (moles
of glucose uptake) s-1cell21
?
10217, i.e., on a single-cell basis. Moreover in the samepaper the authors also report careful measurements of the number of live cells per spheroid, and therefore the glucose rates per spheroid can be calculated as well – indeed, ref. 7 is a beautiful example of accuracy in data presentation. We take the data
from Fig. 2 in ref. 7, and we fit them with the functionf(x)~a1xa2, wherexis the
spheroid diameter. The results are shown in Fig. 5 and Fig. 6. We use the estimated
values ofa1anda2to calculate the number of live cells in spheroids of given diameter
and the overall glucose uptake rate per spheroid. Finally, we assume a roughly spherical spheroid shape to compute spheroid volume; the curated data are listed in Tables 2 and 3.
Human tumour cells and human primary and metastatic solid tumours – data
from refs. 8–12.Glucose uptake rates in human solid tumours grownin vivowere
measured by Kallinowski and collaborators8. In Fig. 1 of their paper, these authors
[image:4.595.44.290.94.326.2]report measurements carried out with a number of human primary and metastatic tumours xenografted into athymic, T-cell deficient rats. Glucose concentrations were
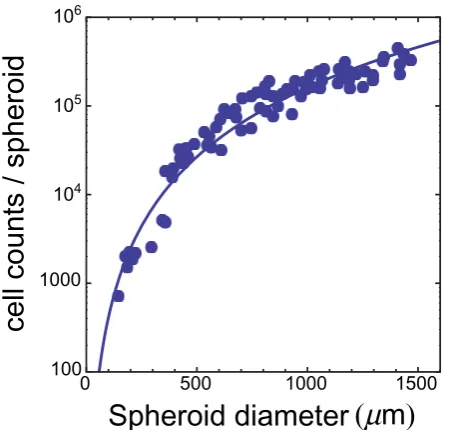
Figure 5
|
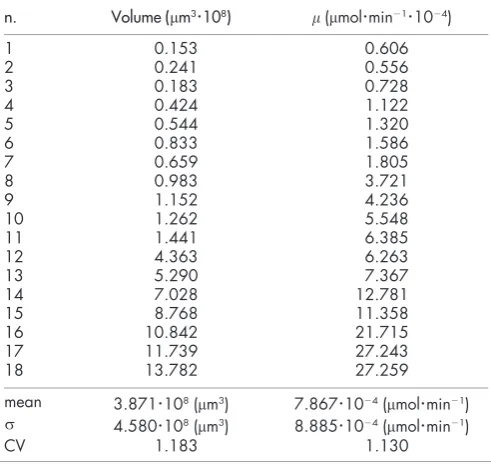
Number of live Rat1-T1 cells per spheroid as the function of spheroid diameter.Symbols refer to experimental data from Fig. 2 in ref. 7. The line is the best fit with a power-law function (see text). The fit returns the following estimates for parameters:a1~0:0074anda2~2:485.Table 1 | Curated 9L spheroid data. The final line in the table
reports the corresponding mean values, standard deviation and
coefficient of variation of cell volume and glucose consumption rate
n. Volume (mm3
?
108) m(mmol?
min21?
1024)1 0.153 0.606
2 0.241 0.556
3 0.183 0.728
4 0.424 1.122
5 0.544 1.320
6 0.833 1.586
7 0.659 1.805
8 0.983 3.721
9 1.152 4.236
10 1.262 5.548
11 1.441 6.385
12 4.363 6.263
13 5.290 7.367
14 7.028 12.781
15 8.768 11.358
16 10.842 21.715
17 11.739 27.243
18 13.782 27.259
mean 3.871
?
108(mm3) 7.867?
1024(mmol?
min21)s 4.580
?
108(mm3) 8.885?
1024(mmol?
min21)CV 1.183 1.130
Table 2 | Curated Rat1-T1 spheroid data. The final line in the table
reports the corresponding mean values, standard deviation and
coefficient of variation of cell volume and glucose consumption rate
n. Volume (mm3
?
108) m(mmol?
min21?
1024)1 0.020 0.082
2 0.051 0.162
3 0.054 0.202
4 0.179 0.478
5 0.337 0.927
6 1.015 2.703
7 2.175 4.518
8 5.235 9.338
9 14.715 24.956
mean 2.642
?
108(mm3) 4.818?
1024(mmol?
min21)s 4.835
?
108(mm3) 8.140?
1024(mmol?
min21)CV 1.830 1.690
10
610
510
41000
cell counts / spheroid
Spheroid diameter
100
0
500
1000
1500
[image:4.595.312.540.482.698.2] [image:4.595.44.292.601.749.2]measured enzymatically in the blood flow of perfused tumour tissues by inserting cannulas into both the supply artery and the drain vein, and the kinetic decline of the metabolite concentrations in the blood before and after the tumour tissues was carefully used to compute the rates of glucose uptake by tumours.
Data are given in units ofmmol of glucose per gram of wet tumour tissue per
minutes and are plotted as the function of the tumour wet weight (in grams). Since the
mass density of tumours is approximately 1 pgmm23, we infer both glucose uptake
rates and tumour volumes from these data. The curated data are listed in Table 4. The human tumours studied in ref. 8 included breast, uterine and ovarian carci-nomas, melacarci-nomas, thyroid carcinomas and lung carcinomas. Unfortunately, they did not investigate glucose uptake in isolated cells nor did they measure cell volumes. We have therefore mined the scientific literature for data obtained with established
human carcinomas cell linesin vitro. As we shall see below, the measurements do not
vary much between different cell lines and this allows us to estimate an averagegvalue
for human cells.
In Table 3 of their paper9, Mazurek et al. report the glucose consumption rates of
two human breast carcinoma cell lines, MCF7 and MDA-MB-443; the values are:
cMCF75(43.860.5) nmol (105cells)21hour21cMDA5(10.660.9) nmol (105cells)21
hour21. The measured volumes of MCF7 (4000 fL54000mm23) and MDA
(approximately 7000mm23) cells can be found in refs. 10 and 11, respectively. Thus,
we calculategMCF75(1.8360.01)
?
10212mmol min21mm23andgMDA5(2.560.21)
?
10213mmol min21mm23.On the other hand, Aykin-Burns et al. studied glucose consumption with human
colon carcinoma cells and normal non-immortalized colon cells12. They find the
following values for the three tumour cell lines HT29, SW480 and HCT116:cHT295
(9.061.0)mmol (106cells)21day21,c
SW4805(17.063.0)mmol (106cells)21day21
andcHCT1165(21.063.0)mmol (106cells)21day21.
To the best of our knowledge, measurements of cell volume for all these cell lines are not available. However, using sensitive fluorimetric methods, Tan et al. measured and reported volume values for a number of human carcinoma cell
lines, among which SW480 cells and other colon carcinoma cells14. In all cases cell
volumes are close to 2 pL (i.e. 2000mm23), and taking this value we find
gHT295(3.1260.35)
?
10212mmol min21mm23,gSW4805(5.961.05)?
10212mmol min21mm23andgHCT1165(7.361.05)
?
10212mmol min21mm23.Finally, taking into account all the above values we find the average value
[image:5.595.56.281.51.266.2] [image:5.595.304.553.95.409.2]g5(3.6861.3)
?
10212mmol min21mm23.Table 3 | Curated MR1 spheroid data. The final line in the table
reports the corresponding mean values, standard deviation and
coefficient of variation of cell volume and glucose consumption rate
n. Volume (mm3
?
108) m(mmol?
min21?
1024)1 0.035 0.260
2 0.086 0.553
3 0.291 1.218
4 0.869 2.821
5 1.814 5.089
6 5.521 10.841
7 12.989 20.981
8 23.908 34.816
9 30.613 39.933
mean 8.458
?
108(mm3) 1.294?
1023(mmol?
min21)s 1.155
?
109(mm3) 1.538?
1023(mmol?
min21)CV 1.366 1.188
Table 4 | Curated human tumour data. The final lines in the table
report the corresponding mean values, standard deviation and
coefficient of variation of cell volume and glucose consumption rate
n.
Volume (mm3
?
1012)m
(mmol
?
min21) n.Volume (mm3
?
1012)m (mmol
?
min21)1 0.329 0.707 25 1.354 1.315
2 0.349 0.360 26 1.480 1.122
3 0.430 1.744 27 1.525 1.937
4 0.507 1.167 28 1.525 2.997
5 0.522 1.111 29 1.334 4.137
6 0.579 1.116 30 1.796 2.374
7 0.597 1.011 31 2.023 2.545
8 0.597 0.972 32 2.147 2.755
9 0.579 0.789 33 2.212 2.087
10 0.624 0.911 34 2.766 3.088
11 0.662 0.967 35 2.935 4.414
12 0.672 1.549 36 3.307 3.278
13 0.703 1.652 37 4.013 6.865
14 0.693 0.898 38 4.196 6.064
15 0.693 0.837 39 3.954 4.639
16 0.769 1.167 40 4.013 3.675
17 0.906 1.335 41 4.588 4.415
18 0.990 1.389 42 5.246 3.979
19 1.051 1.596 43 6.462 5.917
20 1.067 1.937 44 7.388 5.716
21 1.149 2.259 45 9.237 8.210
22 1.202 2.160 46 11.377 11.504
23 1.099 1.424 47 14.654 9.673
24 0.933 0.715
Volume Glucose consumption
mean 2.494
?
1012(mm3) mean 2.819 (mmol?
min21)s 3.008
?
1012(mm3) s 2.470 (mmol?
min21)CV 1.206 CV 0.876
Table 5 | Fits of experimental data with Eq. (7): estimated
para-meter values and goodness-of-fit statistics. Columns 1–3 are
self-explanatory, column 4 is the chi-square per degree-of-freedom in
the fit. While the values of
l
are restricted to a rather narrow range,
which is in line with the expectation of biological variability
between different cell lines, the values of
A
cover a very wide
range. This large variability is justified by the different geometries
of the tumours in the list: while spheroids have shapes that never
depart too much from the sphere – even when they have very
irregular edges – real, vascularized tumours have complex
geo-metries and the total area in contact with blood vessels is very
large, hence the large average
A
value reported for human
tumours
Dataset l(mm) A x2/DF 9L spheroids 93.9360.08 2.7560.87 1.11 Rat-T1 spheroids 123.5661.14 20.7462.27 1.54 MR1 spheroids 90.9560.001 0.7660.04 1.20 Human tumors 99.4065.46 9648.260.02 1.02 Figure 6
|
Number of live MR1 cells per spheroid as the function ofspheroid diameter.Symbols refer to experimental data from Fig. 2 in ref. 7. The line is the best fit with a power-law function (see text). The fit returns the following estimates for parameters:a1~0:00268anda2~2:592.
10
610
510
41000
cell counts / spheroid
Spheroid diameter
100
0
500
1000
1500
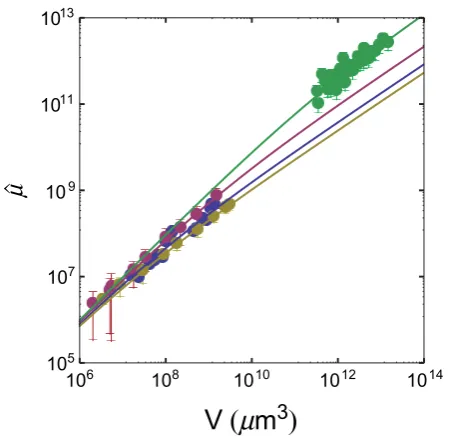
[image:5.595.44.291.601.750.2]Estimates oflandA.We fit each selected experimental dataset with Eq. (7). The
results are shown in Fig. 7. The corresponding values of parameterslandA, as well as
the goodness-of-fit statistics, are given in Table 5.
Data fitting.The data analysis is rather simple in this case, where data are
comparatively few and the model is very smooth. To this end we used the
NonlinearModelFit instruction which is built inMathematicavs. 9.0 (Wolfram
Research, Inc.).
1. Milotti, E., Vyshemirsky, V., Sega, M. & Chignola, R. Interplay between
distribution of live cells and growth dynamics of solid tumours,Sci. Rep.2, 990,
doi:10.1038/srep00990 (2012).
2. Milotti, E. & Chignola, R. Emergent properties of tumor microenvironment in a
real-life model of multicell tumor spheroids.PLoS ONE5, e13942, doi:10.1371/
journal.pone.0013942 (2010).
3. Helmlinger, G., Yuan, F., Dellan, M. & Jain, R. K. Interstitial pH and pO2 gradients in solid tumors in vivo: high resolution measurements reveal al lack of correlation.
Nat. Med.3, 177–182 (1997).
4. Tannock, I. F. The relation between cell proliferation and the vascular system in a
transplanted mouse mammary tumour.Br. J. Cancer22, 258–273 (1968).
5. Li, C. K. N. The glucose distribution in 9L rat brain multicell tumour spheroids
and its effect on cell necrosis.Cancer50, 2066–2073 (1982).
6. Kunz-Schughart, L. A., Simm, A. & Mu¨ller-Klieser, W. Oncogene- associated transformation of rodent fibroblasts is accompanied by large morphologic and
metabolic alterations.Oncol. Rep.2, 651–661 (1995).
7. Kunz-Schughart, L. A., Doetsch, J., Mu¨ller-Klieser, W. & Groebe, K. Proliferative activity and tumorigenic conversion: impact on cellular metabolism in 3-D
culture.Am. J. Physiol. Cell Physiol.278, C765–C780 (2000).
8. Kallinowski, F.et al. Blood flow, metabolism, cellular microenvironment, and
growth rate of human tumor xenografts.Cancer Res.49, 3759–3764 (1989).
9. Mazurek, S., Michel, A. & Eigenbrodt, E. Effect of extracellular AMP on cell proliferation and metabolism of breast cancer cell lines with high and low
glycolytic rates.J. Biol. Chem.272, 4941–4925 (1997).
10. Guppy, M., Leedman, P., Zu, X. L. & Russel, V. Contribution of different fuels and metabolic pathways to the total ATP turnover of proliferating MCF-7 breast
cancer cells.Biochem. J.364, 309–315 (2002).
11. Stoletov, K., Montel, V., Lester, R. D., Gonias, S. L. & Klemke, R. High resolution imaging of the dynamic tumor cell-vascular interface in transparent zebrafish.
Proc. Natl. Acad. Sci. U.S.A.104, 17406–17411 (2007).
12. Aykin-Burns, N., Ahmad, I. M., Zhu, Y., Oberley, L. W. & Spitz, G. R. Increased
levels of superoxide and H2O2mediate the differential susceptibility of cancer cells
versus normal cells to glucose deprivation.Biochem. J.418, 29–37 (2009).
13. West, G. B., Brown, J. H. & Enquist, B. J. A General Model for the Origin of
Allometric Scaling Laws in Biology.Science276, 122–126 (1997).
14. Tan, C. W.et al. Wnt signalling pathway parameters for mammalian cells.PLoS
ONE7, e31882, doi:10.1371/journal.pone.0031882 (2012).
Acknowledgements
The authors wish to acknowledge support from MIUR-PRIN2009, and from the HPC CASPUR Standard Grant 2011.
Author contributions
E.M. conceived the model, analysed data and wrote the manuscript. V.V. analysed data. M.S. and R.C. searched the literature, contributed to model building and wrote the manuscript. S.S. contributed to the discussion on the role of metabolic scaling and of fractal behaviour and to a critical revision of all the text.
Additional information
Competing financial interests:The authors declare no competing financial interests.
License:This work is licensed under a Creative Commons
Attribution-NonCommercial-NoDerivs 3.0 Unported License. To view a copy of this license, visit http://creativecommons.org/licenses/by-nc-nd/3.0/
How to cite this article:Milotti, E., Vyshemirsky, V., Sega, M., Stella, S. & Chignola, R.
[image:6.595.55.280.52.271.2]Metabolic scaling in solid tumours.Sci. Rep.3, 1938; DOI:10.1038/srep01938 (2013). Figure 7
|
Nonlinear fits of the four data-sets with Eq. (7): symbols,experimental data; lines, nonlinear fit. The colours of both symbols and lines refer to different experimental data-sets and are as follows: blue, 9L spheroids; red, Rat1-T1 spheroids; yellow, MR1 spheroids; green, human tumours.