Vaccine Effectiveness Estimates Dependent on Outcome
and Methodological Approach
Kimberley Kavanagh1*, Chris Robertson1,2,3, Jim McMenamin2
1Department of Mathematics and Statistics, University of Strathclyde, Glasgow, United Kingdom,2Health Protection Scotland, Glasgow, United Kingdom,3International Prevention Research Institute, Lyon, France
Abstract
Background:Estimation of Influenza vaccine effectiveness (VE) varies with study design, clinical outcome considered and statistical methodology used. By estimating VE using differing outcomes and statistical methods on the same cohort of individuals the variability in the estimates produced can be better understood. The Pandemic Influenza Primary Care Reporting (PIPeR) cohort of approximately 193,000 individuals was used to estimate pandemic VE in Scotland during season 2009–10. VE results for three outcomes; influenza related consultations, virological confirmed influenza and death were considered. Use of individualised records allowed all models to be adjusted for age, sex, deprivation, risk status relating to chronic illnesses, seasonal vaccination status and a marker of the individual’s propensity to consult. For the consultation and death outcomes, VE was calculated by comparing consultation rates in the unvaccinated and vaccinated groups, adjusted for the listed factors, using both Cox and Poisson regression models. For the consultation outcome, the unvaccinated group was split into individuals before vaccination and those never vaccinated to allow for potential differences in the health seeking behaviour of these groups. For the virology outcome estimates were calculated using a generalised additive logistic regression model. All models were adjusted for time. Vaccine effect was demonstrated for the influenza-like illness consultation outcome using the Cox model (VE = 49% 95% CI (19%, 67%)) with lower estimates from the model splitting the before and never vaccinated groups (VE = 34.2% with 95% CI (20.5%, 58.9%)). Vaccine effect was also illustrated for overall mortality (VE = 40% (95% CI 18%, 56%)) and a virological confirmed subset of symptomatic individuals (VE = 60% (95% CI
238%, 89%)).
Conclusions:This study illustrates positive point estimates of Influenza VE across methodology and outcome for a single cohort of individuals during season 2009–10. Understanding of potential differences between approaches aids interpretation of VE results in future seasons.
Citation:Kavanagh K, Robertson C, McMenamin J (2011) Assessment of the Variability in Influenza A(H1N1) Vaccine Effectiveness Estimates Dependent on Outcome and Methodological Approach. PLoS ONE 6(12): e28743. doi:10.1371/journal.pone.0028743
Editor:Martin Beer, Friedrich-Loeffler-Institut, Germany
ReceivedJuly 19, 2011;AcceptedNovember 14, 2011;PublishedDecember 21, 2011
Copyright:ß2011 Kavanagh et al. This is an open-access article distributed under the terms of the Creative Commons Attribution License, which permits unrestricted use, distribution, and reproduction in any medium, provided the original author and source are credited.
Funding:This work was funded by ECDC through Epiconcept (Paris) with additional support provided by Scottish Government Department of Health and Wellbeing. The funders had no role in study design, data collection and analysis, decision to publish, or preparation of the manuscript.
Competing Interests:The authors have declared that no competing interests exist.
* E-mail: kim.kavanagh@strath.ac.uk
Introduction
Influenza vaccine effectiveness (VE) requires yearly assessment due to the evolution of the virus and subsequent reformulation of the vaccination. Such changes influence the estimates of VE between seasons. Within a season, differences in estimates for the same vaccination may vary between studies due to methodological differences in the study design, the statistical method employed and the outcome measure used. Generally VE studies fall into one of three designs; case-control (including test negative), cohort or screening. The design of the study dictates the method of analysis used. In the current European context, only observational studies could be used to provide real time influenza VE estimates [1]. In the case of observational cohort studies, the methodology used may be logistic regression, Poisson regression or Cox proportional hazards. For the same outcome these may produce differing estimates.
Estimates may also differ dependent on the clinical outcomes used to measure influenza VE. Typical outcomes are influenza-related GP consultation rates, laboratory confirmed diagnosis, hospitalisation rates and death rates (all or influenza-specific causes). Valenciano et al. [2] highlight that the various clinical outcomes used have differing sensitivity and specificity, with low specificity in particular, leading to underestimation of influenza VE estimation.
estimates of 71.9% (95% CI 45.6–85.5) [2]. Both of these studies had issues with missing data, particularly the UK study where vaccine status was unknown for many patients; imputation was used in the multicentre study primarily for missing co morbidity information. A Canadian study reported that the vaccine effect was 93% (95% CI 69% to 98%) [4]. In a test negative case control study of hospitalisations for influenza in Castellon, Spain a vaccine effect of 90% (95% CI, 48–100%) was reported [5]. Estimates of VE of 96.8%; (95% CI 95.2–97.9%) in persons aged 14–59 years and 83.3% (95% CI:71.0–90.5%) in those 60 years or older were provided using the screening method on virological samples in Germany [6].
Estimates of seasonal influenza VE in Scotland, using influenza-related consultations within a cohort of patients registered at a number of general practices have been estimated at Health Protection Scotland (HPS) since 2008. For season 2009–2010, we present estimates of pandemic influenza VE calculated using differing statistical methodologies. In addition we present the effect of varying the outcome measure used, firstly in terms of the consultation definition and then considering laboratory confirmed diagnosis and death as end-points. In this way, we aim to understand the variation in VE estimates for the same cohort and identify robust methods for estimating pandemic influenza VE from routinely collected consultation data. Such data has the facility to provide timely estimates throughout the flu season.
Methods
Study design
The Pandemic Influenza Primary care Reporting (PIPeR) cohort is based upon 37 practices which were drawn from a sentinel surveillance network of GP practices contributing to the Practice Team Information (PTI) network [7]. In season 2009– 2010, PIPeR covered approximately 206,000 patients, around 4% of the Scottish population. Thirty-two of these practices, covering approximately 193,000 patients, gave permission for the extract of pandemic vaccination data alongside the routinely collected data. Seasonal vaccination data are routinely collected but as the pandemic vaccination was new, separate consent for the data extraction had to be undertaken.
The PIPeR cohort contains anonymous individualised records for participants who have at least one year of recorded database history prior to the start of the study, detailing the age, sex, deprivation index, based upon postcode sector and linked to the Carstair’s measure [8], and at-risk status for influenza. Daily automated updates provide information on vaccination status (seasonal influenza and pneumococcal polysaccharide vaccination) and consultations corresponding to acute respiratory infections (ARI) and influenza-like illness (ILI). Date of death was recorded and those who died prior to the start date of the study were removed from consideration.
Individuals ‘at risk’ of complications following influenza infection were recorded. The conditions covered were: diabetes, coronary heart disease, chronic liver disease, chronic respiratory disease, chronic liver disease, neurological disorders and immu-nosuppression. Risk group status was poorly recorded for those over 65 years of age, as they are routinely targeted for vaccination. Risk group status was assigned at the beginning of the cohort and individuals were assumed to remain in that status throughout the period of analysis. The Community Health Index (CHI) is also available at HPS in password protected databases and this is a unique number which can be used to link to other health systems.
Outcomes
The endpoints considered were consultation rates, laboratory confirmed infection and death.
Three classifications of consultation were considered: influenza-like illness consultations denoted ILI, acute respiratory infection consultations including influenza-like illness denoted ARI, and a combined total number of both consultations, excluding those which are Asthma-related, denoted ILIARI. For each endpoint, the consultation was excluded from the analysis if it occurred within 7 days of the pandemic influenza vaccination to allow for the time required for a protective effect to be established. For seasonal influenza vaccination the conventional exclusion period is 14 days, however studies at the Health Protection Agency and the sensitivity analysis in Hardelidet al.[3] suggest 7 days is sufficient for the Influenza A (H1N1v) vaccination.
Among patients who attended the PIPeR practices, a subset of those with clinical symptoms which resembled those associated with influenza like illness, were swabbed as part of the Scottish Sentinel swabbing scheme.
The date of death was extracted from the practice database but there is no information on cause of death. The analysis is based upon dates of death extracted from the practice records up to 30th June 2010. In a sensitivity analysis to investigate delays in recording date of death, the extract was carried on to the end of October 2010 and an additional 2 deaths within the study period were noted.
Vaccination status and study period
Influenza vaccination was coded as a dichotomous time-dependent variable with recording of both the seasonal and pandemic vaccination in season 2009/2010. The study period is from October 1st 2009, (26thOctober, 2009 was the date of the first pandemic Influenza A (H1N1v) vaccinations in the UK) and ended on 31stMarch 2010. Seasonal vaccinations from September 1st, 2009 were recorded.
Statistical analysis. The analysis differed depending upon the outcome and statistical method used. For consultation outcomes there were potentially multiple events per patient whereas for death and virological status each patient had only one possible event.
There are two time dependent covariates – Seasonal vaccine status and pandemic influenza A (H1N1v) vaccine status and changes to either result in a split of the patients follow up record. Such time dependency makes Cox proportional hazards [9] an appropriate method to use.
The effect of the following covariates which may influence vaccine effectiveness were considered for all outcomes: age group, gender, risk group status (in at least one clinical risk group, yes/ no), number of ILIARI consultations in the previous influenza season (0, 1, 2+), seasonal influenza vaccination status in the previous season, seasonal influenza vaccination status in the current season and deprivation represented using quintiles based on the Carstair’s index [8]. Estimates of adjusted vaccine effectiveness, using Cox regression were calculated as VE = (1-RR)*100 where the relative risk (RR) is the exponent of the hazard ratio of vaccine status (vaccinated/not vaccinated).
Consultation outcome
model, using robust standard errors, to account for clustering of individuals within practices, is also considered.
The Cox model can be recast as a Poisson linear-regression model [10] by aggregating the person time at risk. Time was stratified in weeks and the number of consultation events in each covariate pattern and vaccine status per week was calculated along with the time at risk in that week. In the Poisson model, adjusted vaccine effectiveness is calculated as VE = (1-RR)*100 where RR is the ratio of the consultation rate among those unvaccinated compared to those vaccinated.
The Cox and Poisson models make no distinction between the consultation rates in those never vaccinated relative to the rates in those who are ultimately vaccinated but are prior to vaccination. In an extension of the Poisson model, a patient’s exposure to vaccine at any time was recoded as never vaccinated, before vaccination and after vaccination. A comparison of the consulta-tion rates before and after vaccinaconsulta-tion eliminates some of the effects of confounding variables and the propensity to consult, and provided the temporal trend is modelled appropriately will give an estimate of vaccine effect. In the extended Poisson model, adjusted vaccine effectiveness was calculated as VE = (1-RR)*100 where RR is the ratio of the consultation rate after vaccination compared to the consultation rate before vaccination.
Both models using the Poisson regression framework were adjusted for time by using a factor to differentiate weeks since the start date and so accounting for changes in the background rate of disease in the community.
Finally, the screening method [11] was used to illustrate estimates of VE in a situation where only aggregate data was available. To do so the data was aggregated for each GP practice to give summaries of; the number of consultations in vaccinated individuals, the total number of consultations and the vaccination coverage in that practice. VE is calculated using a generalised linear mixed model where the log odds of a consultation in the vaccinated group is the response, the log odds of the vaccine coverage is the offset and the GP practice is the random effect.
Death outcome
The death rates among those vaccinated and unvaccinated were compared through a time dependent cox model and a Poisson regression model based upon calculation of the person time at risk for each week throughout the observation period. Adjustment was made for the confounding factors.
Virology outcome
HPS has data on the results of all virological swab tests for H1N1v influenza during the pandemic season 2009–10. The sample are from all hospital laboratories in Scotland, collected through the Electronic Communication of Surveillance in Scot-land (ECOSS) system [12], and the West of ScotScot-land Regional Virus Lab which tests the majority of samples from general practice, including those in the sentinel surveillance scheme. All patients who were tested had acute respiratory symptoms and were tested for clinical reasons. There were 13623 individuals with at least one virological test. Many individuals had multiple tests. The first positive test was selected for those with a positive result and the first test was selected for those with all negative results. Virological data were linked to the cohort on the basis of the community health index number (CHI Number). Laboratory samples without a valid CHI Number were excluded as they could not be linked211.6% of records
A nested case control analysis was used to estimate vaccine effectiveness by fitting a generalised additive logistic regression model with those who tested negative serving as the controls [13].
As the vaccination was administered to individuals at differing times through the swabbing interval the comparison of the rates of swab positivity among those vaccinated or unvaccinated at the time of swabbing was adjusted for the temporal trends in swab positivity which was modelled by a quadratic trend based upon week of sample collection.
All statistical analysis was conducted using R version 2.12.2.
Results
Demographics, vaccine uptake and consultations
The pandemic influenza cohort is composed of 193,034 eligible individuals, 49.8% male, with mean age 40.3 years. Most individuals are in the 15–44 year old age group (41.1%), with 16.0% over 65 and 4.7% under 5 years old (Table 1). Of those under 65, 14.8% are in at least one clinical risk group. The most commonly recorded risk group in those under 65 is chronic respiratory disease (5.4%) followed by chronic heart disease (3.7%) and diabetes (3.2%).
Pandemic and seasonal vaccination uptake by age is summa-rised in Table 2. For those under 45 in a clinical risk group, H1N1v vaccine uptake is higher than seasonal uptake in the youngest age groups, 0–4 years and 5–14 years. H1N1v uptake is highest in those aged 0–4 years (58.5%) followed by those aged 5– 14 years (56.5%). As age increases the differential between seasonal and pandemic vaccination becomes less with similar uptake in the 15–44 year old age group. In the 45–64 year old age group, uptake for the seasonal vaccination exceeds the pandemic uptake. Uptake for those in a clinical risk group is lowest in those aged 15–44 years (39.7%). Overall, H1N1 vaccine uptake is lowest in those aged over 65 (34.8%).
Figure 1 shows the pandemic and seasonal vaccine uptake over time for ‘‘at risk’’ individuals. Figure 1A illustrates the commence-ment of the pandemic influenza vaccination in late October 2009 with the majority of the vaccinations administered through November and December 2009. This is in contrast to the seasonal influenza vaccine uptake where the uptake in the elderly had been largely completed by the end of October (Figure 1B). In contrast, a substantial proportion of those in clinical at risk groups only received their seasonal influenza vaccination in the period after1st November. Figure 2 demonstrates the increased clinical reporting of cases of influenza like illness and other acute respiratory infections reported in the 37 PIPeR GP practices from early July 2009 when routine swabbing of a subset of patients attending with influenza-like illness symptoms began, until the 31 January 2010. Reporting increased in August building to a peak in late October and November before reducing across December and January. The same figure shows that swab positivity for pandemic influenza lags behind the clinical peak by between one to two weeks due to the time delay in testing and reporting. Figure 1A demonstrates that much of the pandemic influenza vaccine administered in the cohort was either at or shortly after the peak in clinical illness presentation.
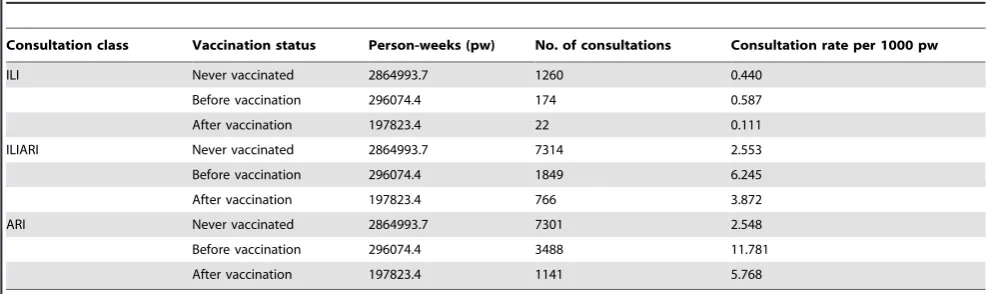
vaccination (Table 4), the consultation rates in those prior to vaccination are slightly higher than those never vaccinated, indicating a possible difference in their consultation behaviour for ILI. Considering the less-specific consultation codes, the difference between the before vaccination and the never
[image:4.612.62.561.77.447.2]vaccinated groups becomes more distinct. Considering ILIARI, when comparing the unvaccinated and vaccinated groups, the consultation rate in the vaccinated group is higher than the unvaccinated group (3.872 per 1000 pw compared to 2.899 per 1000 pw) crudely indicating a negative VE. When looking at the
Table 1.Demographics of the PIPeR cohort pandemic influenza subset.
Number Percentage
Variable Level Cohort
Has at least 1 ILIARI consultation
Has an influenza
virology test Cohort
Has at least 1 ILIARI consultation
Has an influenza virology test
Gender Female 96954 4922 990 50.2 57.2 57.9
Male 96080 3690 721 49.8 42.8 42.1
Age Group ,1 235 64 10 0.1 0.7 0.6
1–4 8779 1807 252 4.5 21.0 14.7
5–9 20803 1282 288 10.8 14.9 16.8
15–44 79223 2396 714 41.0 27.8 41.7
45–64 53016 1768 335 27.5 20.5 19.6
65–74 16980 722 69 8.8 8.4 4.0
75+ 13998 573 43 7.3 6.7 2.5
Risk Group No 168189 6935 1346 87.1 80.5 78.7
Yes 24845 1677 365 12.9 19.5 21.3
Seasonal Flu Vaccine No 159242 6598 1424 82.5 76.6 83.2
Previous Season Yes 33792 2014 287 17.5 23.4 16.8
Number of ILIARI consultations in previous year
0 175690 5962 1300 91.0 69.2 76.0
1 13574 1633 283 7.0 19.0 16.5
2 2628 582 75 1.4 6.8 4.4
3+ 1142 435 53 0.6 5.1 3.1
Carstairs Quintile (Deprivation)
Low - Q1 21802 1017 137 11.3 11.8 8.0
Q2 21391 1002 213 11.1 11.6 12.4
Q3 55571 2343 402 28.8 27.2 23.5
Q4 54687 2439 431 28.3 28.3 25.2
High - Q5 38649 1764 514 20.0 20.5 30.0
Unknown 934 47 14 0.5 0.5 0.8
ILIARI consultation: consultation for Influenza-like illness or acute respiratory infection excluding asthma consultations. doi:10.1371/journal.pone.0028743.t001
Table 2.H1N1 and seasonal vaccine uptake split by clinical risk group and age group.
In Clinical Risk Group Not in Clinical Risk Group
Number
Pandemic vaccination
uptake (%) 95% CI
Seasonal vaccination
uptake (%) 95% CI Number
Pandemic vaccination
uptake (%) 95% CI
Seasonal vaccination
uptake (%) 95% CI
0–4 258 58.5 (52.4, 64.4) 27.1 (22.1, 32.9) 8756 31.7 (30.7, 32.7) 0.5 (0.3,0.6)
5–14 1516 56.5 (54.0,59.0) 37.5 (35.1, 39.9) 19287 5.1 (4.8,5.4) 0.9 (0.8, 1.0)
15–44 7728 39.7 (38.6, 40.8) 38.1 (37.1, 39.2) 71495 3.3 (3.2,3.4) 1.4 (1.3, 1.5)
45–64 14502 51.3 (50.5, 52.1) 54.6 (53.8, 55.4) 38514 3.2 (3.1, 3.4) 3.4 (3.2, 3.5)
All Under 65
24004 48 (47.4,48.6) 47.9 (47.3,48.6) 138052 5.3 (5.2, 5.4) 1.8 (1.7,1.9)
65+* 30978 34.8 (34.3, 35.3) 69.4 (68.9, 69.9) - - - -
[image:4.612.66.554.569.720.2]before/never vaccinated split the consultation rate in those prior to vaccination is 6.245 per 1000 pw compared to 2.553 in the never vaccinated group. This indicates that there may be differences in the consultation behaviour of those individuals who seek vaccination and those who do not. This effect is amplified further when the least specific category, ARI is examined. In this case those prior to vaccination have a
[image:5.612.58.427.61.282.2]consultation rate of 11.781 per 1000 pw compared to 2.548 over 1000 pw in those never vaccinated. Examining the unvaccinated and vaccinated split would again imply a negative VE whilst comparing consultations before and after vaccination gives a positive estimate. Such estimation based solely on consultation rates may give misleading results as no adjustment for covariates and the time of consultation is made.
Figure 1. Vaccination administration within the PIPeR cohort by date of administration for all individuals in a risk group.Figure 1A shows pandemic influenza vaccination and Figure 1B seasonal influenza vaccination. All individuals over 65 are automatically ‘‘at risk’’. Those under 65 are ‘‘at risk’’ if they fall in a clinical risk group.
doi:10.1371/journal.pone.0028743.g001
[image:5.612.62.524.453.704.2]Vaccine effectiveness – consultation outcome
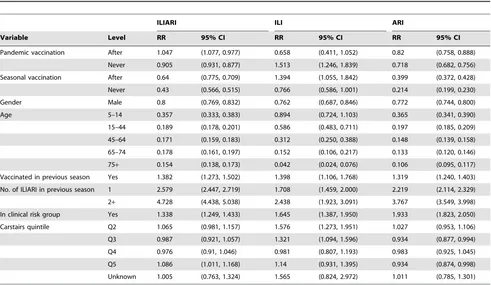
Estimates of the adjusted relative risk of a consultation in each of the three consultation outcome categories ILIARI, ILI and ARI, relative to the baseline group, as estimated by the before/after Poisson regression method and Cox Proportional hazards are summarised in Tables 5 and 6 respectively. Estimates for the Poisson model with vaccinated compared to unvaccinated are not presented as they are very similar to the Cox estimates. The summarised VE estimates for all methods are presented in Table 7. Considering the most vaccine specific outcome ILI, the covariate and time adjusted before/after Poisson model results (Table 7) show positive but non statistically significant VE = 34.2% with 95% CI (20.05, 58.9)% for the pandemic vaccination when comparing vaccinated individuals before and after vaccination. Table 5 shows that receiving seasonal vaccination did not provide any protection with vaccinated individuals shown to be 1.39 times more likely to have an ILI after vaccination. Seasonal vaccination in the previous season had no significant effect. Gender was found to be significant with men 24% less likely to consult for an ILI than women. Young children, aged 0–4 years, have the highest likelihood of consultation and the risk of consultation decreases linearly with age. Individuals with 2 or more ILARI consultations in the previous season were 2.4 times more likely to consult with an ILI. Individuals in a clinical risk group were found to be 1.6 times more likely to consult for an ILI than those not in a clinical risk group. Little effect of deprivation was observed.
Changing the consultation outcome to ARI results in a reduced VE = 18.0% with 95% CI (11.2, 24.2)% and using outcome with asthma codes removed, ILIARI, gives VE =27.7% (218.6, 2.3)% (Table 7). The effect of the risk factors for each of these outcomes is broadly similar to those described for ILI consultations apart from individuals with 2 or more consultations in the previous season, which for ILIARI gives RR = 4.728 with 95% CI (4.438, 5.038) which is nearly double the RR observed for ILI consultations and for deprivation.
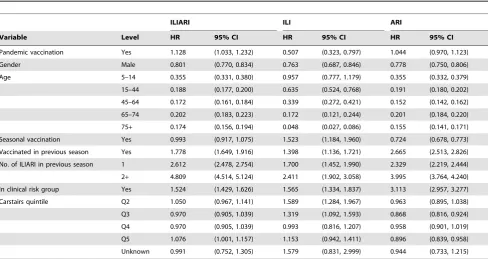
[image:6.612.62.555.78.186.2]Detailed results estimated by Cox Proportional Hazards are shown in Table 6. VE results obtained when using Cox Proportional Hazards with the unvaccinated/vaccinated split and Poisson regression with the same split were broadly similar (Table 7). Examining the Cox Proportional Hazards results in detail, the effect of the individual risk factors across the consultation categories is similar to the effects observed in the before/after Poisson model. There are however some exceptions. For the ILIARI and ARI groupings, both being in a clinical risk group and receiving the pandemic vaccination in the previous season have inflated RRs compared to the before/after Poisson model (Table 5 and 6). Considering ARI in particular, the RR for receiving seasonal influenza vaccination in the previous season increased from 1.319 to 2.655 and for clinical risk group increased from 1.933 to 3.113. The strength of these adjustments is reflected in the substantial differential between the unadjusted and adjusted models when using Cox Proportional Hazards and Poisson
Table 3.Consultation numbers and rates for those vaccinated and unvaccinated.
Consultation class Vaccination status Person-weeks (pw) No. of consultations Consultation rate per 1000 pw
ILI Unvaccinated 3161068.1 1434 0.454
Vaccinated 197823.4 22 0.111
ILIARI Unvaccinated 3161068.1 9163 2.899
Vaccinated 197823.4 766 3.872
ARI Unvaccinated 3161068.1 10789 3.413
Vaccinated 197823.4 1141 5.768
ILI: Influenza-like illness, ILIARI: Influenza-like illness and acute respiratory infections (excluding asthma), ARI: All influenza-like illness and acute respiratory infections (including asthma).
[image:6.612.61.557.549.696.2]doi:10.1371/journal.pone.0028743.t003
Table 4.Consultation numbers and rates for those never vaccinated and those vaccinated before and after vaccination.
Consultation class Vaccination status Person-weeks (pw) No. of consultations Consultation rate per 1000 pw
ILI Never vaccinated 2864993.7 1260 0.440
Before vaccination 296074.4 174 0.587
After vaccination 197823.4 22 0.111
ILIARI Never vaccinated 2864993.7 7314 2.553
Before vaccination 296074.4 1849 6.245
After vaccination 197823.4 766 3.872
ARI Never vaccinated 2864993.7 7301 2.548
Before vaccination 296074.4 3488 11.781
After vaccination 197823.4 1141 5.768
ILI: Influenza-like illness, ILIARI: Influenza-like illness and acute respiratory infections (excluding asthma), ARI: All influenza-like illness and acute respiratory infections (including asthma).
regression with unvaccinated/vaccinated split methods as present-ed in Table 7 for the ILIARI and ARI consultation groupings.
The VE estimates obtained using the screening approach, which mirrors a situation where only aggregate end of season data is available and therefore makes no adjustment for confounders and temporal effects, is summarised in Table 7. The estimates from the screening method for ILI are consistent with the time-adjusted models. For the less specific consultation outcomes of ILIARI and ARI the VE estimates are higher than both the time-adjusted and the time and covariate adjusted models.
Estimates of VE for each consultation class and statistical model used, varying by the cut-off date for analysis, are shown in Figures 3, 4 and 5. The pattern observed between the estimates achieved with differing methods varied with the consultation class analysed. Results for the ILI consultation (Figure 3) class gave comparable results for the Poisson and Cox Proportional hazards models but results around 10 percentage points lower using the Poisson before/after approach. The ILI response, being most specific, was relatively invariant to the time point used as an endpoint. For ILIARI (Figure 4) and ARI (Figure 5) consultation categories there was variation in the estimates found dependent on whether adjustment was performed, particularly for the Poisson and Cox Proportional hazards models. For ARI consultations there is more variability in the VE estimates with the cut-off date used for analysis. The point estimates of VE decrease in February and again in March. As ARI is less specific to influenza, this decrease is related to the levels of influenza circulating in the community and how these levels are relative to other respiratory
pathogens. Figure 2 illustrates that influenza levels peaked in November, when 45% of swabs tested positive and decreased to less than 5% positive by the end of January. Post January, only 3 further cases were virologically confirmed with the last being found on 14thMarch. This indicated the lack of influenza circulating in February and March and a higher proportion of ARI consulta-tions in this time may be attributable to other respiratory pathogens to which the vaccination would offer no protection.
The effect of accounting for the clustering of individuals within practices, using robust standard errors with the Cox approach (Table 7), widens the variability surrounding the estimates of VE but any significant overall vaccine effect found under the original Cox approach remains.
Vaccine effectiveness – virology outcome
[image:7.612.64.555.77.362.2]Of those individuals in the cohort, a total of 1711, were swabbed, corresponding to 8.9% of the cohort. This is a high proportion of the swab test results (12.6% of 13623 tests) as the GP practices in PIPeR are all in the GP sentinel surveillance scheme. The associations between consultations for ILIARI during the season and having a virological test are shown in Table 1. These show that 50% of the cohort is female, 57% of those who consulted for an ILIARI are female and the 58% of those (with symptoms) tested are female. Thus there is no selection bias for a virological test based upon gender. The major bias is associated with Age where there is over representation, compared to consultations, among those swabbed in the 15–44 age group and under representation among children aged under 5 and adults
Table 5.Relative risk of consultation estimated by the Poisson model with before/after split for the three consultation groupings.
ILIARI ILI ARI
Variable Level RR 95% CI RR 95% CI RR 95% CI
Pandemic vaccination After 1.047 (1.077, 0.977) 0.658 (0.411, 1.052) 0.82 (0.758, 0.888)
Never 0.905 (0.931, 0.877) 1.513 (1.246, 1.839) 0.718 (0.682, 0.756)
Seasonal vaccination After 0.64 (0.775, 0.709) 1.394 (1.055, 1.842) 0.399 (0.372, 0.428)
Never 0.43 (0.566, 0.515) 0.766 (0.586, 1.001) 0.214 (0.199, 0.230)
Gender Male 0.8 (0.769, 0.832) 0.762 (0.687, 0.846) 0.772 (0.744, 0.800)
Age 5–14 0.357 (0.333, 0.383) 0.894 (0.724, 1.103) 0.365 (0.341, 0.390)
15–44 0.189 (0.178, 0.201) 0.586 (0.483, 0.711) 0.197 (0.185, 0.209)
45–64 0.171 (0.159, 0.183) 0.312 (0.250, 0.388) 0.148 (0.139, 0.158)
65–74 0.178 (0.161, 0.197) 0.152 (0.106, 0.217) 0.133 (0.120, 0.146)
75+ 0.154 (0.138, 0.173) 0.042 (0.024, 0.076) 0.106 (0.095, 0.117)
Vaccinated in previous season Yes 1.382 (1.273, 1.502) 1.398 (1.106, 1.768) 1.319 (1.240, 1.403)
No. of ILIARI in previous season 1 2.579 (2.447, 2.719) 1.708 (1.459, 2.000) 2.219 (2.114, 2.329)
2+ 4.728 (4.438, 5.038) 2.438 (1.923, 3.091) 3.767 (3.549, 3.998)
In clinical risk group Yes 1.338 (1.249, 1.433) 1.645 (1.387, 1.950) 1.933 (1.823, 2.050)
Carstairs quintile Q2 1.065 (0.981, 1.157) 1.576 (1.273, 1.951) 1.027 (0.953, 1.106)
Q3 0.987 (0.921, 1.057) 1.321 (1.094, 1.596) 0.934 (0.877, 0.994)
Q4 0.976 (0.91, 1.046) 0.981 (0.807, 1.193) 0.983 (0.925, 1.045)
Q5 1.086 (1.011, 1.168) 1.14 (0.931, 1.395) 0.934 (0.874, 0.998)
Unknown 1.005 (0.763, 1.324) 1.565 (0.824, 2.972) 1.011 (0.785, 1.301)
Results are relative to the baseline group which is females aged 0–4 in no clinical risk group and in Carstair’s deprivation quintile 1 who did not receive a seasonal influenza vaccination in the previous season, had no ILIARI consultations in the previous season, prior to receiving the seasonal influenza vaccination in season 2009/10 and prior to receiving the H1N1 vaccination in season 2009/10 in week 1 (1st–7thOctober). RRs for the specific weeks are not presented. Analysis is based upon consultations up to 31st January 2010.ILI: Influenza-like illness, ILIARI: Influenza-like illness and acute respiratory infections (excluding asthma), ARI: All influenza-like illness and acute respiratory infections (including asthma).
aged 65 and over. There is also a bias associated with deprivation in that patients in a more deprived neighbourhood are more likely to be swabbed, but no bias associated with risk group membership, seasonal vaccination in the previous year and number of consultation for ILIARI in the previous year.
A total of 508 tested positive for H1N1v influenza, yielding positivity rate of 29.7%. The majority of these patients were unvaccinated at the time of swabbing (1657); and only 54 were swabbed post vaccination. Among those not vaccinated, swab positivity is higher among those in a risk group (403 positive, 920
negative) compared to those not in a risk group (102 positive, 232 negative),p= 0.002. Very few vaccinated patients were tested254 patients and only 3 were positive for H1N1v. Trends in swab positivity are presented in Figure 1 where it is seen that positivity peaked in October 2009 and decreased over time among those unvaccinated.
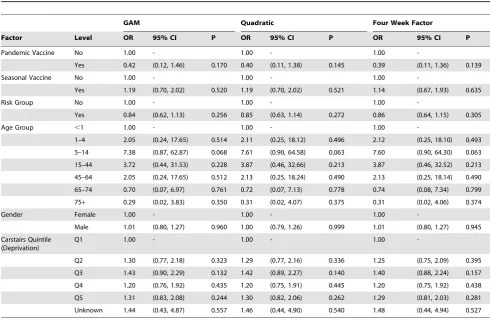
[image:8.612.65.554.77.336.2]The results of fitting the logistic regression with a quadratic temporal trend in week to swab positivity results are presented in Table 8. Alternative means of controlling for the temporal trend were considered - a spline trend within a generalised additive
Table 6.Hazard ratio of consultation estimated by Cox proportional hazards regression for the three consultation groupings.
ILIARI ILI ARI
Variable Level HR 95% CI HR 95% CI HR 95% CI
Pandemic vaccination Yes 1.128 (1.033, 1.232) 0.507 (0.323, 0.797) 1.044 (0.970, 1.123)
Gender Male 0.801 (0.770, 0.834) 0.763 (0.687, 0.846) 0.778 (0.750, 0.806)
Age 5–14 0.355 (0.331, 0.380) 0.957 (0.777, 1.179) 0.355 (0.332, 0.379)
15–44 0.188 (0.177, 0.200) 0.635 (0.524, 0.768) 0.191 (0.180, 0.202)
45–64 0.172 (0.161, 0.184) 0.339 (0.272, 0.421) 0.152 (0.142, 0.162)
65–74 0.202 (0.183, 0.223) 0.172 (0.121, 0.244) 0.201 (0.184, 0.220)
75+ 0.174 (0.156, 0.194) 0.048 (0.027, 0.086) 0.155 (0.141, 0.171)
Seasonal vaccination Yes 0.993 (0.917, 1.075) 1.523 (1.184, 1.960) 0.724 (0.678, 0.773)
Vaccinated in previous season Yes 1.778 (1.649, 1.916) 1.398 (1.136, 1.721) 2.665 (2.513, 2.826)
No. of ILIARI in previous season 1 2.612 (2.478, 2.754) 1.700 (1.452, 1.990) 2.329 (2.219, 2.444)
2+ 4.809 (4.514, 5.124) 2.411 (1.902, 3.058) 3.995 (3.764, 4.240)
In clinical risk group Yes 1.524 (1.429, 1.626) 1.565 (1.334, 1.837) 3.113 (2.957, 3.277)
Carstairs quintile Q2 1.050 (0.967, 1.141) 1.589 (1.284, 1.967) 0.963 (0.895, 1.038)
Q3 0.970 (0.905, 1.039) 1.319 (1.092, 1.593) 0.868 (0.816, 0.924)
Q4 0.970 (0.905, 1.039) 0.993 (0.816, 1.207) 0.958 (0.901, 1.019)
Q5 1.076 (1.001, 1.157) 1.153 (0.942, 1.411) 0.896 (0.839, 0.958)
Unknown 0.991 (0.752, 1.305) 1.579 (0.831, 2.999) 0.944 (0.733, 1.215)
Results are relative to the baseline group which is females aged 0–4 in no clinical risk group and in Carstairs deprivation quintile 1 who did not receive a seasonal influenza vaccination in the previous season or the current season, had no ILIARI consultations in the previous season and did not receive the H1N1 vaccination in season 2009/10. ILI: Influenza-like illness, ILIARI: Influenza-like illness and acute respiratory infections (excluding asthma), ARI: All influenza-like illness and acute respiratory infections (including asthma).
[image:8.612.61.555.551.712.2]doi:10.1371/journal.pone.0028743.t006
Table 7.VE estimates produced by each of the statistical methods with associated 95% confidence intervals for the three consultation coding groupings: ILIARI, ILI and ARI.
ILIARI ILI ARI
Adjustment Method VE 95% CI VE 95% CI VE
Time only Poisson before/after 14.1 (5.4, 21.9) 19.1 (217.5, 50.6) 20.4 (13.9, 26.5)
Poisson unvaccinated/vaccinated 271.0 (284.8,258.2) 22.3 (219.7, 49.6) 2121.8 (2136.8,2107.9)
Cox proportional hazards 269.4 (283.1,256.7) 23.8 (217.5, 50.6) 2120.2 (2135.0,2106.3)
Clustered Cox proportional hazards 269.4 (298.5,244.5) 23.8 (228.6, 54.8) 2120.2 (2152.1,292.2)
Unadjusted Screening 34.1 (25.6, 45.5) 20.3 (13.8, 29.8) 46.5 (35.0, 61.8)
Covariate and time adjusted Poisson before/after 27.7 (218.6, 2.3) 34.2 (20.05, 58.9) 18.0 (11.2, 24.2)
Poisson unvaccinated/vaccinated 213.8 (224.2,24.2) 48.7 (19.4,67.3) 25.1 (213.1, 2.4)
Cox proportional hazards 212.8 (223.2,23.3) 49.3 (20.3, 67.7) 24.37 (212.3, 3.0)
Clustered Cox proportional hazards 212.8 (227.7, 0.3) 49.3 (13.6, 70.2) 24.37 (218.5, 8.1)
model for the weekly temporal trend and a factor with 4 levels representing the 4 four week period. The parameter estimates were relatively unaffected by the method of estimating the trend and the estimates from the most parsimonious model using a
quadratic trend are discussed. Adjusting for the other factors in the model there is no evidence of any effect on swab positivity of seasonal vaccination status, risk group, deprivation and gender. There are trends with Age group, p,0.0001, with greater swab positivity among those aged 5–14 and 15–44 years. There was no evidence of any interactions with vaccination status and similar results were obtained for the vaccine effects when considering only those in a risk group. Relative to those who were unvaccinated at the time of swabbing the odds ratio of testing positive is 0.40 (95% CI 0.11, 1.38),p= 0.17. This corresponds to a vaccine effect of 60% (95% CI238%, 89%).
Vaccine effectiveness – death outcome
A total of 623 patients are recorded on the GP systems as having died in the 4 month study period giving a crude death rate of 9.8 per 1000 population per year (95% CI 9.0, 10.5) compared to the Scottish rate of 10.5 per 1000 population per year. This suggests under reporting of deaths on the GP systems.
The parameter estimates from the Cox regression model are presented in Table 9. Pandemic vaccine is associated with a reduction in the risk of death with a relative risk of 0.60, (95% CI 0.44, 0.82) and this is similar to the relative risk associated with the use of seasonal flu vaccine 0.52 (95% CI 0.42, 0.64). Temporal changes in the vaccine effects for the death outcome are presented in Table 10. The H1N1v vaccine effect clearly wanes over time and once the pandemic has ceased there is no vaccine effect on mortality. For seasonal influenza vaccination the pattern is similar though the effects persist during the winter season but once the pandemic H1N1v activity has ceased.
Discussion
[image:9.612.65.550.77.302.2]This study has provided vaccine effect estimates for the pandemic influenza A H1N1v vaccine for consultations, virology
Figure 3. Graphical representation of the VE estimates produced by month by each of the statistical models with associated 95% confidence intervals for the ILI consultation grouping.
[image:9.612.308.551.82.301.2]doi:10.1371/journal.pone.0028743.g003
Figure 4. Graphical representation of the VE estimates produced by month by each of the statistical models with associated 95% confidence intervals for the ILIARI consultation grouping.
doi:10.1371/journal.pone.0028743.g004
Figure 5. Graphical representation of the VE estimates produced by month by each of the statistical models with associated 95% confidence intervals for the ARI consultation grouping.
[image:9.612.58.297.458.669.2]and death. Comparing unvaccinated with vaccinated the vaccine effect was 60% (95% CI 238%, 89%) for virology confirmed influenza cases, among patients with symptoms, 49% (95% CI 19%, 67%) for ILI consultations, and 40% (95% CI 18%, 56%) for overall mortality; the latter two among all patients in the cohort. There was no significant vaccine effect for ILIARI and ARI consultations with negative estimates. The virology estimate was not significant and not inconsistent with those based upon the test negative design, [2–5], though it is towards the lower limit of the confidence intervals. The low number of vaccinated individuals who are swabbed is the main reason for the imprecision in the estimate.
In this study the results about the effect of the seasonal influenza vaccine are conflicting. The analysis of ILI consultations showed that patients who received the seasonal flu vaccine in the current season had a 53% increase in consultations (95% CI 18%, 96%) this slightly greater than the effect of receiving seasonal vaccine in the previous year, 40% (95% CI 14%, 72%). This result is consistent with the increased risk of medically attended ILI reported by Skowronskiet al.[14], however the virology analysis does not confirm this as it shows a non-significant 19% increase. The consultation rates for ILIARI and ARI are reduced among patients who received the seasonal flu vaccine.
The vaccine effectiveness estimate varies dependent on the group of clinical codes used within the cohort for the description of their respiratory infection. Thus a different answer on effectiveness is obtained dependent on whether we chose just influenza like
illness (ILI) or all acute respiratory infections (including influenza like illness) (ARI) and whether we include or exclude asthma exacerbations within this category (ILIARI). Although ILI conditions alone may be more specific, the number of observations in the PIPeR cohort are relatively small hence the VE estimate and confidence intervals around any estimate vary widely for a long period before a more precise estimate is obtained. For ILIARI we have a greater number of observations and this addresses the problem of variability in general practice recording, whereby there may be failure to record ILI as a diagnosis, particularly in young children or individuals with milder disease manifestation. However, the lower specificity of the ILIARI code grouping may lead to underestimation of the vaccine effectiveness estimate. In the adjusted models we present, the less specific ILIARI code grouping consistently produced the lowest VE estimate.
[image:10.612.63.554.87.408.2]Using the ARI grouping, the VE estimate obtained by all methods is greater than the estimate obtained for ILIARI, which differs only by excluding asthma codes. Whilst a range of respiratory pathogens can induce exacerbations of asthma, influenza is a potent precipitant of asthma episodes either by itself or as a consequence of co-infection with other respiratory viruses or by virtue of secondary bacterial infections that may follow the initial influenza infection. This is particularly so in younger people. The finding of a further reduction in clinical presentations after vaccination from the Poisson regression model comparing before vaccination with after vaccination, leading to an
Table 8.Odds ratios and 95% confidence intervals for the effects of the listed factors on H1N1v swab positivity among patients under 65 who were swabbed as part of the Scottish Sentinel Swabbing Scheme.
GAM Quadratic Four Week Factor
Factor Level OR 95% CI P OR 95% CI P OR 95% CI P
Pandemic Vaccine No 1.00 - 1.00 - 1.00
-Yes 0.42 (0.12, 1.46) 0.170 0.40 (0.11, 1.38) 0.145 0.39 (0.11, 1.36) 0.139
Seasonal Vaccine No 1.00 - 1.00 - 1.00
-Yes 1.19 (0.70, 2.02) 0.520 1.19 (0.70, 2.02) 0.521 1.14 (0.67, 1.93) 0.635
Risk Group No 1.00 - 1.00 - 1.00
-Yes 0.84 (0.62, 1.13) 0.256 0.85 (0.63, 1.14) 0.272 0.86 (0.64, 1.15) 0.305
Age Group ,1 1.00 - 1.00 - 1.00
-1–4 2.05 (0.24, 17.65) 0.514 2.11 (0.25, 18.12) 0.496 2.12 (0.25, 18.10) 0.493
5–14 7.38 (0.87, 62.87) 0.068 7.61 (0.90, 64.58) 0.063 7.60 (0.90, 64.30) 0.063
15–44 3.72 (0.44, 31.53) 0.228 3.87 (0.46, 32.66) 0.213 3.87 (0.46, 32.52) 0.213
45–64 2.05 (0.24, 17.65) 0.512 2.13 (0.25, 18.24) 0.490 2.13 (0.25, 18.14) 0.490
65–74 0.70 (0.07, 6.97) 0.761 0.72 (0.07, 7.13) 0.778 0.74 (0.08, 7.34) 0.799
75+ 0.29 (0.02, 3.83) 0.350 0.31 (0.02, 4.07) 0.375 0.31 (0.02, 4.06) 0.374
Gender Female 1.00 - 1.00 - 1.00
-Male 1.01 (0.80, 1.27) 0.960 1.00 (0.79, 1.26) 0.999 1.01 (0.80, 1.27) 0.945
Carstairs Quintile (Deprivation)
Q1 1.00 - 1.00 - 1.00
-Q2 1.30 (0.77, 2.18) 0.323 1.29 (0.77, 2.16) 0.336 1.25 (0.75, 2.09) 0.395
Q3 1.43 (0.90, 2.29) 0.132 1.42 (0.89, 2.27) 0.140 1.40 (0.88, 2.24) 0.157
Q4 1.20 (0.76, 1.92) 0.435 1.20 (0.75, 1.91) 0.445 1.20 (0.75, 1.92) 0.438
Q5 1.31 (0.83, 2.08) 0.244 1.30 (0.82, 2.06) 0.262 1.29 (0.81, 2.03) 0.281
Unknown 1.44 (0.43, 4.87) 0.557 1.46 (0.44, 4.90) 0.540 1.48 (0.44, 4.94) 0.527
The swabs were all collected between October 1st
2009 and 31st
increased VE estimate when all acute respiratory infections including asthma are measured, is then an expected finding. There are, however interpretational difficulties associated with differentiating between consultations associated with environmen-tal challenges rather than infective challenges in asthma exacerbations. Therefore the estimate of VE may be inflated artificially by inclusion of asthma codes. It should also be noted that, the specificity of the ARI and ILIARI categories will be
influenced by the incidence of influenza relative to other circulating respiratory illness and therefore using ILI consultations for estimations is the preferred choice. In non-pandemic years, there has however been a lack of recording of the class despite influenza circulating. It is therefore essential that other groupings are available for analysis.
[image:11.612.63.557.77.421.2]The vaccine effectiveness estimate was also found to depend on the statistical methodology used. For ILI the estimates were similar
Table 9.Hazard ratios of death, with 95% confidence limits, estimated by Cox proportional hazards regression.
Factor Level HR 95% CI P-value
Pandemic Vaccine No 1.00
-Yes 0.60 (0.44, 0.82) 0.001
Seasonal Vaccine No 1.00
-Yes 0.52 (0.42, 0.64) 0.000
Seasonal Vaccine No 1.00
-Previous Season Yes 1.45 (1.18, 1.78) 0.000
Number of ILIARI consultations in previous year 0 1.00
-1 1.19 (0.89, 1.58) 0.251
2 1.12 (0.60, 2.09) 0.732
3+ 2.74 (1.61, 4.66) 0.000
Risk Group No 1.00
-Yes 4.96 (3.99, 6.17) 0.000
Age Group ,14 1.00
-15–44 2.44 (0.73, 8.18) 0.149
45–64 11.39 (3.59, 36.13) 0.000
65–74 77.75 (24.51, 246.62) 0.000
75+ 355.21 (112.98, 1116.77) 0.000
Gender Female 1.00
-Male 1.25 (1.06, 1.46) 0.007
Carstairs Quintile (Deprivation) Q1 1.00
-Q2 0.99 (0.70, 1.40) 0.945
Q3 0.85 (0.63, 1.15) 0.290
Q4 1.01 (0.75, 1.36) 0.964
Q5 1.10 (0.81, 1.51) 0.536
Unknown 1.30 (0.47, 3.60) 0.611
doi:10.1371/journal.pone.0028743.t009
Table 10.Vaccine effect on overall mortality estimated by Poisson regression in various time periods after the beginning of the study.
Start End Epidemic period Pandemic H1N1v Vaccine Seasonal Vaccine
VE 95% CI P-value VE 95% CI P-value
01/10/2009 25/11/2009 Peak 100.0 - - 71.6 (57.0, 81.3) 0.000
26/11/2009 23/12/2009 Wane 62.4 (24.6, 81.2) 0.006 49.1 (23.2, 66.3) 0.001
24/12/2009 20/01/2010 Wane 38.3 (8.2, 58.5) 0.017 18.7 (222.4, 46.0) 0.321
21/01/2010 17/02/2010 After 30.8 (23.3, 53.6) 0.072 52.2 (27.0, 68.6) 0.001
18/02/2010 17/03/2010 After 20.9 (248.3, 31.3) 0.963 24.5 (220.7, 52.8) 0.240
18/03/2010 30/04/2010 After 1.7 (236.1, 29.0) 0.918 215.7 (275.6, 23.8) 0.495
In the first period from 1/10/2009 to 25/11/2009 no pandemic H1N1v vaccinated individuals died hence the VE is estimated as 100% and no confidence intervals supplied.
[image:11.612.62.557.581.703.2]however adjustment for confounding variables and propensity to consult had a larger effect for the two methods based upon the comparison of vaccinated with unvaccinated. This is because the vaccine effect is essentially a between person estimate in these models whereas in the before vaccination after vaccination framework there is a matching with the same individuals in both groups. The before vaccination after vaccination framework method should produce more precise results by directly accounting for possible differences in the propensity to consult between the vaccinated and unvaccinated individuals though will not do so if the propensity changes post vaccination. Furthermore, the before after framework is retrospective, in that it is vaccine status at the end of the season which determines the exposure group and this is not as statistically valid as the prospective framework for the time dependent Cox model or Poisson Regression model.
For both ILIARI and ARI there is a large change in the vaccine effect estimates associated with adjustment for confounding from the two methods comparing vaccinated and unvaccinated patients. For all three methods the adjustment serves to increase the estimated vaccine effect.
The more simplistic screening method, based on aggregate data and unadjusted for time and covariates, gave similar results to the other methods for ILI but for the less specific consultation groupings gave over estimates of the effectiveness. This is likely due to the lack of adjustment the healthy vaccine effect and the change in consultation patterns across the time frame considered. Linking the cohort to all virology tests in Scotland has shown some of the biases in having a swab and it was demonstrated that patients aged 15–44 who had symptoms were more likely to be swabbed that older and younger symptomatic patients. It was demonstrated that having a swab was unrelated to gender, membership of a risk group, having had the seasonal vaccination in the previous year and number of consultations in the previous year. Other than age the only other determinant of swabbing was deprivation and this is may be associated with swabbing frequency in the general practices.
Using death as an endpoint yields results which are difficult to interpret as both the pandemic vaccine and the seasonal vaccine are independently associated with a reduction in the risk of death. During the 2009–10 pandemic season the confirmed death rate from Influenza A H1N1v was low and a 40% reduction in death
rate from influenza vaccine is rather large – however this is a relative reduction in mortality. We cannot discount, however, that the effect is not a ‘healthy vaccinate effect’ in that frail patients were not less likely to be vaccinated and this would certainly explain both the pandemic and seasonal vaccine effects. The trends over time in this effect show that the effects are present during the winter period when there are traditionally higher death rates, particularly among those over 65.
Overall, this analysis has provides support for an association between influenza and increased consultations. The low levels of VE may be related in part to the fact that Influenza A H1N1v activity had begun to wane by the time vaccine was distributed. Similar estimates of vaccine effect have been found using different methodologies but the results are found to vary with the measure of outcome used. Understanding the variation in the estimates between the methods used and the outcome considered aids analysis and interpretation of vaccine effectiveness results in future seasons.
Acknowledgments
We would like to express our thanks to the following list of individuals
without whom this paper would not have been possible. Health
Protection Scotland – Arlene Reynolds, Heather Murdoch, Eisin McDonald, Alison Potts, Fiona Johnston, John Love, Louise Shaw, Karen
Voy, Lynne Otterson, Martin Scott, Beverley Wayne, Bill Smyth;West of
Scotland Specialist Virology Centre– Bill Carmen, Rory Gunson,
Catherine Frew;PIPeR practices–Radnor Street surgery, Clydebank
Health Centre, Cairntoul Practice, Bridgeton Health Centre, Pollokshaws Medical Centre, Greenock Health Centre, Neilston Medical Centre, Riverview Medical Centre, Linden Medical Centre (all NHS Greater Glasgow & Clyde), Glenfield Medical Practice, Waverley Medical Practice (both NHS Borders), Lochinch Practice (NHS Dumfries & Galloway), Hospital Hill Surgery (NHS Fife), Denny Cross Medical Centre (NHS Forth Valley), Yell Health Centre (NHS Shetland),Newton Port Surgery,
Craigshill Health Centre (both NHS Lothian).Scottish Government–
Gareth Brown, Rona Watters.
Author Contributions
Conceived and designed the experiments: JM CR. Analyzed the data: KK CR. Wrote the paper: KK CR JM.
References
1. ECDC (2009)Protocol for cluster investigations to measure influenza vaccine effectiveness in the EU/EEA.ECDC TECHNICAL DOCUMENT http://www.ecdc.europa. eu/en/publications/Publications/0912_TED_Protocol_for_Cluster_Investiga-tions_to_Measure_Influenza_Vaccine_Effectiveness.pdf Accessed 2011 Jun 17. 2. Valenciano M, Kissling E, Cohen J-M, Oroszi B, Barret A-S, et al. (2011) Estimates of Pandemic Influenza Vaccine Effectiveness in Europe, 2009–2010: Results of Influenza Monitoring Vaccine Effectiveness in Europe (I-MOVE) Multicentre Case-Control Study. PLoS Med 8(1): e1000388. doi:10.1371/ journal.pmed.1000388.
3. Hardelid P, Fleming DM, McMenamin J, Andrews N, Robertson C, et al. (2011) Effectiveness of pandemic and seasonal influenza vaccine in preventing pandemic influenza A(H1N1)2009 infection in England and Scotland 2009– 2010. Euro Surveill 16(2): pii = 19763.
4. Skowronski DM, Janjua NZ, De Serres G, Hottes TS, Dickinson JA, et al. (2011) Effectiveness of AS03 adjuvanted pandemic H1N1 vaccine: case-control evaluation based on sentinel surveillance system in Canada, autumn 2009. BMJ Feb 3;342: c7297. doi: 10.1136/bmj.c7297.
5. Puig-Barbera` J, Arnedo-Pena A, Pardo-Serrano F, Dolores Tirado-Balaguer M, Pe´rez-Vilar S, et al. (2010) Effectiveness of seasonal 2008–2009, 2009–2010 and pandemic vaccines, to prevent influenza hospitalizations during the autumn 2009 influenza pandemic wave in Castello´n, Spain. A test-negative, hospital-based, case-control study. Vaccine 28(47): 7460–7467.
6. Wichmann O, Sto¨cker P, Poggensee G, Altmann D, Walter D, et al. (2010) Pandemic influenza A(H1N1) 2009 breakthrough infections and estimates of vaccine effectiveness in Germany 2009–2010. Euro Surveill 15(18): pii = 19561. 7. ISD. General Practice - Practice Team Information. http://www.isdscotland.
org/isd/3727.html Accessed 2011 Jun 17.
8. McLoone P Carstairs Scores http://www.sphsu.mrc.ac.uk/publications/ carstairs-scores.html Accessed 2011 Jun 17.
9. Cox DR (1972) Regression Models and Life-Tables. JRSS Series B (Methodological) 34(2): 187–220.
10. Frome EL, Kutner MH, Beauchamp JJ (1973) Regression analysis of Poisson-distributed data. Journal of the American Statistical Association 68(344): 935–940.
11. Farrington CP (1993) Estimation of vaccine effectiveness using the screening method. International Journal of Epidemiology 22(4): 742–6.
12. ECOSS (The Electronic Communication of Surveillance in Scotland), Health Protection Scotland http://www.hps.scot.nhs.uk/surveillance/SystemsDetail. aspx?id=248 Accessed 2011 Jun 17.
13. Wood SN (2006) Generalized Additive Models: An Introduction with R. London: Chapman and Hall/CRC.