International Conference on Maritime Safety and Operations, Glasgow, UK, 13th – 14th October 2016
155
1 INTRODUCTION
Most new advanced ships have extensive data col-lection systems to be used for continuous monitoring of engine and hull performance, for voyage perfor-mance evaluation (Nielsen et al., 2011). It is im-portant to have a measure of the variability in the wave-induced extreme response for ships due to this statistical uncertainty for sea states in various ser-vices (Moan et al, 2005). Therefore, it is necessary to ensure safety, reliability, and integrity of ship struc-tures for avoiding major accidents.
INCASS project targets to enable more efficient coordination of inspection scheduling and monitor-ing practices, so as to address emergency (short term) decision making in case of accidents occurring as well as supporting long term decisions.
As an innovative framework, INCASS project develops he system for monitoring ship structures, machinery and equipment (Michala, L., 2016), and aims to avoid ship accidents, promote maritime safe-ty and protect the environment via structural and machinery monitoring, data gathering, reliability analysis and decision support (EC 2009). Monitoring is an important part that it is costly for ship compa-nies with regard to either inspection or maintenance (Lazakis et al., 2016). From the initially sensors uti-lized for data acquisition, eventually, the DSS
sys-tem presented and processed the stored data in order to assist predicting the probabilities of upcoming failures and taking timely and effective maintenance actions (Michala et al, 2016). Most new advanced ships have extensive data collection systems to be used for continuous monitoring of engine and hull performance, for voyage performance evaluation (Nielsen et al., 2011), where the most critical wave-induced ship extreme response can be estimated. To illustrate the VBM variability during navigation, amount of database, like pitch angle, obtained from the tiltmeter installed on board, can be recorded into the log files and transfer the data into VBM.
2 REVIEW
2.1 Strip theory
Based on the concept of the slender body theory in aerodynamic, the applied hydrodynamic models are the Strip theories (Kouvin-Kroukovdky 1955), as the most appropriate tool, first developed for accurate prediction of the wave loads and ship responses to account for the forward speed. Due to the linear strip theories are computational simplicity and the gener-ally satisfactory agreement with experiments, so far the theories have been widely accepted and used as the main tool for estimating the performance of a
Wave-Induced Vertical Bending Moment Estimation by Onboard
Tiltmeters units on Container Ship
M. Li, E. Boulougouris, I. Lazakis & G. Theotokatos
University of Strathclyde, Glasgow, U.K.ABSTRACT: Full-scale measurements in oceangoing ships have shown that the relationship between bending moment with the curvature curve of hull girder. As part of the INCASS (Inspection Capabilities for Enhanced Ship Safety) EU FP7 project, this paper carried out an estimation of wave-induced vertical bending moment for cargo hold of the 4250 TEU container ship, based on the data of pitch angles processing from the Tiltmeter units placed on board. The results are enable to be processed to the Decision Support System (DSS), in order to assist to monitoring and risk analysis for ship structure and machinery the towards enhanced and efficient ship operations (Konstantinos, et al., 2015). The prediction values also provide a reference for the trend analy-sis of the past record signals (Ulrik Dam et al, 2015) for evaluation of longitudinal strength of container ship. The advance in different pitch angle response (deformation curvature) of hull girder can be as a development of modern decision support systems for guidance to the ship’s master (Lloyd's Register, 2016).
156
ship in waves, especially very straightforward in ir-regular waves (Wang, Z., 2000).
Based on a perturbation procedure, a non-linear quadratic strip theory formulated in the frequency domain predicts wave loads and ship responses in moderate seas (Jensen et al., 1996. Schlachter et al, 1989) used the non-linear strip theory of higher order differential (Soding, 1982) Predicted vertical ship motions and wave loads. ITTC (1987) concluded that the slender body theory is not seem to possess advanced over the strip theory for the vertical mo-tions of a ship at forward speed, whereas it seems to provide better predictions for sway and yaw motions.
2.2 Long term prediction of bending moment
The St. Denis-Pierson method is originated to pre-dict the ship motions at other conditions by the con-tributions of various wave frequencies to response motions in regular or random seas (St. Denis and Pierson, 1953). The short term response of wave in-duced motions and loads in frequency-domain are obtained as the product of an input wave spectrum by a transfer function. It is discussed the mainly choice of wave scatter diagram and calculation of the transfer functions, on the definition of the design re-quirement for wave induced vertical bending mo-ments(Soares et al., 1990). Variability in the wave-induced extreme response for marine structure is important due to the statistical uncertainty for sea states in various service periods. (Moan et al, 2005). The adequacy of the Pierson-Moskowitz spectrum for long-term formulations of wave-induced load ef-fects has been tested for ships of different character-istics (Soares et al., 1990). IACS has issued the standard wave data (IACS Recommendation 34) which is recommended to use a return period of at 20 years, ship’s service life T0=20 year,
correspond-ing to about 10-8 probability of exceedance (p.o.e)
per cycle. Lee et al. (2011a, 2011b) report the non-linear hydroelastic analysis of a container ship (336m), by comparing the calculated vertical bend-ing moments with results from model tests with flex-ible model in head seas.
2.3 Hydroelastic Method
The treatment of ships as rigid bodies responding to waves has largely continued to use the traditional approach, however, bodily motions imply that the structure experiences neither strains nor stresses. Al-so, concepts such as mode shapes, natural and reso-nant frequencies, fatigue, etc. are not encompassed by the rigidity restriction (Hirdaris, 2005). Heller and Abramson (1959) proposed the following definition: ‘Hydroelasticity is concerned with the phenomena involving mutual interactions among inertial, hydro-dynamic and elastic forces’. Bishop and Price estab-lished the basic principles of a theory for flexible
beam-like hulls subject to steady state and transient (e.g. slamming) wave-induced loads, combining Ti-moshenko beam and strip theories.
The global hydro-elastic structural responses, i.e. whipping and springing, are important issues in the container ship design and operation. A description of the dynamic response of a ship considered as a Ber-noulli-Euler beam is given, and the emphasis here is on the 2-node vertical bending mode. (Andersen, I.M.V., 2014). The 2-node vertical bending mode shape of the 9,400 TEU ship is determined using the in-house non-linear strip-theory code SHIPSTAR (see Xia et al., 1998) with the ship hull modelled as an elastic non-uniform Timoshenko beam with the actual stiffness EI(x) and mass m(x) variation along the length of the hull including the added mass of water. The mode shape compared to that determined by Bureau Veritas (Kapsenberg et al., 2010) by the use of a finite element beam model, and the two are found to be almost identical.
3 METHODOLOGY
3.1 Hull longitudinal curvature with different VBM
The governing equation for the vertical deflection,
ω(x, t), of a Bernoulli-Euler beam as function of lo-cation x and time t is:
( ) ( , )) ) , ( ) (
(EI x x t p
x
,
t
m x x t (1)Where
x and
t
()
) (
EI(x) is the bending rigidity, m(x) is the mass per length non-including the added mass of water; p(x) represented the external load. This paper only con-sider the 2-node vertical bending mode, shown in Fig. 1, and the relationship between curvatures κ loaded with different VBM in mid ship. The symbol
[image:2.595.312.556.620.701.2]κ is the hull longitudinal curvature when the hull girder is subjected to the mixed complexed forces, i.e. gravity, wave hydrostatic and wave hydrodynam-ic pressure.
Figure 1. Curvature κ of the hull girder in wave.
157
vector φ and the angle curvature vector θ in the line-ar elastic range (Özgüç et al, 2008).
tan tan x y I I (2)
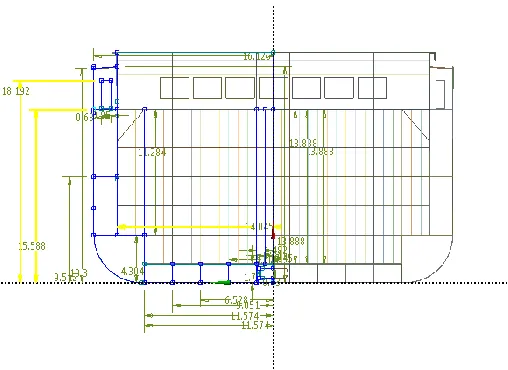
Following procedure is discussing the curvature of the bulwark edge at the top of cargo hold. In Fig. 19, angles 1 and 2, mean that the cargo hold being subjected to the VBM, has a pitch angle at the two ends of the top bulwark edge, the total pitch angle =
θ1+θ2 .
To obtain the relationship of the total pitch angle and vertical bending moment, the cargo hold is load-ed different VBM at two sides, like Fig. 16. Follow-ing graphs show the bulwark top edges vertical de-formation. Due to we only need the factor of VBM, however, other conditions are also impact the curva-ture of the cargo hold. This total deformation ωt
con-sists of two parts, 1. The deformation ωvbm caused by
VBM;2. The other deformation ωother. To explicitly
explain the VBM affection, it should subtract the de-formation when the VBM value =0.
The equation of the deflection curve of continu-ous beam in simple support (Hughes et al, 2010):
1 2 (1 )
6 1 2
3 l x m l x m l x l x EI l (3)
And the beam-end rotation angle
EI l m EI l m 6 3 2 1
1
(4) And EI l m EI l m 3 6 2 1
2
(5)
Where ε is deflection of the beam; x is the coordinate in beam; l is the length of the beam; m1 and m2 are
vertical bending moment loading in beam-end; θ1
and θ2 is the rotation angle on the beam-end.
In the general beam theory, the basic equation (Özgüç and Barltrop, 2008) that relate the applied VBM and horizontal bending moment to the longi-tudinal stress are very simple:
y i y x i x i I x M I y M (6)
4 CASE STUDY
4.1 Numerical analysis of cargo hold
Normally, a cargo hold model is only the parallel mid-body region. From the loading manual and the structural arrangement of the mid ship section and
support bulkhead document of 4,250 TEU Container Vessel, the cargo holds FE model of container ship are established by ANSYS workbench for static analysis, and the cross section is shown in Fig. 2. Based on the assumption, a reasonable model is cho-sen to extend from halfway hold No.5 (Frame. 97) up to halfway hold No. 7 (Frame. 205) lengthwise, i.e. (1/2+2+1/2) cargo holds. Symmetry about the centre-plane is also considered.
Figure 2. Cross section of cargo hold.
4.2 Material models and meshing method
Only one kind of steel is used in this model. The ma-terial considered is Isotropic Elasticity, Young’s Modules E= 2E+11 Pa; Poisson’s Radio is 0.3, Ten-sile Yield Strength σt = 2.5E+08 Pa, as well as the
Compressive Yield Stress σc = 4.6E + 08 Pa, and
Tensile Ultimate Strength σu = 4.6E + 08 Pa. This
[image:3.595.308.562.180.365.2]case model is adopted the line, surface, and solid, three type of elements. This finite element modelling consists of choosing the appropriate element type and mesh size. Even today, rapid increase in com-puter processing power and memory has not elimi-nated computational cost and time constrains. The meshing size is adopted the automatic sizing method in software, minimum to maximum size is 0.13 to 0.64 m, shown in Fig. 3.
158
4.3 Boundary Conditionsd
Generally, to obtain the accuracies in results, bound-ary condition effects in the light-ballast condition is particular important. In this case, it is considered the impact of VBM on longitudinal strength. Then the design load cases of extreme vertical bending mo-ment that be applied to the cargo hold model, shown in Fig. 4, with the probability level 10-8(Lloyd's
Reg-ister, 2014a), in which the design regular wave (H
=15.6 m). Both vertical bending moments are posi-tive (+) sagging condition.
[image:4.595.312.556.33.130.2]Apart from the loading boundary, it is hard to de-fine the displacement boundary condition. The BC (boundary condition) rules (DNV-RP-C205 4.3, 2013), plane A and B are restricted the in the hori-zontal X direction and rotation of the Y, Z direction. All the stiffness in plates is fixed rotation in X direc-tion. To simulate the approximate symmetry at the two end of the structure, two sides need to be re-stricted in X displacement and Y, Z rotation dis-placement.
Figure 4. Sagging VBM at two sides.
[image:4.595.38.290.334.422.2]The Total Deformation, von-Mises Equivalent Stress and equivalent strain graph loaded by the ex-treme wave-induced VBM, shown in Fig. 5, 6, 7.
[image:4.595.157.548.391.764.2]Figure 5. Total deformation of cargo hold.
Figure 6. Von-Mises stress of cargo hold.
Figure 7. Equivalent strain of cargo hold.
4.4 Hull longitudinal curvature with Different VBM
This chapter studies the relationship between curva-tures κ loaded with different VBM in mid ship. To obtain the approximate deflection curve equation of the neutral axial vertical bending shape of the 2-node shape of hull girder, first step is important to analyze the deflection equation of the cargo hold. From the equation (6),
x axn b
n3
(6)
[image:4.595.37.288.509.611.2]where a and b is the equation coefficient of the de-flection of the simply support beam loaded by VBM is linear with the xn. From the Fig. 8, it is the deflec-tion curve of 2-node vertical bending shape with VBM value =1010Nm. This paper presents a deflec-tion curve equadeflec-tion of this vessel.
Figure 8. Deflection curve of cargo hold.
[image:4.595.318.555.586.758.2]159
Andersen (2014) using the in-house non-linear strip-theory code SHIPSTAR (Xia et al., 1998) with the hull model to compare the mode shape with that determined by Bureau Veritas, and the result is iden-tical. Using the statistical analysis software of MATLAB (Gao, 2011), for neutral axial 2-node shape of vertical bending shape with wave-induced VBM value is equal to 1010 Nm. This paper using least square fit and a 6th order polynomial being ap-proximated by:
006695 . 0 764 . 2 081 . 4 297 . 2 834 . 4 716 . 1 966 . 3 07 2 06 3 09 4 10 5 12 6 13 x e x e x e x e x e x e x (7)where x is the distance from the end of the model. Furthermore, with this equation of the deflection curve of the cargo hold, due to the deflection of lon-gitudinal of the hull girder is very small correspond to the principle of the container ship and the continu-ity, here the equation of cargo hold can be promoted to the 2-node shape of hull girder deflection in verti-cal direction.
Table 1. Vertical deformation variation with differ-ent wave-induced VBM.
Deformation (m)
different VBM (109Nm)
0 2.1 4 10
εt 6.67E-03 6.679E-03 6.684E-03 6.71E-03
εs 6.67E-03 6.67E-03 6.67E-03 6.67E-03
εw 0.0E+00 9.0E-06 1.4E-05 4.0E-05
With the different VBM values, it is obtained the deflection curve equations correspondingly. The Neutral surface 2-node vertical bending shape shown in Table 1, where εt is total deflect with both the still
and wave-induced vertical bending moment, εs is
de-flect only active by still water, εw is deflect only ac-tive by wave-induced vertical bending moment. Ac-cording to the define of the deflect, there is presented that the deflectiont s w.
Then the pitch angle θ of the hull girder shown in Fig. 9 is obtained from the slope value tan θ of de-flection curve rotation angle at the two end of the hull girder. Due to pitch angle is a minimum value witch is approached 0, further more 0means that tan. Above paragraph, it is presented that the deflectiont s w, in the same way,
0
1
where θ is the pitch angle by VBM; and
θ0 is pitch angle of other loading condition. The
[image:5.595.310.561.63.321.2]dif-ferent deflection curve equation and curvature are comparison with the study result for bulk carrier (Özgüç and Barltrop, 2008), shown in Table 2. Fig. 18 is showing the linear relationship refer to these VBM and curvature of the vessel.
Table 2. Vertical deformation variation with differ-ent wave-induced VBM.
VBM a 2tan 2(tantan0) curvature
[109Nm] [10-11] [deg] [deg]
0 4.537 7.424 0 0 2.1 4.543 7.434 0.0095 7.27E-05 4 4.547 7.440 0.0155 0.000119 10 4.565 7.469 0.0450 0.000346
Figure 10. Curvature varied with VBM.
It can be seen that before the VBM of vessel ap-proach to the extreme bending moment, the curva-ture linearly increases with the VBM, and the slope between these two parameters is depend on the transverse flexural rigidity.
And we only consider the vertical bending mo-ment influence, bonding with the equation (7). This paper presents a VBM- curvature relation equation:
1 eff VBM D M (8)
Where Deff is the effective vertical bending rigidity,
this symbol reflect the longitudinal strength between the VBM and curvature of hull girder. From the Ta-ble 2, the approximate values of the effective vertical bending rigidityDeff 28877.94N/m2.
5 RESULTS
[image:5.595.30.298.364.462.2]160
[image:6.595.34.277.37.122.2]Figure 11. Installed unites and corresponding location on the ship.
Figure 12. Differential Pitch angle at the end of vessel in time-domain.
With the equation (8) presented by the paper, and the estimate of rigidity ofDeff, the visual value above can be converted to VBM in time-domain during this vessel trip, shown in Fig.13. The extreme VBM in level of probability occurrence of 10-5 is equal to1.8109Nm. Comparing with the Fig. 21, VBM-LOG curve, VBM of probability of 10-5 values is1.6109Nm. The reason of the different between these two results is due to the other loading like, hor-izontal bending moment, torsion moment and the variable transverse section along with the longitudi-nal length of the ship, also influence the effective vertical bending rigidityDeff .
Figure 13. VBM during the vessel trip in time-domain.
6 CONCLUSION
From the database collected from the sensors of tilt-meter units installing in the deck at the forward and aft ward end of the ship, record of the two angles from the ship motion can be obtained, in case of that the curvature can got from the pitch angle (θ). The overall research of this paper is as follow:
Due to numerical simulation results for obtaining the relationship between VBM and longitudinal cur-vature of the hull girder, the curve of VBM variance in time domain can be obtained from the database obtained from the tiltmeters installed on board dur-ing the navigation of the container ship. Durdur-ing this period cycle, the 10-5 exceedance of possibility of
VBM value is high than the long-term prediction re-sults above, because in realistic, other loading, like horizontal bending moment, torsion bending mo-ment, or other hydrodynamic coefficient have impact on the bending stiffness of the hull girder.
ACKNOWLEDGEMENTS
This work was developed as part of INCASS (In-spection Capabilities for Enhanced Ship Safety) pro-ject, which has been financed by the European Un-ion’s FP7 (Seventh Framework Programme) under grant agreement no 605200.
REFERENCES
Andersen, IMV, Jensen, JJ & Nielsen, UD 2014, Full Scale Measurements of the Hydro-Elastic Response of Large Container Ships for Decision Support. Ph.D. thesis, Tech-nical University of Denmark (DTU), Kgs. Lyngby. DCAMM Special Report, no. S166 APA
Bishop, R.E.D, Price, W.G. and Wu, Y. A General Linear Hy-droelasticity Theory of Floating Structures Moving in a Seaway,
Phil. Trans. Royal Soc. London, A316: 375-426 (1986). DNV Classification Notes No.34.1, CSA - Direct Analysis of Ship Structures, August 2015
DNV Recommended Practice DNV-RP-C205, Environmental Conditions and Environmental Loads, April 2014
DNV Recommended Practice DNV-RP-H103, Modelling and Analysis of Marine Operations, April 2011
DNV Rules for Classification of Ships Pt.3 Ch.1, Hull structur-al design - Ships with length 100 metres and above, January 2016
Dikis, K., Lazakis, I., Taheri, A. and Theotokatos, G., 2015, May. Risk and Reliability Analysis Tool Development for Ship Machinery Maintenance. InInternational Symposium on Ship Operations, Management and Economics (pp. 28-29).
EC (2009). Regulation (EC) No 391/2009 of the European Par-liament and of the Council of 23 April 2009 – (Common Rules and Standards for Ship Inspection and Survey Organ-isations). Official Journal of the European Union.
[image:6.595.42.283.183.340.2] [image:6.595.35.281.570.728.2]161
Soares, C.G., Fonseca, N. and Pascoal, R., 2004. Long term prediction of non-linear vertical bending moments on a fast monohull. Applied Ocean Research, 26(6), pp.288-297. Heller, S.R. and ABRAMSON, H.N., 1959. Hydroelasticity: a
new naval science. Journal of the American Society for Na-val Engineers, 71(2), pp.205-209.
Hirdaris, S.E. and Chunhua, G., 2005. Review and introduction to hydroelasticity of ships. Lloyd’s Register.
IACS, 2001. Standard Wave Data, IACS Recommendation No.34.
Kapsenberg, G. K., M. Schiere, and I. Drummen (2010).
TULCS Work Package 6: Modeltest. Specifications for ex-periments (confidential). Maritime Research Institute Neth-erlands.
Korvin-Kroukovsky, B.V., 1955. Investigation of ship motions in regular waves. SNAME.
Lazakis, I., Dikis, K., Michala, A.L. and Theotokatos, G., 2016. Advanced ship systems condition monitoring for en-hanced inspection, maintenance and decision making in ship operations. Transportation Research Procedia,14, pp.1679-1688..
Lee, Y., White, N., Wang, Z., Zhang, S. and Hirdaris, S.E., 2012. Comparison of springing and whipping responses of model tests with predicted nonlinear hydroelastic anal-yses. International Journal of Offshore and Polar Engi-neering, 22(03).
Lee, Y., Wang, Z., White, N. and Hirdaris, S.E., 2011, January. Time domain analysis of springing and whipping responses acting on a large container ship. In ASME 2011 30th Inter-national Conference on Ocean, Offshore and Arctic Engi-neering (pp. 139-147). American Society of Mechanical Engineers.
Lloyd, A.R.J.M., (1989).General Ship Dynamics Aspects of Different Vehicle Types, 13th WEGEMT School.
Lloyd's Register (2016). Rules and Regulations for the Classifi-cation of Ships, Pt 4, Ch 8, Sec 15.3.
Lloyd's Register (2014a). Guidance Notes on the Assessment of Global Design Loads of Large Container Ships and Other Ships Prone to Whipping and Springing, Version 1.4. Michala, A.L., Lazakis, I. and Theotokatos, G., Predictive
Maintenance Decision Support System For Enhanced Ener-gy Efficiency Of Ship Machinery.
Moan, T., Gao, Z. and Ayala-Uraga, E., 2005. Uncertainty of wave-induced response of marine structures due to long-term variation of extratropical wave conditions. Marine Structures, 18(4), pp.359-382.
Nielsen UD. (2015). Response‐based sea state estimation for onboard DSS ‐ Safe and Efficient Marine Operations. [Sound/Visual production (digital)].
Nielsen, U.D., Jensen, J.J., Pedersen, P.T. and Ito, Y., 2011. Onboard monitoring of fatigue damage rates in the hull girder. Marine Structures,24(2), pp.182-206.
Nikolaidis, E. and Kaplan, P., 1991. Uncertainties in stress analysis on marine structures; final rept (no. Ssc-363).. Özgüç, Ö. and Barltrop, N.D., 2008. Analysis on the hull girder
ultimate strength of a Bulk Carrier using simplified method based on an incremental-iterative approach. Journal of Off-shore Mechanics and Arctic Engineering,130(2), p.021013. Soares, C.G., 1984. Representation of double-peaked sea wave
spectra.Ocean Engineering, 11(2), pp.185-207. Söding, H., 1982. Leckstabilität im seegang
St Dinis, M. and Pierson Jr, W.J., 1953. On the motions of ships in confused seas. NEW YORK UNIV BRONX SCHOOL OF ENGINEERING AND SCIENCE.
Jensen, J.J. and Dogliani, M., 1996. Wave-induced ship full vi-brations in stochastic seaways. Marine Structures, 9(3), pp.353-387.