City, University of London Institutional Repository
Citation:
Rangvid, J., Santa-Clara, P. and Schmeling, M. (2016). Capital market integration and consumption risk sharing over the long run. Journal of International Economics, 103, pp. 27-43. doi: 10.1016/j.jinteco.2016.08.001This is the accepted version of the paper.
This version of the publication may differ from the final published
version.
Permanent repository link:
http://openaccess.city.ac.uk/15464/Link to published version:
http://dx.doi.org/10.1016/j.jinteco.2016.08.001Copyright and reuse: City Research Online aims to make research
outputs of City, University of London available to a wider audience.
Copyright and Moral Rights remain with the author(s) and/or copyright
holders. URLs from City Research Online may be freely distributed and
linked to.
City Research Online: http://openaccess.city.ac.uk/ publications@city.ac.uk
Capital Market Integration and Consumption Risk
Sharing over the Long Run
∗Jesper Rangvid‡ Pedro Santa-Clara‡‡ Maik Schmeling∗∗
August 12, 2016
∗We thank two anonymous referees, Enrique Alberola, Pedro Barroso, Harald Hau, Mathias Hoffmann,
Andrew Karolyi, Martin Strieborny, and participants at various conferences and seminars for helpful com-ments and suggestions.
‡Department of Finance, Copenhagen Business School, Solbjerg Plads 3, 2000 Frederiksberg, Denmark.
E-mail: jr.fi@cbs.dk.
‡‡Millennium Chair in Finance, Universidade Nova de Lisboa - NOVA School of Business and Economics
and NBER, Campus de Campolide, 1099-032 Lisboa, Portugal. E-mail: psc@novasbe.pt.
∗∗Faculty of Finance, Cass Business School, City University London, 106 Bunhill Row, London EC1Y 8TZ,
Capital Market Integration and Consumption Risk
Sharing over the Long Run
Abstract
We empirically investigate time variation in capital market integration and consumption
risk sharing using data for 16 countries from 1875 to 2012. We show that there has
been considerable variation over time in the degrees of capital market integration and
consumption risk sharing and that higher capital market integration forecasts more
consumption risk sharing in the future. This finding is robust to controlling for trade
openness and exchange rate volatility as alternative drivers of risk sharing. Finally, we
calculate the welfare costs of imperfect consumption risk sharing and find that these
costs vary over time, line up with variation in risk sharing, and are quite substantial
during periods of low risk sharing.
JEL-Classification: F36, F21, E44, G12
1.
Introduction
A key function of financial markets is that they enable risk sharing among agents. One channel
through which risk sharing can occur internationally is via trade in international financial
assets. In other words, one prerequisite for international consumption risk sharing is capital
market integration. In this paper, we use data for 16 countries spanning approximately
140 years to show that periods with higher levels of capital market integration have been
followed by periods with higher levels of consumption risk sharing. We also show that there
is no evidence of the reverse effect, i.e. consumption risk sharing does not predict capital
market integration. These findings lend credence to the standard textbook model that capital
market integration is a prerequisite for risk sharing.
More specifically, according to textbook models (Obstfeld & Rogoff, 1996, for instance),
the resulting equilibrium in an economy where consumers have the same iso-elastic
util-ity functions and capital markets are perfectly integrated is one where consumption risk is
perfectly shared and only systematic risk to consumption remains. Despite the textbook
model’s clear predictions, it has been difficult to verify empirically that consumption risk
is shared internationally to the extent that the theoretical models predict, even among
de-veloped economies. Obstfeld (1994), Tesar (1995), Lewis (1996, 1999), Sørensen & Yosha
(1998), Sørensen, Yosha & Østergaard (2002), and Sørensen, Yosha, Wu & Zhu (2007) all
show that consumption risk is not shared as much as would a priori be expected.
In this paper, we provide fresh perspectives to this literature. Our main contribution is
that we empirically investigate time-series variation in consumption risk sharing and capital
market integration, as well as the interaction between these two key measures, using a long
sample period going back to the 19th century. Hence, instead of focusing on capital-market
integration and consumption risk sharing since the beginning of the post-Bretton Woods
period, as is often done in the literature, we propose to exploit the time-variation in
capital-market integration that has taken place over the last 140 years and link it to time-variation
inte-gration lacks power when looking only at the post-Bretton Woods period — where financial
integration and risk sharing have generally been trending up (Lane & Milesi-Ferretti, 2007)
— because there is too little variation in the two variables. Employing periods of high and
low financial integration over a longer time span alleviates this problem and allows for a
more powerful test of the theoretical link between financial integration and consumption risk
sharing. In pursuing this strategy, we take inspiration from the more recent literature that
examines financial globalization in a historical perspective, such as Obstfeld & Taylor (2004)
and Schularick & Steger (2010).1
Our approach relies to a large extent on the availability of very long data series for
many countries. We collect a comprehensive set of consumption growth rates and returns
on financial assets from sixteen countries during the 1875-2012 period. The dataset is a
combination of the data in Barro & Ursua (2008), the DMS international return database by
Morningstar, and the Global Financial Data (GFD) database. To the best of our knowledge,
we are the first to use such a long sample period to investigate the link between consumption
risk sharing and financial market integration.
Our starting point is to show that there has indeed been considerable time-variation in the
degree of international capital market integration over the last 140 years. As our measure of
market integration, we use the dispersion of equity return across countries, i.e. interpreting
a lower degree of return dispersion across markets as indicating a higher degree of equity
market integration. To make sure that our results are robust, we also consider alternative
measures of integration: one based on return exposures to common (global) factors, and one
based on a world CAPM. We find a consistent pattern across these different measures. There
are periods, such as those surrounding World-War I and II and during the Bretton Woods
regime, where capital markets are not highly integrated, and there are periods where capital
markets have been highly integrated, such as before World War I and since the beginning of
1The benefit of using long-term data like those we use in this paper is that we have more variation in
the 1990s.
Next, we investigate whether there is time-variation in consumption risk sharing, too. To
do so, we estimate cross-country regressions of idiosyncratic consumption growth
(country-specific consumption growth adjusted for world consumption growth) on idiosyncratic income
growth (Obstfeld, 1994; Lewis, 1995, 1996; Asdrubali, Sørensen, & Yosha, 1996; Sørensen
& Yosha, 1998; Sørensen, Yosha, Wu & Zhu, 2007; Kose, Prasad, & Terroes, 2009). If
consumption risk is shared, the estimated coefficient in this regression should be low, as
idiosyncratic consumption growth of a country should be independent of idiosyncratic income
growth. We estimate this cross-country regression for each year in our sample and analyze the
time-series movements in the estimated coefficient. We find that consumption risk sharing
was low during the World War periods as well as during Bretton Woods, when less than 20%
of idiosyncratic income shocks were diversified away. On the other hand, consumption risk
sharing was high during the early part and the last part of our sample, as well in the interwar
period before World War II. During these periods, around 50% of movements in idiosyncratic
income growth were diversified away.
Having established that there is strong time-variation in the degree of international
financial integration and consumption risk sharing, we investigate explicitly whether capital
market integration leads risk sharing or vice versa. In order to test for this link, we run
predictive regressions of future consumption risk sharing on current financial integration
and vice versa. We find clear evidence that financial market integration leads consumption
risk sharing, but we find no evidence that consumption risk sharing leads financial market
integration. Moreover, we find that there is a time lag between movements in consumption
risk sharing and market integration. Whereas the contemporaneous correlation between
capital market integration and consumption risk sharing is statistically insignificant, there is
significant predictability of risk sharing by market integration at horizons of five to ten years.
In a nutshell, our results imply that it takes several years until higher integration is followed
by higher risk sharing.
might be related to changes in the level of trade integration and exchange rate flexibility.
This part of our analysis is inspired by the finding in Kose, Prasad, Rogoff & Wei (2009)
that trade openness and financial integration both matter jointly for risk sharing of emerging
markets and the insights of Cole & Obstfeld (1991) that exchange rate flexibility can improve
risk sharing via changes in the terms of trade. We find that changes in the level of exchange
rate flexibility are unrelated to changes in risk sharing. On the other hand, we find some
evidence that trade integration helps foster risk sharing. For instance, if we split up risk
sharing into sharing of permanent shocks to output and sharing of transitory shocks to
output (Artis & Hoffmann, 2008), we find that trade integration helps smooth permanent
shocks to output. Also, since trade integration and capital market integration have both been
constantly increasing since the mid-1970s in particular, we find that trade and capital market
integration have contributed jointly to the increase in consumption risk sharing that we have
witnessed since the 1980s. We conclude that the relation between capital market integration
and risk sharing is strong, and that there is some evidence that trade integration and risk
sharing are related. We cannot find evidence that exchange rate flexibility has mattered
much for risk sharing.
Moving from a situation with less than full consumption risk sharing to one with full
risk sharing should lower consumption volatility due to the elimination of idiosyncratic shocks
and, hence, should be welfare-increasing for risk averse investors. In order to quantify how
important changes in consumption risk sharing are in economic terms, we calculate welfare
gains from international consumption risk sharing. These calculations represent the “utility
costs” of having less-than-perfectly integrated capital markets. We find that these utility
costs line up with our measure of consumption risk sharing over time in the sense that low
levels of risk sharing are also times with high utility costs. Moreover, we find utility costs to
be quite substantial during times of low risk sharing which suggests that time-variation in
consumption risk sharing has significant economic consequences and that understanding the
Related literature and our contributions in relation to this literature
There is a sizeable literature relating capital market integration to volatility, comovement
of economic activity, and risk sharing. For instance, Sørensen, Yosha, Wu & Zhu (2007),
Kose, Prasad, & Terroes (2009), and Bai & Zhang (2012) propose explanations for
recon-ciling empirical findings of high capital mobility during the period since the break-down of
the Bretton Woods and the less than perfect consumption risk sharing that characterizes
this period as well. Bekaert, Harvey, Lundblad & Siegel (2007) link capital market
liberal-ization/integration during the last couple of decades in emerging markets to GDP changes.
Kalemli-Ozcan, Papaioannou & Peydro (2013) and Kalemli-Ozcan, Papaioannou & Perri
(2013) study recent banking and capital market integration and its effect on economic
syn-chronicity. Some of these papers argue that capital market integration has had a sizeable
effect on consumption volatility (Bekaert et al., 2007) and comovement of economic activity
(Kalemi-Ozcan et al.) whereas other argue that risk sharing is still not as high as should
be expected (Bai & Zhang, 2012). Common to this literature is its use of data covering
(parts of) the period since the break-down of the Bretton Woods. This period has been
a period of generally increasing capital market integration and international capital flows.
A key difference between these papers and our paper is that we use a much longer sample
period. This allows us to study transitions between periods where capital market integration
was increasing but also, importantly and generally different from the above-mentioned
pa-pers, periods where capital market integration was actuallydecreasing and study the link to
market integration. In doing so, we verify that consumption risk sharing has gone up after
the increase in capital market integration that has taken place during the periods since the
early 1970s, but also that consumption risk sharing has gone down after periods with drops
in capital market integration.
A related literature examines whether financial integration and liberalization promotes
(e.g., Bekaert, Harvey & Lundblad, 2005) economic growth by making financing opportunities
by making countries more exposed to sudden shifts in capital flows.2 We are indirectly related
to this literature as we also examine the relation between capital market integration and
economic activity. Our focus on risk sharing is different, though.
Our paper is structured as follows: In the next section, we describe the data we use.
In Section 3, we study time variation in consumption risk sharing, and in Section 4 we
study time variation in financial market integration. Section 5 relates the two and shows
that financial market integration leads consumption risk sharing. In Section 6, we study the
welfare implications of our findings. Section 7 provides some robustness checks, and a final
section concludes.
2.
Data
Our main source for long-term asset return is the DMS (Dimson, Marsh, Staunton) global
returns data, kindly provided by Morningstar, which starts in 1900. We extend these returns
with data from the GFD (Global Financial Data) database and Datastream. We work at an
annual frequency and our combined sample covers the period from 1875 to 2012. The set of
countries in our sample is: Australia, Belgium, Canada, Denmark, France, Germany, Italy,
Japan, Netherlands, Norway, South Africa, Spain, Sweden, Switzerland, United Kingdom,
and United States.
The asset return data are the total nominal returns to the equity markets of the specific
countries. We also have T-bills and returns to long government bonds in our data set. Using
T-bills we can calculate excess returns on stock and bonds. We use these additional fixed
2Kose, Prasad, Rogoff & Wei (2009) conclude in their survey that “our critical reading of the recent
income return series to show that the results we derive using stock returns are robust.3
We use real consumption and real GDP data to measure the degree of consumption risk
sharing. We obtain these data from the Barro and Ursua dataset, at http://rbarro.com/
data-sets/ and update it to 2012 with Datastream.
An important contribution of our paper is its use of long-term data. One advantage of
a long dataset, as discussed in the Introduction, is that we get more episodes of increases
and decreases in integration and risk sharing and consequently more power in our tests. On
the other hand, one also needs to acknowledge that data extending back 140+ years for
many countries are not of the same high quality as, e.g., the Bretton Woods data that are
normally used in the related literature. For instance, data for some years might be based on
interpolations, and consumption data might be backed out from residuals, as described in
the Barro and Ursua files. We can do some robustness checks on this issue, though. Based
on the assumption that more recent data have higher quality, we run our main regressions
over different subsamples of the full 1875-2012 sample. We run the regressions over a sample
where we exclude the first 25 years, i.e. on a subsample from 1900-2012, and a sample where
we exclude the first 70 years, i.e. on a post-WWII 1945-2012 subsample. We describe the
results from these tests in more detail in Section 7, but already mention here that we find the same qualitative results as over the full sample period. We can also compare our
post-WWII data with the Penn World Tables (PWT) that start in 1960 (Feenstra et al., 2015).
We calculate the correlation between our GDP growth and PWT GDP growth country by
country, and likewise country-by-country correlations for consumption growth. We find that
all country-by-country correlations between our GDP and PWT GDP growth rates are above
0.5, and eight out of the twelve correlations are above 0.8. For consumption, nine our of the
twelve correlations are above 0.7. The average correlation across countries is 0.79 for GDP
3It would have been interesting to investigate price-earnings or price-dividend ratios across countries as
growth and 0.65 for consumption growth.4 In the end, acknowledging that historical data are
of a lower quality than modern-day data, it nevertheless seems that are our main conclusions
are reasonably robust.
2.1. Summary statistics
In Table 1, we provide an overview of the times series we use. For most of the countries, we have consumption and GDP data going back to 1875 (for all countries except Australia,
Belgium, and South Africa). For five countries (France, Germany, Spain, U.K., and U.S.),
we have stock return data going back to 1875, Australia starts in 1876, and for the remaining
countries, the stock return sample starts in 1900.
The average annual growth rates of real consumption and GDP are around two percent,
ranging from a low average consumption growth of 1.29% per year in Switzerland to a high
of 2.47% in Japan (for GDP: low 1.28% in South Africa and high 2.57% in Germany). The
standard deviations of GDP and consumption are around 3%-5%. Looking at returns, the
numbers are very different. Stock returns have yielded around 10% per year on average
from a low of 8.87% in Belgium to a high of 14.14% in Sweden. Returns are of course also
much more volatile than real consumption or GDP growth rates with return volatilities being
around 20%.
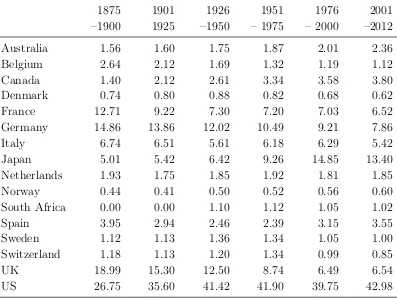
In order to provide further insights into the basic characteristics of our data, we show
the relative GDP weights (as a share of world GDP) of our sample countries over different
subsamples in Table2. The table shows how the economies of, in particular, France, Germany, and the UK have declined in relative size during our sample, whereas, in particular, Japan
and the US have gained in relative size over the last 140 years.
4For four countries, the correlations between our consumption growth series and the PWT consumption
3.
Time-variation in consumption risk sharing
The overall goal of our paper is to investigate how and if consumption risk sharing is influenced
by financial integration, how consumption risk sharing varies through time, and some of the
consequences of time-varying risk sharing. Consumption risk sharing means that idiosyncratic
shocks to consumption are diversified away and thus shared with other countries. In the
standard textbook setting with full financial integration, this implies that income growth of
a country should be uncorrelated with consumption growth of the country.
Obstfeld (1994) pioneered the approach of measuring consumption risk sharing by
re-gressing individual country consumption growth on world consumption growth or
world-income growth. Asdrubali, Sørensen, & Yosha (1996), Sørensen & Yosha (1998), Sørensen,
Yosha, Wu & Zhu (2007), and Kose, Prasad, & Terroes (2009) extend the approach of
Obstfeld, and show that the degree of consumption risk sharing can be estimated from a
regression of deviations of own-country consumption growth (∆ci,t) from world consumption
growth (∆ct) on deviations of own-country income growth (∆yi,t) from world income growth
(∆yt):
∆ci,t−∆ct=α+β(∆yi,t−∆yt) +εi,t. (1)
We measure world growth (consumption and income) as GDP-weighted averages across
countries, updating the GDP weights each year. A key point in Asdrubali, Sørensen, & Yosha
(1996) and Sørensen & Yosha (1998) is that theβ from this regression can be interpreted as a
measure of the degree of consumption risk sharing, as it quantifies the sensitivity of
idiosyn-cratic consumption growth to changes in idiosynidiosyn-cratic income growth. A lower β therefore
implies that idiosyncratic domestic consumption moves less with changes in idiosyncratic
income and implies a higher degree of consumption risk sharing. In particular, a β of zero
implies perfect consumption risk sharing, whereas a β of one implies no consumption risk
sharing at all.
time-series with estimates of the degrees of consumption risk sharing, we proceed as follows:
We estimate the above equation for each year in our sample, i.e. we conduct a cross-sectional
regression of consumption growth (as deviation from world consumption growth) on income
growth (as deviation from world income growth), using all countries in the sample with
available data. From this we obtain an estimate of the slope coefficient β for each year.
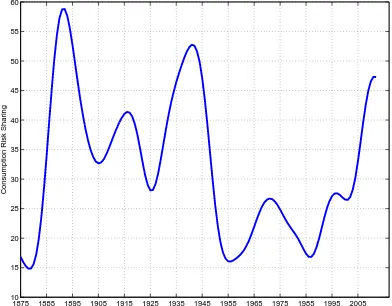
We plot the resulting time-series of estimates and use the transformation 100−100·βb
in Figure 1 so that higher levels imply more risk sharing. Moreover, to filter out noise and facilitate interpretation, we smooth the transformed estimates with a kernel regression.5
From Figure 1, we see that consumption risk sharing is increasing during the first 25-30 years of the sample, declines and reaches low values during the Bretton Woods, and finally
increases again during the last decades of the sample period. In terms of magnitudes, the
figure shows that consumption risk sharing was low during the very early part of our sample
and during Bretton Woods when less than 20% of idiosyncratic income growth was shared
internationally. On the other hand, risk sharing peaked around the turn of the previous
century, around the start of the second world war, and during the last decades of our sample,
when around 50% of movements in idiosyncratic income growth was diversified away.
Our sample covers more than 140 years, which is a long period of time. It includes several
severe shocks, such as financial and economic crises and wars that in addition affected some
countries more than others. It is relevant to investigate how robust our measures are to
controlling for such time fixed effects. Similarly, countries differ persistently with respect to
financial systems, where some systems are more bank oriented (e.g., continental Europe) and
others more market oriented (e.g., the US). In this regard, it is relevant to control for country
fixed effects. In Figure 2, we present results from estimations of Eq. (1) via successive panel regressions over rolling 15-years windows. We plot the resulting time-series of estimated β
-coefficients (shown as 100−100·βbto facilitate easy comparison with Figure 1) from panel
regressions where we include (i) time fixed effects only, (ii), country fixed effects only, and
(iii) country and time fixed effects. Even when we miss the first 15 years of data compared to
the procedure used to generate Figure1, we conclude that the overall pattern of consumption risk sharing seems reasonable robust to using these different fixed effects specifications: risk
sharing is increasing during the first years of the sample, declines during the interwar years,
declines during Bretton Woods, and increases during the last decades of the sample.
4.
Time-variation in international financial integration
We next turn to the question of how capital market integration varies over our sample period.
We use the level of comovement of returns across countries as our measure of market
integra-tion. This is a standard measure often used in the literature (Longin & Solnik, 1995; Quinn
& Voth, 2008), the idea being that markets behave more similarly when being integrated.
We calculate it as follows. For each year in our sample period, we compute the cross-country
dispersion of stock returns, Dispt+1 = var(Rt+1)0.5, where Rt+1 is a vector of stock returns
for all countries with available data. According to this measure, markets are more integrated
during periods in time where the dispersion in returns across countries is low. The measure
is model-free in the sense that it does not rely on an asset-pricing model or explicit
expo-sures to common factors. In Section 7, we present results for two other measures of market integration: one based on an asset-pricing model(world CAPM) and one purely statistical
based on exposure to common factors. Our results are robust to these alternative measures.
Finally, we note that Quinn & Voth (2008) show that return correlations are associated with
de jure capital account openness providing a further argument for this measure of market
integration.
4.1. Results
smooth the time-series via kernel regressions for ease of interpretation of the figure.6 We
show results for integration measures based on the subgroup of countries for which we have
stock return data throughout the full sample period (France, Germany, Spain, U.K., and
U.S.), i.e. since 1875, and based upon the full group of countries since 1900.
The main thing to notice from the graph is that it provides an overall intuitive picture:
Financial integration was very high during the period from 1875 until the beginning of the
first World War, after which financial integration strongly declines.7 Financial integration
stayed low between the two World Wars and during the Bretton Woods regime. Given the
capital controls that characterized the Bretton Woods regime, it makes intuitive sense that
financial integration was low during this period. Finally, we see that financial integration
has improved dramatically after the end of the Bretton Woods in the beginning of the 1970s,
as has also been reported elsewhere in the literature (e.g., Lane & Milesi-Ferretti, 2007).
During the last 10-15 years, the countries we look at here have been more highly integrated
financially. The overall picture painted by Figure 3 is thus that financial integration was high before World War I, stayed low until the 1970s, after which it increased rapidly. Today,
financial integration is estimated to be very high (relative to estimates for earlier periods).
Comparing Figures 1and 3, we find that periods of high financial integration tend to be related to periods of high consumption risk sharing. In particular, levels of capital market
integration and consumption risk sharing were both high during the first decades of the 20th
century, low during Bretton Woods, and increasing and high after Bretton Woods. However,
the turning points in the levels of integration and consumption risk sharing seem to be slightly
different: Financial integration started to drop after WWI and kept on falling until WWII,
whereas consumption risk sharing started to fall around WWII. Likewise, financial market
integration started to increase around the late 1970s whereas consumption risk sharing started
6Moreover, we also plot an unsmoothed version of the cross-sectional dispersion measure in the lower panel
of FigureA.1for comprarison.
7We note that integration started decreasing shortly after 1900 both if we look at the full sample of
to increase around the mid-1980s. In other words, eyeballing these smoothed time series of
integration and risk sharing, it seems that capital market integration and consumption risk
sharing are related, with integration leading risk sharing. In the next section, we provide
direct tests of such relations.
5.
Does financial integration lead consumption risk sharing?
In this section, we test whether financial integration leads consumption risk sharing. The
motivation is simple and based on standard textbook models: If financial markets are not
integrated, consumption risk sharing is hampered by the fact that agents cannot eliminate
idiosyncratic consumption shocks via trade in financial assets. Hence, financial market
inte-gration should facilitate consumption risk sharing and we test for this hypothesis in the data.
In addition, we expect that it may take some time for consumption risk sharing to increase
after a rise in financial market integration, i.e. that the real side of the economy reacts with
a lag to a change in the financial sphere of the economy. This seems plausible as agents need
to learn about, and adjust to, such a change.
5.1. Contemporaneous relations between integration and risk sharing
As a first step towards understanding the link between capital market integration and
con-sumption risk sharing, we look at the contemporaneous correlation of these two quantities.
We calculate contemporaneous correlations between integration and risk sharing for
overlap-ping windows of 1 year, 2 years, ...., 25 years. For correlations based on 2-year windows,
we calculate the correlation between the average levels of integration over two years and
average levels risk sharing over two years; for three-years windows, we calculate the
corre-lation between the average levels of integration over three years and average levels of risk
con-fidence intervals around the estimated correlations.8 The main take-away from the figure is
that the correlation is generally positive but that none of the correlations are significantly
different from zero. Hence, even if the point estimates of the correlations intuitively build
up with the horizons over which the correlations are measured, there seems to be no strong
contemporaneous relation between risk sharing and integration, regardless of the length of
the window used to compute the correlations. Hence, risk sharing and market integration
are positively correlated as expected but the contemporaneous link seems rather weak and is
not significantly different from zero.
5.2. Predictive regressions
Given our findings of a positive but insignificant positive correlation, we turn to an analysis
of potential lead-lag relations next. More formally, we run predictive regressions of future
measures of consumption risk sharing on current measures of financial market integration:
Risk sharingt+h =αh+γhMarket integrationt+1−k+εt+h. (2)
As the dependent variable, we use the average of our consumption risk measure from Eq. (1) over the following h years, with h being one, two, five, or ten years. We have overlapping
observations when h > 0, so we use Newey-West (1987) and Hodrick (1992) standard errors
when we calculate t-statistics. Ang & Bekaert (2007) find that the Hodrick (1992) standard
errors are well suited and reliable for predictive regressions with overlapping observations such
as the ones we present in this section. We regress the h-period average of our risk sharing
measure on the k-period (overk equal to one, two, five, and ten years) lagged average of our
integration measure.
In order to gauge the direction of impact, we also run the reverse regression, i.e.:
Market integrationt+h =αh+γhRisk sharingt+1−k+εt+h. (3)
We standardize the times series of integration and risk sharing in both regressions to
facilitate ease of interpretation. Moreover, it is important to note that we do not use the
kernel smoothed estimates of our risk sharing and market integration measures shown in
Figures 1 and 3 in these regressions but the unsmoothed estimates (shown as dashed lines in Figure A.1 in the Internet Appendix). The kernel smoothed series in Figures 1and 3are smoothed based on knowledge of the full sample and thus cannot be used in these predictive
regressions.9 We employ the raw estimates (h = 1, k = 1), or simple moving averages of
these estimates (h >1, k >1), instead so that we are only using information up to timet for
forecasting risk sharing or integration over future periods t+h. Moreover, these estimates
are not as persistent as Figures 1 and 3 might suggest (the first-order autocorrelations of the unsmoothed series are 20.5% for risk sharing and 34.7% for market integration) which is
relevant for interpreting the results from predictive regressions.
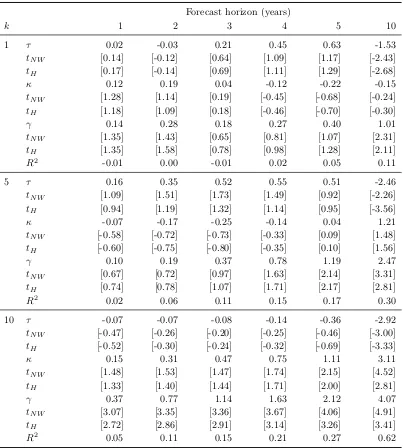
Results are clear-cut and reported in Table 3. Risk sharing is predictable by market integration, but there is no evidence that market integration is predictable by risk sharing.
In other words, after a rise in capital market integration we also see more consumption risk
sharing in the future, presumably because market integration facilitates risk sharing. This is
a central message of our paper.
Looking at the results in Table 3, we also find that it generally takes time before risk sharing increases after markets become more integrated. For instance, if simply regressing
next year’s risk sharing on this year’s level of integration, the relationship is insignificant with
a Newey-West t-statistic of 1.43 and an R2 of two percent. If instead relating the average
level of risk sharing over the following ten years to this year’s level of integration, we see a
significant relation (NW t-statistic equal to 2.65) and an R2 around ten percent. We also
notice that the sign is “right”, i.e. a higher level of financial market integration is followed by
a higher level of consumption risk sharing. Finally, the economic magnitude seems large as
a one standard deviation increase in integration leads to a 1.36 standard deviation increase
in risk sharing over the next ten years.
Our measure of financial market integration is clearly volatile, as it is based on annual
stock returns which are more more volatile than macroeconomic quantities such as
consumop-tion growth (as also seen by the summary statistics in Table 1). For this reason, we see an even clearer relation between financial integration and consumption risk sharing when we
smooth our measure of integration by using averages over the past one, two, five, or ten
years. Indeed, the average of the last ten years of financial integration predicts next year’s
level of risk sharing, with a NWt-statistic of 2.96 and anR2 of seven percent. Finally, we see
that the level of integration during the last decade strongly predicts the level of risk sharing
during this decade with an R2 of 24%. As above, we find sizeable economic effects with
coefficients ranging from 0.13 (k= 2, h= 1) to 2.08 (k = 10, h= 10).
It seems important to stress that no matter whether we measure integration or risk
sharing over one or several years, we do not find a significant relation between consumption
risk sharing and future levels of financial integration, as shown by the results in the right
panel of Table 3. Hence, we conclude that integration is followed by risk sharing but not the other way around.
5.3. Non-overlapping observations
As just discussed, Table 3 documents a relation between lagged levels of integration and current levels of risk sharing. Even when we use Hodrick (1992) standard errors that are
designed for situations as the ones we present above, in that they that address the issue
of overlapping observations, one nevertheless might still be concerned that the presence of
overlapping observations in Table 3 could influence the results we find. In order to make a perspective on this, we present in Figure 5 a scatter plot of the change in equity market integration over one decade and the change in consumption risk sharing over the next decade.
Hence, each dot in the figure represents a combination of a non-overlapping change in
inte-gration and subsequent change in risk sharing. The span of our sample period allows us to
0.57. This implies that increases (decreases) in capital market integration have been followed
by increases (decreases) in risk sharing.
5.4. Trade openness, exchange rate flexibility, and consumption risk sharing
We have shown that capital market integration leads consumption risk sharing. Over the
long sample period used in this paper, equity market integration was not been only thing
that changed. Hence, one might wonder whether other factors have influenced risk sharing
in addition to the influence of changes in capital market integration. In this section, we
investigate two channels that have been high-lighted in the literature: trade openness and
exchange rate flexibility.
Trade openness. Prasad, Rogoff & Wei (2009) argue that trade openness and financial
integration both matter jointly for risk sharing, and verify this for emerging markets
through-out the last couple of decades. Our sample is based on developed markets over a long sample
period, but it still seems interesting to investigate whether including trade openness (as a
measure of integration in the real economy) has helped foster risk sharing.
To do so, we compute trade openness as the sum of exports and imports relative to
GDP for all 16 countries in our sample. The data on imports and exports are from the GFD
and start in 1900. We use GDP weights to calculate an overall measure of trade openness.
The upper panel of Figure 6 shows a plot of the log of this measure. As can be seen, there has been a strong upward trend in trade openness since WWII. Trade openness is also very
persistent. Compared to our measures of risk sharing and market integration (which have
first-order autocorrelations of 20-35% as noted above), the trade openness time series has
an autocorrelation of 99% and is clearly non-stationary, even over this long sample period.
Exchange rate flexibility. Cole & Obstfeld (1991) highlighted the potential important
influence of relative price movements for risk sharing. Cole & Obstfeld (1991) showed that
changes in terms of trade could pool national output risks and thereby provide risk sharing
through other channels than market or trade integration.10
We capture movements in relative prices via movements in exchange rates (we do not have
data for terms of trade). We compute the cross-sectional volatility of exchange rate changes.
This is similar to our integration measure for equities based on cross-sectional dispersion and
has a similar interpretation. The lower panel of Figure 6 shows the time series movements in exchange rate volatility (along with averages for different subsamples as horizontal lines).
We see that there was very little exchange rate variability during the Gold Standard before
WWI, exchange rate variability between WWI and WWI, low exchange rate variability during
Bretton Woods, and more exchange rate variability after the breakdown of Bretton Woods.
Hence, this measure captures intuitive differences in exchange rate volatilities during periods
of floating and fixed exchange rates.
To investigate whether trade openness and exchange rate flexibility matter for risk
shar-ing, we run the following regression:
Risk sharingt+h =αh+τh∆Trade opennesst+1−k+κh∆FX⊥t+1−k+γhMarket integration⊥t+1−k+εt+h
where ∆ FX is exchange rate volatility. This is similar to the regression underlying Table 3
but additionally includes changes in trade openness, orthogonalized exchange rate volatility,
and orthogonalized market integration. In our orthogonalization, we want to give trade
openness and exchange rate flexibility maximum influence in order to be conservative. We
therefore orthogonalize as follows: We first regress ∆ FX volatility on ∆ Trade openness and
save the residual. We then regress capital market integration on ∆ Trade openness and the
∆ FX residual and save the new residual. This implies that we use trade openness itself,
10Cole & Obstfeld (1991), p. 5, wrote: “... for certain parameter choices terms-of-trade responses alone
the part of FX volatility that is uncorrelated with trade openness, and the part of market
integration that is uncorrelated with trade openness and FX volatility.
We again investigate several forecast horizons (h) and form (moving) averages of our
predictors over the previous k years to capture lower frequency movements in integration
and risk sharing. Table 4reports the results. The table shows that market integration seems to be more important for risk sharing than trade integration and exchange rate flexibility.
This is clearly apparent when looking at the results for k = 10 where market integration is
strongly significant for any forecast horizon whereas trade integration and FX flexibility are
only significant for long forecast horizons, and trade openness even has a counterintuitive sign
(higher levels of trade integration implying lower levels of risk sharing). For lower levels of
k, market integration is significant for longer forecast horizons, but not for shorter horizons,
trade integration has the “wrong” sign when significant, and FX flexibility is not significant
at all fork = 5 or 10. These results imply that risk sharing is positively influenced by lagged
financial integration, but not much by real integration (trade integration) or exchange rate
flexibility. This result seems quite interesting due to the fact that we use that part of market
integration that is uncorrelated with trade openness and exchange rate flexibility.
Figures 1, 3 and 6 show that trade openness, capital market integration, exchange rate flexibility, and risk sharing all start increasing significantly after the mid-1970s. Hence, it
seems likely that results for the post-Bretton Woods period might differ from results based
on the total sample period. Table 5 shows results for the 1974-2012 sample. We see that trade integration plays a more important role for risk sharing during this period, and an even
more important role than market integration when forecasting over shorter horizons. When
forecasting risk sharing over longer horizons, market integration still plays a role, whereas FX
flexibility generally does not (FX volatility is sometimes significant when using Newey-West
t-statistics but not when using Hodrick statistics).
We conclude from the tests in Tables 4and5that market integration is closely related to future risk sharing and more so than trade integration and exchange rate flexibility. For the
in consumption risk sharing we have seen. Exchange rate flexibility seems to be unrelated to
changes in risk sharing.
5.4.1 Permanent and transitory shocks
Artis & Hoffmann (2008) show that the volatility of short-term (business cycle) shocks to
output has decreased by more than the volatility of permanent shocks to output during the
1980-2000 period. Based on the permanent income hypothesis, they show that consumption
theoretically should react more to permanent shocks, and document empirically that
con-sumption risk sharing has increased more than commonly perceived in the literature during
the 1980-2000 period. They find that financial integration has fostered this increase in risk
sharing. We follow Artis & Hoffmann (2008) and decompose GDP country by country into
a transitory and a permanent component.11 Then we calculate our measure of risk sharing,
based on Eq. (1), using, respectively, the transitory part of GDP and the permanent part of GDP as the right-hand side variable. Finally, we run our predictive regressions of risk sharing
on market integration using, respectively, risk sharing of transitory shocks and risk sharing
of permanent shocks as the dependent variables. We show the results for these regressions
in Tables 6 and 7. We find that market integration is positively related to risk sharing of both transitory and permanent shocks on the long horizon. Additionally, we find that trade
integration is important for the sharing of permanent shocks, but not of transitory shocks.
This indicates that part of the reason why trade integration does not seem to matter much
in Table 4is that shocks to both the transitory and permanent component of GDP are con-sidered jointly in these regressions; if separating out permanent shocks, as in Tables 6 and
7,the role of trade integration for risk sharing becomes clearer.
11We refer to Artis & Hoffmann (2008) for details on the construction of the permanent and transitory
5.4.2 Panel-regression results for importance of trade integration, exchange rate
flexibility, and financial crises
We have country-by-country measures of trade integration and exchange rate flexibility. We
follow Sørensen et al. (2007) and run panel regressions of consumption growth in a given
country on GDP growth in the same country like in Section 3, but we now include additional regressors to control for trade integration and exchange rate flexibility. Moreover, we interact
GDP growth with trade integration and exchange rate flexibility, respectively. This panel
regression provides us with further evidence on how risk sharing has evolved over time and has
the additional advantage that it does not use overlapping observations and is more directly
related to procedures otherwise used in the literature by, e.g., Sørensen et al. (2007).
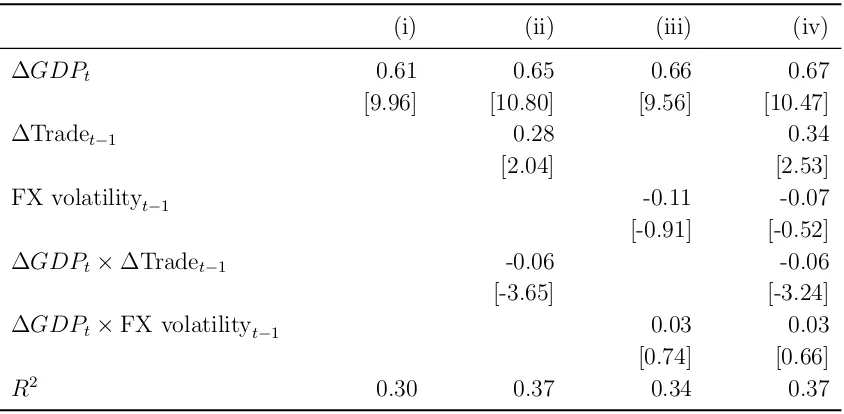
We show the results from this regression in Table 8. The panel regressions include both country and time fixed effects and we employ two-way clustered standard errors (clustered by
country and year). We find an unconditional average degree of risk sharing across all countries
and all time periods of 0.39 (1−0.61, see Table 8). We also find that risk sharing is higher during periods where trade integration is higher; a negative slope on the interaction term
∆GDPt×∆ Tradet−1means that more trade openness lowers the coefficient on ∆GDPt, which
in turn implies that own-country GDP growth matters less for own-country consumption
growth. Hence, we find higher risk sharing during periods of higher trade integration. Finally,
we find no relation between exchange rate flexibility and risk sharing in these regressions.
The role of financial crises. Using a similar panel regression set-up, we can investigate
whether risk sharing varies over time with the severity of financial crises. Reinhart & Rogoff
(2009) identify episodes of local crises, meaning the occurrence of currency, inflation, debt
(external or internal), banking, or other crises in a country. Their variable ranges from
0 (no crisis) to 6 (all of these crises occur simultaneously in a country) for every country
and every year. We include this variable in our panel regression and interact it with GDP
country-specific crisis indicators, and its interaction with GDP growth. The results from this
regression are in Table 9. We find that the interaction terms with global crises is significant, implying that risk sharing is time-varying and higher during periods of global crises. The
overall level of risk sharing does not depend on local crises.
Our finding that risk sharing is counter-cyclical, i.e. higher during crisis, differs from
findings in, e.g., Hoffmann and Sherbakova-Stewen (2011) and Storesletten et al. (2004) who
find risk sharing to be lower during economic downturns. There are a couple of possible
ex-planations. First, we look at international data and global crises whereas other authors often
look at domestic crises (Storesletten et al., 2004 investigate U.S. micro data and Hoffmann
and Sherbakova-Stewen, 2011 investigate U.S. states). Second, given our findings in Section
5.4.1, the result might simply reflect that there is little idiosyncratic risk to share during crises, implying that risk sharing appears high. One explanation could be that the fraction of
GDP variance that is insurable declines, making risk sharing appear higher in the regressions
than it actually is.
6.
Consequences of time-varying consumption risk sharing
So far, we have demonstrated that there is a considerable degree of time-variation in
inter-national consumption risk sharing and that risk sharing depends on lagged capital market
integration. One implication of time-varying risk sharing is that the costs of imperfect
insur-ance against consumption fluctuations will also vary through time (Lucas, 1985). We analyze
this in this section and quantify the consequences of imperfect risk sharing.
Perfect risk sharing means eliminating idiosyncratic shocks to consumption. All else
equal, imperfect risk sharing thus implies higher variance of consumption growth which lowers
utility of a risk-averse consumer compared to a situation of perfect risk sharing. In this
section, we illustrate the benefits (in welfare terms) of international risk sharing, and, in
We measure the welfare gain from international risk sharing based on the following
rea-soning: If risks are perfectly shared (and preferences are the same, etc.), consumption growth
rates of different countries should move in lockstep. The consumption uncertainty consumers
face in this situation is the risk of fluctuations in world consumption, i.e. the variance of
world consumption. On the other hand, when there is no risk sharing, consumption growth
will be more driven by GDP growth in individual countries. The risk the consumer in each
country faces in this situation is the volatility of individual consumption growth. The
differ-ence between the volatility of world consumption and the average of volatilities of individual
countries’ consumption is the gain from consumption risk sharing.
We follow Lucas (1985, 2003) and assume that consumers have CRRA preferences over
consumption
Ut=
(1 +Ct)1−θ
1−θ (4)
whereCtis annual consumption andθ is the coefficient of relative risk aversion. We calculate
the welfare gain from switching to perfect consumption risk sharing as the difference in
utilities between consuming world consumption and consuming actual levels of consumption
in the individual countries. Specifically, the two levels of utility are calculated as (i) the utility
from consuming world consumption which is the GDP-weighted average of consumption in
the individual countries (call this level of utility U(Cperfectly shared)) and (ii) the utilities from
consuming own-country consumption. These own-country consumption utilities are then
combined using GDP-weights (call this level of utility U(Cnon-perfectly shared)). The resulting
gain in utility is calculated as:
1
T
T X
t=1
U(Cnon-perfectly shared))− 1
T
T X
t=1
U(Cperfectly shared)).
We use 10 years to calculate the average utilities, and we let the calculations roll through
the sample. We note that average utility takes risk into account due to the concavity of the
utility function.
risk aversion parameter; θ = 4 and θ = 10. We find that there are large swings in welfare
costs. For example, the spike of −6.5% in 1955 (for θ = 10) means the representative
consumer would have been willing to give up 6.5% of consumption to eliminate idiosyncratic
consumption volatility in 1955. Figure 7 shows that there is time-variation in the amount of consumption the consumer in the non-integrated world is willing to give up in order to avoid
idiosyncratic consumption fluctuations.
In particular, the utility cost of imperfect risk sharing is very large around WWII, and has
been declining more or less continuously since then in line with increased market integration
and risk sharing over the same time period. Throughout the last couple of decades, the
difference is very small indicating that there is no big difference in the amount of consumption
that consumers are willing to give up compared to what consumers in a world of perfect risk
sharing would give up. In other words, consumption risk sharing today is so high that further
improvements will not lead to large welfare gains anymore (as judged by our metric).
We can also comment on the economic magnitudes of the effects. During the first half
of our sample period, for example, the difference between the two certainty-equivalents in
Figure 7 is approximately −1.10% for θ = 4 and −1.99% for θ = 10. In the second half of our sample, these numbers increase to -1.03% and -1.60% respectively, and for a very
recent sample from 1991 - 2012, these numbers are almost zero at -0.30% (θ = 4) and -0.49%
(θ = 10). Hence, higher integration has brought considerable welfare gains and it thus seems
relevant to understand which factors drive risk sharing. Looking at the time-variation in
Figure 7, the time-series fluctuations in utility losses seem to line up reasonably well with fluctuations over time in consumption risk sharing, as documented in earlier parts of the
paper. Hence, the degree of consumption risk sharing has significant welfare implications
and periods of time with low risk sharing are also times with significant welfare costs. This
underscores the main theme of this paper: consumption risk sharing matters and it seems
important to understand the drivers of consumption risk sharing. As shown above, market
7.
Additional results and robustness
In this section, we present additional results and run some robustness checks on earlier results.
We provide further robustness results in the Internet Appendix to our paper.
A CAPM measure of integration and sub-samples. We calculated a second measure
of market integration based on a world-CAPM, i.e. a model where assets are priced according
to their exposures to the world market portfolio. We are interested in the dispersion of the
idiosyncratic part of countries’ returns, the point being that the more integrated countries
are, the lower is the cross-country dispersion of idiosyncratic risk. To find the cross-country
dispersion of idiosyncratic risk, we proceed as follows. We estimate a world-CAPM time-series
regression (over the full sample period) for each of the 16 countries, i.e. we regress the return
of a country on the return on the world-market portfolio. We save the residual time-series for
each country and take the absolute values. We then have 16 time-series of absolute residuals.
For each year, we take the GDP-weighted cross-country average of idiosyncratic volatilities,
so that we have one time-series from 1875 to 2012 of “average idiosyncratic volatility”. Panel
(a) of Figure A.2shows a time-series plot of this measure.
We then run the same predictive regressions as in Table 3 but using the CAPM-based measure of integration. We report results in TableA.Iin the Internet Appendix and find that the basic result from above is unaffected: There is strong statistical evidence that integration
leads risk sharing; perhaps not when we set k = 1 and h = 1, but when we smooth out
fluctuations in the level of integration, by using its average over several years and predict
future risk sharing, or if we predict the average of the next several years of risk sharing. And,
as above, there is no effect from risk sharing to future integration. Hence, our predictability
results are robust towards using a model-free measure of financial integration, as in Table 3, or a CAPM-measure, as in Table A.I .
Figure 3). During this part of our sample, we only have data for few countries (France, Germany, Spain, U.K., and U.S.), though. In order to judge whether our result that financial
integration leads risk sharing is driven by these early years with few countries, we present in
Table A.II results from two subsample regressions: one for the 1900-2012 period and one for the 1946-2012 period. TableA.II reveals that our results do not depend on the early periods, as we find that financial integration leads consumption risk sharing also when excluding
early subsamples. For instance, if focusing on the 1946-2012 period, we find that the average
degree of financial integration during a decade significantly predicts the average degree of
consumption risk sharing during the following decade with an R2 of twenty percent.
A common-factors measure of market integration. So far, we have presented results
using two measures of financial integration. Pukthuanthong & Roll (2009) advocate a third
measure, and we checked our results using that measure. Pukthuanthong & Roll (2009)
suggest to measure financial integration by the proportion of a country’s returns that can be
explained by common, global factors. We have annual data (Pukthuanthong & Roll, 2009
use daily data), so we proceed as follows. We use rolling windows of 25 years to compute the
covariance matrix CVt−24;t of stock returns for a given 25-year window. Next, we factorize
the covariance matrix CVt−24;t= Φt−24;tΛt−24;tΦ0t−24;t of stock returns and select the number
of factors based on the largest eigenvalues and such that the common factors account for
at least 80% of return (co-) variances. This usually requires two or three factors. Finally,
we form common factor portfolios Φt−24;tR0t−24;t based on the eigenvectors (Φt−25;t) of the
covariance decomposition. We then regress the stock returns of individual countries on these
common factor returns and compute the R2 for each country. We take the average of these
R2s to find the overall measure of integration at each point in time. We call this measure
the “Importance of common factors” and plot it in Panel (b) of Figure A.2 in the Internet Appendix. Using this measure of integration, we find that financial integration has increased
sharply since the breakdown of the Bretton Woods, and reach historically high levels during
the last years of our sample. We also find that the degree of financial integration declined
(when using France, Germany, Spain, U.K., and U.S.). Hence, we conclude that even if the
message provided by Figure A.2 is perhaps not as clear as the message provided by Figure
3 – due to the rolling window of estimation – the conclusions regarding periods of financial integration is to a large extent robust in qualitative terms.12
Additional robustness on predictive regressions. Next, we also look at measures of
financial integration based on excess returns (stock returns minus the risk-free rate) and
government bonds and T-bills instead of using simple stock returns to measure financial
integration. We report these regressions in the Internet Appendix in Tables A.IIIand A.IV, respectively, and find that they corroborate our earlier results: Market integration over the
past decade positively forecasts consumption in the future, but not the other way around. Our
results, thus, are not sensitive to the kinds of returns we use to measure financial integration.
We also run an additional robustness check related to the predictive regression results
and add a lag of the dependent variables. We do so because using larger values of k (the
period over which we measure consumption risk sharing) leads to an increasingly persistent
dependent variable by construction. Hence, this is an additional check on the influence of
persistent variables on our results (additional to the different sets of standard errors that we
in the tables above use to deal with this persistence). Table A.V in the Internet Appendix reports results for this exercise and we again find that our results are robust in the sense that
equity market integration leads risk sharing.
Asymmetric effects. We also investigated whether there are asymmetric effects in the
relation between integration and risk sharing, i.e. whether risk sharing mainly changes when
integration goes, e.g., up (or down). We have investigated this in different ways, for instance,
interacting our integration measure with a dummy being equal to 1 if integration increases.
The overall conclusion from these tests is that there are no significant asymmetric effects.
This means that risk sharing responds to changes in integration, both when integration goes
12We do not run predictive regressions of risk sharing on this measure of integration as this measure is
up and down, and there are no differences depending on whether integration increases or
decreases.
Obstfeld (1994) measure of risk sharing. We use the measure of consumption risk
sharing developed and used by Asdrubali, Sørensen, & Yosha (1996), Sørensen & Yosha
(1998), Sørensen, Wu, Yosha & Zhu (2007), and Kose, Prasad, & Terroes (2009). There
is an alternative, closely related measure used in Obstfeld (1994) and Lewis (1999), where
consumption risk sharing is measured via a regression of own-country consumption growth
on own-country income growth ∆ci,t =α+β∆yi,t+εi,t instead of using deviations from world
growth. As a robustness test, we also used this measure and find results very similar to those
reported here. This finding makes sense as we are using cross-sectional regressions and theα
in this regressions ensures that all variables are cross-sectionally demeaned. This is similar
to using our measure in the main text that subtracts GDP-weighted global growth rates.
All in all, over the last 140 years, we find strong and robust evidence that financial
market integration has led to higher degrees of consumption risk sharing after a couple of
years.
8.
Conclusion
We investigate time-variation in capital market integration and consumption risk sharing
over a period of almost 140 years, from 1875 through 2012. We first document considerable
variation over time in consumption risk sharing and financial integration in stock markets.
We find periods of very high risk sharing and integration, such as in the beginning of the
sample period and at the very end of the sample period, and periods of low risk sharing
and integration, such as periods surrounding WWII and during the Bretton Woods period.
By exploiting variation over time, we document that there indeed is a clear-cut relation
between capital market integration and risk sharing in the sense that higher financial market
way around. Hence, financial markets do indeed seem to deliver on one of their most basic
functions, namely propagating risk sharing among agents. Finally, we calculate variation over
time in the costs of having less than fully integrated capital markets. We find substantial
fluctuations in these utility costs, with the periods surrounding WWII generating a high cost
References
[1] Ang, Andrew, Geert Bekaert, 2007. Stock Return Predictability: Is it there? Review of Financial Studies 20, 651–707.
[2] Artis, Michael J., Mathias Hoffmann, 2008. Financial Globalization, International Busi-ness Cycles and Consumption Risk Sharing. Scandinavian Journal of Economics 110, 447–471.
[3] Asdrubali, Pierfederico, Sørensen, Bent E., Yosha, Oved, 1996. Channels of interstate risk sharing: United States 1963–90. Quarterly Journal of Economics 111, 1081–1110.
[4] Bai, Yan, Zhang, Jing, 2012. Financial integration and international risk sharing.Journal of International Economics 86, 17–32.
[5] Barro, Robert J. and Jos´e F. Urs´ua, 2008. Macroeconomic crisis since 1870. Brookings Papers on Economic Activity Spring 2008, 255–335.
[6] Bekaert, Geert, Harvey, Campbell, Lundblad, Christian, 2005. Does financial liberaliza-tion spur economic growth. Journal of Financial Economics 77, 3–55.
[7] Bekaert, Geert, Harvey, Campbell, Lundblad, Christian, Siegel, Stephan, 2007. Global growth opportunities and market integration. Journal of Finance 62, 1081–1137.
[8] Bekaert, Geert, Harvey, Campbell, Lundblad, Christian, Siegel, Stephan, 2013. The Eu-ropean Union, the Euro, and Equity Market Integration.Journal of Financial Economics
109, 583–603.
[9] Cole, H. L., and Maurice Obstfeld, 1991. Commodity Trade and International Risk Sharing: How Much Do Financial Markets Matter? Journal of Monetary Economics 28, 3–24.
[10] Feenstra, Robert C., Robert Inklaar, and Marcel P. Timmer, 2015. The Next Generation of the Penn World Table. Forthcoming American Economic Review.
[11] Hodrick, Robert, 1992. Dividend Yields and Expected Stock Returns: Alternative Pro-cedures for Inference and Measurement. Review of Financial Studies 5, 357-386.
[13] Kalemli-Ozcan, Sebnem, Elias Papaioannou, Fabrizio Perri, 2013. Global Banks and Crisis Transmission. Journal of International Economics 89, 495–510.
[14] Kalemli-Ozcan, Sebnem, Elias Papaioannou, Jose-Luis Peydro, 2013. Financial Regula-tion, Financial GlobalizaRegula-tion, and the Synchronization of Economic Activity.Journal of Finance 68, 1179–228.
[15] Kose, M. Ayhan, Prasad, Eswar, Rogoff, Kenneth, Wei, Shang-Jin, 2009. Financial Globalization: A Reappraisal. IMF Staff Papers, 8-62.
[16] Kose, M. Ayhan, Prasad, Eswar, Terroes, Marco, 2009. Does financial globalization promote risk sharing? Journal of Development Economics 2009, 258-270.
[17] Lane, Philip R., Milesi-Ferretti, Gian Maria, 2007. The external wealth of nations mark II: Revised and extended estimates of foreign assets and liabilities, 1970–2004. Journal of International Economics 73, 223-250.
[18] Lewis, Karen K., 1995. Puzzles in International Financial Markets. In: G. Grossman and K. Rogoff (Eds.), Handbook of International Economics. North Holland: Amsterdam.
[19] Lewis, Karen K., 1996. What can explain the apparent lack of international consumption risksharing? Journal of Political Economy 104 (2), 267–297.
[20] Lewis, Karen K., 1999. Trying to explain home bias in equities and consumption.Journal of Economic Literature 37, 571–608.
[21] Longin, F., Solnik, Bruno, 1995. Is the Correlation in International Equity Returns Constant: 1960-1990? Journal of International Money and Finance 14, 3–26.
[22] Longin, F., Solnik, Bruno, 2001. Extreme Correlation of International Equity Markets
Journal of Finance 56, 649–676.
[23] Lucas, Robert E., 1985. Models of Business Cycles. Basil Blackwell.
[24] Lucas, Robert E., 2003. Macroeconomic Priorities.American Economic Review 93, 1–14.
[25] Newey, Whitney K, West, Kenneth D, 1987. A Simple, Positive Semi-definite, Het-eroskedasticity and Autocorrelation Consistent Covariance Matrix. Econometrica 55, 703–708
[27] Obstfeld, Maurice, Rogoff, Kenneth S., 1996. Foundations of International Macroeco-nomics. MIT Press.
[28] Obstfeld, Maurice, Taylor, Alan M., 2004. Global Capital Markets: Integration, Crisis, and Growth. Cambridge University Press.
[29] Reinhart, Carmen M., and Kenneth S. Rogoff, 2009. This Time Is Different: Eight Centuries of Financial Folly. Princeton, New Jersey: Princeton University Press.
[30] Pukthuanthong, Kuntara, Roll, Richard, 2009. Global market integration: An alterna-tive measure and its application. Journal of Financial Economics 94, 214–232.
[31] Quinn, Dennis, Voth, Hans-Joachim, 2008. A Century of Global Equity Market Corre-lations. American Economic Review. Papers and Proceedings 98, 535–40.
[32] Schularick, Moritz, Steger, Thomas M., 2010. Financial Integration, Investment, and Economic Growth. Evidence From Two Eras of Financial Globalization. Review of Eco-nomics and Statistics 92, 756–768. Forthcoming.
[33] Sørensen, Bent E., Yosha, Oved, 1998. International risk sharing and European monetary unification. Journal of International Economics 45, 211–238.
[34] Sørensen, Bent E., Yosha, Oved, Østergaard, Charlotte, 2002. Consumption and Aggre-gate Constraints: Evidence from US States and Canadian Provinces.Journal of Political Economy 110, 634–645.
[35] Sørensen, Bent E., Yosha, Oved, Wu, Yi-Tsung, Zhu, Yu, 2007. Home bias and inter-national risk sharing: twin puzzles separated at birth. Journal of International Money and Finance 26 (4), 587–605.
[36] Stiglitz, Joseph E., 2000. Capital Market Liberalization, Economic Growth, and Insta-bility. World Development 28, 1075–1086.
[37] Storesletten, Kjetil, Chris I. Telmer, Amir Yaron, 2004. Cyclical Dynamics in Idiosyn-cratic Labor Market Risk. Journal of Political Economy 112, 695-717.