City, University of London Institutional Repository
Citation
:
Lee, S. (2016). REITs and the Taper Tantrum. Journal of Property Investment and Finance, 34(5), pp. 457-464. doi: 10.1108/JPIF-03-2016-0020This is the accepted version of the paper.
This version of the publication may differ from the final published
version.
Permanent repository link:
http://openaccess.city.ac.uk/15684/Link to published version
:
http://dx.doi.org/10.1108/JPIF-03-2016-0020Copyright and reuse:
City Research Online aims to make research
outputs of City, University of London available to a wider audience.
Copyright and Moral Rights remain with the author(s) and/or copyright
holders. URLs from City Research Online may be freely distributed and
linked to.
City Research Online: http://openaccess.city.ac.uk/ [email protected]
REITs and the Taper Tantrum
By
Stephen L. Lee
Faculty of Finance Cass Business School City of London University
106 Bunhill Row London EC1Y 8TZ
England
Phone: +44 (0) 207 040 5257, Fax: +44 (0) 207 040 8880, E-mail: [email protected]
Purpose - The purpose of this paper study is to empirically examine the effect on US Stock, Bond and Real Estate Investment Trust (REIT) prices triggered by the US Federal Reserve Chairman Ben Bernanke’s announcement of a possible intent to unwind, or taper, Quantitative Easing (QE). In particular, we assess whether the effect of the ‘Taper Tantrum’ was fundamental or financial on financial markets.
Design/methodology/approach - The methodology used to determine whether the effect of the ‘Taper Tantrum’ was fundamental or purely financial is that suggested by French and Roll (1986) as extended by Tuluca et al. (2003). The analysis is based on daily data for large cap stocks, small cap stocks, long-term bonds and REITs for 18 months before Ben Bernanke’s announcement and for 18 months after the announcement.
Findings – The results show that the ‘Taper Tantrum’ had a fundamental, rather than a financial effect on all asset classes, especially so for REITs.
Practical Implications - We also find that in the post-taper period following Ben Bernanke’s announcement the correlation of REITs with Stocks decreased compared with pre-taper period, whereas the correlation of REITS with Bonds increased substantially. In other words, the ‘Taper Tantrum’ had a profound effect on the risk/return benefits of including REITs in the US mixed-asset portfolio.
Originality/value - This is the first paper to examine the effect of the ‘Taper Tantrum’ on REITs.
Keywords:Taper Tantrum, Stocks, Bonds, REITs, Fundamental or Financial impacts, Daily and Monthly Data
Page 1
REITs and the Taper Tantrum
Introduction
Following the Global Financial Crisis the Federal Open Market Committee (FOMC) in the US has been using bond purchases since November 2008, so called quantitative easing (QE), to reduce long-term interest rates to support housing markets, employment, and real activity. Following positive economic news in the spring of 2013 however the Federal Reserve Chairman Ben Bernanke testified to Congress on 22nd May 2013 that the Fed would likely start tapering QE, by slowing the pace of its bond purchases later in the year, conditional on continuing good economic news.
[image:3.612.135.478.375.601.2]Ben Bernanke’s announcement lead to what has been called the ‘Taper Tantrum’ with US large cap stocks, small cap stocks and bonds falling 0.83%, 1.67% and 0.29%, respectively on the 22nd May 2013 (see Table 1). Stock and Bond markets however recovered very quickly as investors realized there was no need for a massive panic (see Figure 1). In contrast, Real Estate Investment Trusts (REITs) not only showed much bigger losses on the day of the announcement (2.57%) but continued to decline for the rest of the year.
Figure 1: Stocks, Bonds and REITs Indexes: 31st December 2012 to 31st December 2013
Importantly, the volatility of daily REIT returns rose following Ben Bernanke’s announcement, whereas the daily volatility of Stocks and Bonds fell (see Table 2). The increase in volatility of REIT prices may reflect changes in the fundamental economic determinants such as; expected earnings, interest rates, real growth and inflation. Alternatively, the increase in volatility may simply reflect the effects of increased uncertainty in the market. In order, to sort out whether the effect of the ‘Taper Tantrum’ had a fundamental or purely financial impact on US financial markets we compare
pre-90 95 100 105 110 115 120 125 130 135 140
31-Dec-12 28-Feb-13 30-Apr-13 30-Jun-13 31-Aug-13 31-Oct-13 31-Dec-13
22ndMay 2013
Taper Talks
S&P 500 Russell 2000
Barclays Aggregate Bond Index
SNL
Equity REITs Price Index
taper and post-taper period volatilities of US Stocks, Bonds and REITs using an approach suggested by French and Roll (1986), as extended by Tuluca et al (2003).
In general, we find evidence that Ben Bernanke’s announcement had a fundamental effect, rather than a financial effect, on US Stocks and Bonds but especially so for REITs. We also find that the correlation of REITs with the Stocks decreased but increased substantially with Bonds following Ben Bernanke’s announcement compared with the pre-taper period. As a consequence, the risk/return benefits from adding REITs to the US mixed-asset portfolio have changed since May 2103.
The remainder of the paper is organised as follows. The next section describes the data used in this study, while the following section tests whether the effect of the ‘Taper Tantrum’ on US Stocks, Bonds and REITs was fundamental or financial. Section 4 then discusses the impact of the results on the benefits of add REITs to the mixed-asset portfolio. The last section concludes the study.
Data
Our empirical investigation uses price indexes for large cap stocks, small cap stocks, long-term bonds and REITs for 18 months before Ben Bernanke’s announcement and for 18 months after the announcement, i.e. we use daily price indexes from 2nd January 2011 to 9th October 2014. Bank holidays are excluded. This gives us 346 daily returns and 18 monthly returns before and after the 22nd May 2013.
To represent the performance of large cap and small cap stocks we use the S&P 500 and the Russell 2000 indexes, respectively. The S&P 500 is one of the most commonly used benchmarks for the overall US stock market and is meant to reflect the risk/return characteristics of the large cap universe. The Russell 2000 Index accounts for about 10% of the total market capitalization of the Russell 3000 Index and is constructed to provide a comprehensive and unbiased small-cap barometer.
The bond data is represented by the Barclays US Aggregate Bond Index (AGG), formerly the Lehman Aggregate Bond Index, and provides a measure of the performance of the US investment grades bonds. The securities in the index must have at least one year remaining to maturity, denominated in U.S. dollars and must be fixed rate, nonconvertible and taxable. Consequently, the index is the benchmark for long-term US bond investors and for many US index funds.
The REIT market is represented by the SNL Equity REIT index. We also examined 8 REIT sectors: Healthcare REITs; Hotel REITs; Industrial REITs; Diversified/Other REITs; Office REITs; Retail REITs; Residential REITs; Self-storage REITs. The REIT data is from SNL database1, the stock market data obtained from Yahoo Finance, while
1 We used the SNL REIT data as it provides daily data on 8 REIT sectors in addition to the overall Equity
Page 3
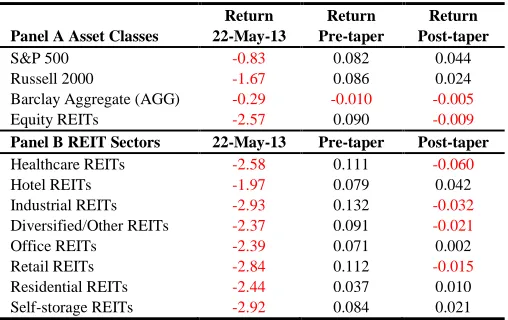
[image:5.612.180.434.133.293.2]the Bond data was collected from Datastream. Summary statistics for the daily returns are shown in Table 1.
Table 1: Summary Statistics
Return Return Return Panel A Asset Classes 22-May-13 Pre-taper Post-taper
S&P 500 -0.83 0.082 0.044 Russell 2000 -1.67 0.086 0.024 Barclay Aggregate (AGG) -0.29 -0.010 -0.005 Equity REITs -2.57 0.090 -0.009
Panel B REIT Sectors 22-May-13 Pre-taper Post-taper
Healthcare REITs -2.58 0.111 -0.060 Hotel REITs -1.97 0.079 0.042 Industrial REITs -2.93 0.132 -0.032 Diversified/Other REITs -2.37 0.091 -0.021 Office REITs -2.39 0.071 0.002 Retail REITs -2.84 0.112 -0.015 Residential REITs -2.44 0.037 0.010 Self-storage REITs -2.92 0.084 0.021
Panel A of Table 1 shows that all financial markets displayed negative returns on the day of the ‘Taper Talks’ (22nd May 2013). The biggest decline was in Equity REITs and the least in the S&P 500. Panel B of Table 1 shows that in the REIT sectors the biggest decline was in Industrial REITs and least in Hotel REITs.
We also compared the average daily returns in the pre-taper period (3rd January 2011 to 21st May 2013) to those in the post-taper period (23rd May 2013 to 9th October 2014). Panel A of Table 1 shows that in the pre-taper period the best returns were achieved in Equity REITs and the least in Bonds. In contrast, in the post-taper period Equity REITs displayed the worst returns, while the S&P500 performed the best.
Panel B of Table 1 shows that the best performing REIT sector in the pre-taper period was Industrial REITs and the worst was Residential REITs. But in the post-taper period Hotel REITs showed the best performance and Healthcare REITs the worst.
Fundamental or Financial Effect
information and noise trading, according to the authors, is that information-based changes in stock prices persist while noise trading effects (the result of trading errors, miss-pricing, and overreaction) tend to be shortlived and reversed in subsequent periods. Following Perry (1982), French and Roll (1986) discriminate between the effects of information and noise trading on volatility by comparing daily return variances with the daily variances implied by variances for longer holding periods.
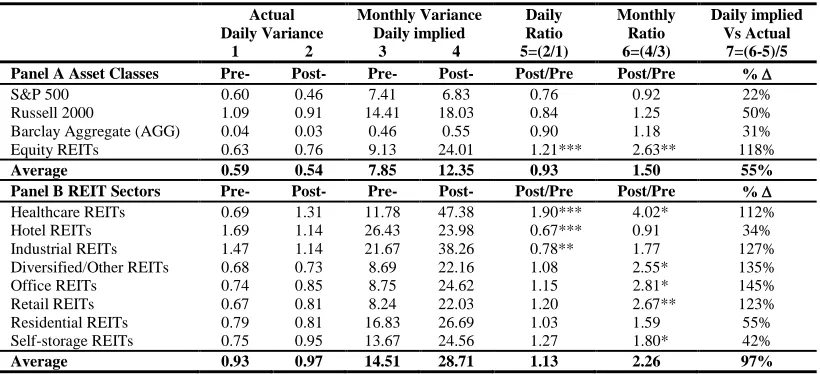
[image:6.612.102.512.317.504.2]Tuluca et al. (2003) extend this concept and suggest that the effects of information and noise trading on volatility can be detected by comparing the actual return variances of daily data with that implied by monthly data and use this idea to test the impact of the Asian crisis on international stock markets. We follow this approach in the current paper and test the impact of the ‘Taper Tantrum’ on US market prices by examining the differences of post-taper and pre-taper variance ratios and interpret an increase in the difference as a fundamental (informational) effect and a decrease as a purely financial (noise trading) effect. The results presented in Table 2.
Table 2: Pre-Taper Post-Taper Results
Actual Daily Variance
Monthly Variance Daily implied
Daily Ratio
Monthly Ratio
Daily implied Vs Actual 1 2 3 4 5=(2/1) 6=(4/3) 7=(6-5)/5 Panel A Asset Classes Pre- Post- Pre- Post- Post/Pre Post/Pre %
S&P 500 0.60 0.46 7.41 6.83 0.76 0.92 22% Russell 2000 1.09 0.91 14.41 18.03 0.84 1.25 50% Barclay Aggregate (AGG) 0.04 0.03 0.46 0.55 0.90 1.18 31% Equity REITs 0.63 0.76 9.13 24.01 1.21*** 2.63** 118%
Average 0.59 0.54 7.85 12.35 0.93 1.50 55% Panel B REIT Sectors Pre- Post- Pre- Post- Post/Pre Post/Pre %
Healthcare REITs 0.69 1.31 11.78 47.38 1.90*** 4.02* 112% Hotel REITs 1.69 1.14 26.43 23.98 0.67*** 0.91 34% Industrial REITs 1.47 1.14 21.67 38.26 0.78** 1.77 127% Diversified/Other REITs 0.68 0.73 8.69 22.16 1.08 2.55* 135% Office REITs 0.74 0.85 8.75 24.62 1.15 2.81* 145% Retail REITs 0.67 0.81 8.24 22.03 1.20 2.67** 123% Residential REITs 0.79 0.81 16.83 26.69 1.03 1.59 55% Self-storage REITs 0.75 0.95 13.67 24.56 1.27 1.80* 42%
Average 0.93 0.97 14.51 28.71 1.13 2.26 97%
Notes: *, ** and ***, indicates significance at the 10%, 5% and 1% level, respectively
Columns 1 and 2 in Panel A of Table 1 present the pre-taper and post-taper variances of daily returns for the four asset classes (large cap stocks, small cap stocks, bonds and REITs). Columns 3 and 4 shows the corresponding variances of monthly (implied daily) returns variances. Column 5 (Post/Pre) shows the ratios of the post-taper daily variance (column 2) of returns to the pre-taper daily variance (column 1), while Column 6 presents the same calculation for the monthly (implied daily) variances. Column 7 compares the post-crisis increases in monthly (implied daily) variances (column 6) versus the post-crisis increases in daily variances (column 5).
Page 5
appears to be superior in terms of robustness and power to other tests (Conover, et al., 1981; Brown and Forsythe, 1974; and Neter, et al., 1996). The results indicate that only Equity REITs show a significant increase in variance in post-taper versus pre-taper periods.
A casual examination of columns 5 and 6 show that the volatility for the four asset classes at the monthly frequency was greater than that at the actual daily frequency. Consequently, the results in column 7 show that all asset classes show an increase in monthly verses daily volatility. Monthly versus daily volatility rose by 118% for REITs, whereas that for large cap stocks, small cap stocks and bonds showed only moderate increases of 22%, 50% and 31%, respectively.
Following the proposition of French and Roll (1986) on the arrival of information and the reaction of traders, we interpret the increases in the monthly variances as increases in implied daily variances. Therefore, the French-Roll framework suggests that the effect of Ben Bernanke’s announcement on 22nd May 2013 were information based, or represent fundamental changes rather than trading errors (or other effects that are transitory), in all financial markets but especially so for REITs.
Panel B of Table 1 presents the same statistics as in Panel A for the 8 REIT sectors. Column 5 indicates that daily volatility of all sectors rose, except for Hotel REITs and Industrial REITs. Column 6 shows that all monthly volatilities increased, except for Hotel REITs. The results of the Brown-Forsythe test of variance equality indicate that only one REIT (Healthcare) showed significant increase in daily variance between the post-taper and pre-taper periods, while two REITs (Hotel and Industrials ) displayed a significant fall in daily variance. The results on the Brown-Forsythe test of variance equality at the monthly frequency shows that 4 REITs (Healthcare, Diversified/Other, Office and Retail) displayed significant increases in variance.
A comparison of columns 5 and 6 shows that in all 8 REIT sectors monthly (implied daily) variances was greater than that of their actual daily volatility. Hence, column 7 shows that monthly versus daily variances rose in all 8 REIT sectors, ranging from 34% in Hotel REITs to 145% in Office REITs with an average percentage increase of 97%. In other words, Ben Bernanke’s announcement on 22nd May 2013 had a significant impact on the market fundamentals of all REIT sectors.
The Diversification Benefit of REITs
In addition to the increased volatility following the 22nd May 2013, the correlation of REITs with Stocks and Bonds also changed dramatically. Table 3 shows the correlations of daily REIT returns with Stocks and Bonds in the pre-taper and post-taper periods.
Table 3 shows that the correlation of REITs with large cap stocks declined from an average of 0.68 to 0.61, a fall of 10%. The correlation of REITs with small cap stocks showing an even bigger fall from an average of 0.71 to 0.54, a fall of 24%.
from an average -0.35 to 0.24, an average increase of 179%. This relationship can be explained by taking into consideration the fact that when the REIT market is falling investors tend to become more risk averse, thereby prompting shifts of funds into safer assets, such as long-term government bonds and gives rise to the ‘flight-to-safety’ phenomena.
Table 3: REIT Correlations with Socks and Bonds: Pre-taper and Post-taper
Pre-taper Post-taper
S&P R2000 AGG S&P R2000 AGG
Equity REITs 0.75 0.78 -0.38 0.65 0.57 0.27 Healthcare REITs 0.58 0.58 -0.22 0.41 0.33 0.42 Hotel REITs 0.79 0.84 -0.49 0.77 0.75 0.07 Industrial REITs 0.73 0.75 -0.43 0.66 0.59 0.19 Diversified/Other REITs 0.77 0.78 -0.38 0.68 0.60 0.21 Office REITs 0.72 0.76 -0.38 0.61 0.56 0.26 Retail REITs 0.71 0.72 -0.37 0.62 0.54 0.28 Residential REITs 0.50 0.55 -0.19 0.52 0.43 0.23 Self-storage REITs 0.57 0.60 -0.27 0.57 0.50 0.19
Average 0.68 0.71 -0.35 0.61 0.54 0.24
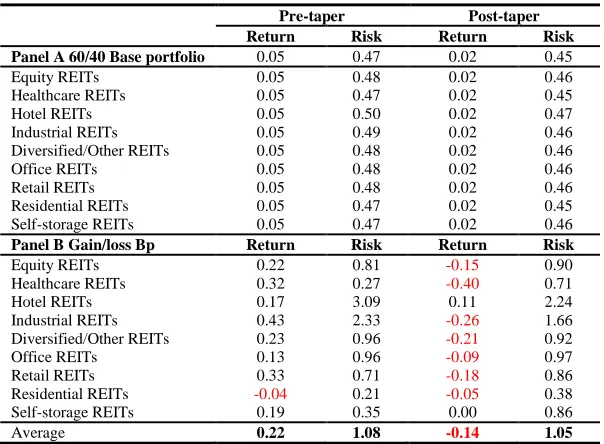
[image:8.612.156.458.442.664.2]In order to examine the impact of REITs on the US mixed-asset portfolio in the pre-taper and post-taper periods, we start with a base portfolio composed of 60% in Stocks (composed of 40% in large cap stock and 20% small cap stocks) and 40% in long-term Bonds. We then add an allocation of 5% to REITs to this base portfolio and rescale the weights of Stocks and Bonds appropriately. The results of this exercise for the pre-taper and post-taper periods are shown in Table 4.
Table 4: Impact of an Allocation of 5% to REITs in the 60/40 Mixed-asset Portfolio: Pre-taper and post-taper periods
Pre-taper Post-taper Return Risk Return Risk Panel A 60/40 Base portfolio 0.05 0.47 0.02 0.45 Equity REITs 0.05 0.48 0.02 0.46 Healthcare REITs 0.05 0.47 0.02 0.45 Hotel REITs 0.05 0.50 0.02 0.47 Industrial REITs 0.05 0.49 0.02 0.46 Diversified/Other REITs 0.05 0.48 0.02 0.46 Office REITs 0.05 0.48 0.02 0.46 Retail REITs 0.05 0.48 0.02 0.46 Residential REITs 0.05 0.47 0.02 0.45 Self-storage REITs 0.05 0.47 0.02 0.46
Panel B Gain/loss Bp Return Risk Return Risk
Equity REITs 0.22 0.81 -0.15 0.90 Healthcare REITs 0.32 0.27 -0.40 0.71 Hotel REITs 0.17 3.09 0.11 2.24 Industrial REITs 0.43 2.33 -0.26 1.66 Diversified/Other REITs 0.23 0.96 -0.21 0.92 Office REITs 0.13 0.96 -0.09 0.97 Retail REITs 0.33 0.71 -0.18 0.86 Residential REITs -0.04 0.21 -0.05 0.38 Self-storage REITs 0.19 0.35 0.00 0.86
Average 0.22 1.08 -0.14 1.05
Page 7
increase of 0.43bp or a reduction in return of -0.04bp. Nonetheless, this increase in return however would have been more than offset by an increase in portfolio risk of between 3.09bp and 0.27bp with an average increase of 1.08bp.
In the post-taper period an allocation of 5% to REITs would have had even worst impact on portfolio performance, compared with the pre-taper period, as is to be expected from the result in Tables 1 to 3. An allocation of 5% to REITs would have resulted in an average fall in portfolio returns of -0.14bp, with a maximum fall of -0.40bp, or no fall, depending on the REIT sector considered. Additionally, although an allocation of 5% in REITs would have increased portfolio risk by an average of 1.05bp this is less than the increase in risk in the pre-taper period. This smaller increase in portfolio risk can be explained by the fact that the correlation of REITs with Stocks fell in the post-taper period. So although the volatility of REITs increased in the post-taper period this was emolliated by the fall in the REIT-Stock correlation.
Conclusion
The term ‘Taper Tantrum’ has been widely used to define how the financial markets reacted to the comments by Federal Reserve Chairman, Ben Bernanke that the Fed might slow down, or taper, the rate of bond purchases, which is part of its QE program. In this paper, we empirically examine the effect of the ‘Taper Tantrum’ on US Stocks, Bonds and REITs using daily returns over the period from 3rd January 2011 to 9th October 2014 and make a number of interesting and significant findings. First, daily movements of all financial markets analysed here were affected by the ‘Taper Tantrum’, but most notably the REIT market.
Secondly, using the approach of French and Roll (1986), as extended by Tuluca et al. (2003), we find that the greatest increases in volatility were at the monthly, rather than daily, frequencies which suggests that much of the increased volatility following Ben Bernanke’s announcement had a fundamental impact on future capital values or expected earnings rather than noise trading effects. Thus we conclude the impact of ‘Taper Tantrum’ was fundamental and persistent rather than financial and transitory.
References
Brown, M.B., and Forsythe, A.B. (1974) Robust Tests for the Equality of Variances, Journal of the American Statistical Association, 69, 364-367
Conover, W. J., Johnson, M.E., and Johnson, M.M. (1981) A Comparative Study of Tests for Homogeneity of Variances, With Applications to Outer Continental Shelf Bidding Data, Technometrics, 23, 4, 351-361.
French, K.R. and Roll, R.W. (1986) Stock Return Variances: The Arrival of Information and the Reaction of Traders, Journal of Financial Economics, 17, 5-26
Neter, J., Wasserman, W., and Kutner, M.H. (1990) Applied Linear Statistical Models: Regression, Analysis of Variance, and Experimental Designs (3rd ed.), Homewood, IL: Irwin.
Perry, P.R. (1982) The Time-variance Relationship of Security Returns: Implications for the Return Generating Stochastic Process, Journal of Finance, 37, 857-870.