Abstract—Modern wind turbines vary greatly in their drive train configurations. With the variety of options available it can be difficult to determine which type is most suitable for on and offshore applications. A large percentage of modern drive trains consist of either doubly fed induction generators with partially rated converters or permanent magnet generators with fully rated converters. These configurations are the focus of this empirical reliability comparison. The turbine population for this analysis contains over 1800 doubly fed induction generator, partially rated converter wind turbines and 400 permanent magnet generator, fully rated converter wind turbines. The turbines analyzed are identical except for their drive train configurations and are modern MW scale turbines making this population the largest and most modern encountered in the literature review. Results of the analysis include overall failure rates, failure rates per operational year, failure rates per failure mode and failure rates per failure cost category for the two drive train configurations. These results contribute towards deciding on the most suitable turbine type for a particular site as well as towards cost of energy comparisons for different drive train types. A comparison between failure rates from this analysis and failure rates from similar analyses is also shown in this paper.
Index Terms— converter, DFIG, doubly fed induction generator, drive train, failure mode, failure rate, FRC, fully rated converter, generator, permanent magnet generator, PMG, reliability.
I. INTRODUCTION
wind turbine’s failure rate contributes to its overall cost of energy. Typically, a higher failure rate leads to a higher cost of energy. Consequently, wind farm developers try to select a turbine with low failure rates. Due to accessibility issues, the failure rates of turbines become even more important as offshore wind generation increases [1]. This paper shows the results of an analysis determining which of the two turbine configurations has a lower failure rate.
Based on 2,222 onshore wind turbines from a leading manufacturer, the failure rate of the two different generator and converter types are analyzed. All turbine generators and converters are in their first 5 years of operation and from wind farms throughout Europe. The full data set consists of over 34,000,000 turbine hours of data.
This paper was submitted for review on 27/06/2014. This work has been funded by the EPSRC, project reference number EP/G037728/1.
The authors are with the University of Strathclyde, 204 George Street, Glasgow, G1 1XW. J. Carroll and A. McDonald are with the Wind Energy Doctoral Training Centre in Strathclyde. D. McMillan is with the Electronic and Electrical Engineering Department in the University of Strathclyde.
(e-mail: j.carroll@strath.ac.uk, alasdair.mcdonald@strath.ac.uk,
d.mcmillan@strath.ac.uk)
Both generator and converter types in the two different drive train configurations have the same rated power and are installed in turbines that are identical except for their drive train configurations.
In order to ensure confidentiality the exact nominal power or blade size of the turbine type used in this analysis is not provided. However it can be stated that it is a modern MW scale turbine type with an identical blade size and nominal power in all 2,222 onshore turbines. As a guide to the size of the turbine type, the blade size is between 80 and 100m, the nominal power is between 1.5 and 2.5MW and the nominal operating speed is between 1500 and 1700 rpm.
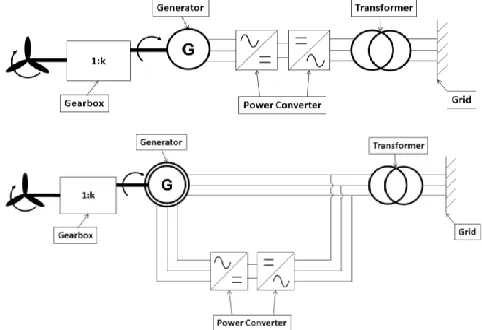
[image:1.612.317.558.396.561.2]The first drive train configuration in this analysis consists of a doubly fed induction generator (DFIG) which is partially decoupled from the grid with a partially rated converter (PRC). The other drive train configuration consists of a permanent magnet generator (PMG) which is completely decoupled from the grid with a fully rated converter (FRC). Both configurations can be seen in Fig. 1.
Fig. 1: DFIG PRC and PMG FRC configurations
The novelty of this work is in the large modern sample size for both drive train configurations and the homogeneity of the turbine population when the drive train differences are disregarded. Other reliability studies in the public domain that have similarly large population sizes are for older smaller turbine types as low as 200kW and up to 20 years old [1]-[3]. Recent reliability studies on larger turbines still contain turbines in their population that are as low as 850kW and have far smaller population sizes of 350 turbines [4] in comparison to the 2,222 turbines in this paper. This large and modern population provides up to date and reliable failure rates, which are lacking in the public domain [5],[6] and can be used in operations and maintenance [7] and reliability [8],[9],[10]
Reliability Comparison of Wind Turbines with
DFIG and PMG Drive Trains
James Carroll, Alasdair McDonald, David McMillan
modeling.
This paper is also unique because it separates the analyzed population into different drive train configurations. Current generator and converter failure rates in the public domain are for one generic generator or converter type that are obtained from a population consisting of many different generator and converter types [2],[3]. The opportunity to compare failure rates from identical turbines (apart from the drive train) allows for a unique reliability comparison of the two different drive train configurations. The resulting separate drive train failure rates for different drive train configuration types allow for greater granularity and differentiation of different wind turbine types in future analyses and modeling.
This paper is also novel in that failure rates are further broken down into cost categories; this cost analysis does not occur in other failure rate papers in this area [2],[3],[11]. Providing failure cost data for different drivetrain types will contribute to improving cost modeling papers like [7],[12],[13],[14]. As the drive train is the greatest differentiating factor in modern wind turbines having this failure and cost data will contribute towards calculating the cost of energy for different wind turbine types. This in turn will assist developers in choosing a preferred turbine type for a site, based on the cost of energy.
The identification of failure modes and frequency of occurrence in this work is also unique in failure rate analyses [2],[3],[11] and can be used to assist wind turbine manufacturers in deciding where to focus their resources for reliability improvement.
II. DRIVE TRAIN AND RELIABILITY LITERATURE REVIEW
A. Drive train
A wind turbine drive train is made up of a torque/speed conversion step (e.g. a gearbox), a mechanical to electrical conversion step (e.g. an induction generator) and an electrical power conversion step (e.g. a fully rated converter). Some wind turbines make do without one of these steps such as direct drive turbines (no gearbox) and fixed speed turbines (where the induction generators are directly grid connected). There are a number of different options for each step and some of the more popular configurations are examined in this paper. Reference [15] examines a number of different gearbox and generator configurations. The dominant technology for onshore turbines is a three stage gearbox, DFIG with a PRC connected to the generator rotor via slip rings. PMGs tend to be more efficient than these induction machines and more compact than wound rotor synchronous machines [16],[17]. They are becoming favored for offshore turbines where their higher cost is less important than their high efficiency.
As well as direct drive machines, PMGs are used at medium speed in modular or integrated format [18] and at higher speeds. For both the FRC and PRC, two back to back pulse width modulated voltage source converters with two level output voltage are typically used [19].
B. Reliability
There have been a number of reliability and failure rate analyses carried out for wind turbines and wind turbine
sub-assemblies over the past decade. However, due to the limited amount of failure databases in the public domain the majority of these analyses have been based on the same wind turbine populations and failure databases [5]. Databases such as LWK and WMEP in Germany, WindStats in Germany and Denmark, Reliawind and a population from Sweden [3] have been used in the papers detailed in the following paragraphs.
The papers [2],[20] are based on a population that builds up to 6,000 onshore wind turbines over an 11 year period. The population is installed in Denmark and Germany and failures have been recorded in the LWK and Windstats database. This was the largest population encountered in the literature review; however it contains turbines as small as 200kW. The fact that the population contains older smaller turbines means the failure rates obtained from it may not be applicable to modern MW scale turbines. No publications exist on failure rates for different drive train types using this LWK and WindStats population.
References [5],[21] are based on the WMEP database which contains failure data for up to 1,500 turbines over a 15 year period throughout Germany. These 1,500 turbines vary in drive train configuration but the analysis provides one overall failure rate and does not split the failure rate up by drive train type. A similar analysis is carried out in [3] on a population consisting of all the turbines installed in Sweden. This Swedish database runs from 1997 and builds up to ~ 750 turbines. The Reliawind work [4] is based on 10 minute SCADA data, work orders, alarm logs and service records from 350 turbines. This is a smaller population than the other databases but consists of more modern turbines. As with the other analyses, the results from the Reliawind work does not differentiate between turbine types.
The papers in the previous paragraphs all provide the results of their reliability analyses on the wind turbines and wind turbine subassemblies in the failures per turbine per year format. Other papers encountered provide their reliability results in terms of turbine availability [1],[22].
III. POPULATION ANALYSIS
A. Population Installation Dates
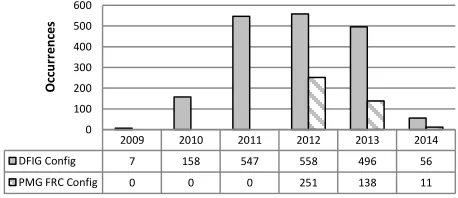
The DFIG configuration has a sample size building up to 1,822 turbines over a five year period. This sample size provides 3,391 years or ~29.7 million hours of turbine data.
[image:2.612.323.552.615.714.2]The PMG FRC configuration has a sample size building up to 400 turbines over a 3 year period. This sample size provides 511 years or ~4.5 million hours of turbine data. The installation years for both these populations is seen in Fig. 2.
Fig. 2: Turbine installation dates for both populations
2009 2010 2011 2012 2013 2014 DFIG Config 7 158 547 558 496 56 PMG FRC Config 0 0 0 251 138 11
0 100 200 300 400 500 600
O
cc
ur
re
nc
e
B. Capacity Factors for Both Populations
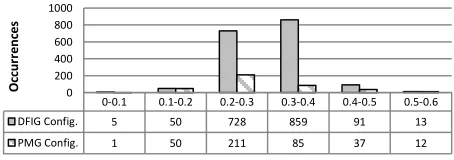
The capacity factor is defined as the ratio of actual energy produced over a given time period, to the amount of energy that theoretically could have been produced had the wind turbine been running at rated power for the whole of that same time period. The capacity factors for both populations are shown in Fig. 3. The average capacity factor for the DFIG configuration population is 30.7% and the average capacity factor for the PMG FRC population is ~ 2% lower at 28.8%. Both populations are greater than the 2012 European average of 24% [23].
The 2% difference in capacity factors of both populations in this study could be a result of differences in site conditions. The poorer capacity factor from the PMG FRC population could be due to those turbines being more recent installations in countries where sites with the best wind resources are already taken. The capacity factors calculated in this paper include downtime and are in the paper to show that there is not a major difference between the types of sites in which both populations are placed.
A standard deviation of 4.57 is obtained for an overall European capacity factor based on the capacity factors of all of the European countries listed in [24]. As a rough indication of how well the populations in this study have performed in comparison to other European wind farms a cumulative probability analysis is carried out. It is assumed that the capacity factors are normally distributed. A z-score is then calculated using the following formula:
z = (X-µ)/σ (1) where
X = Test population capacity factor
µ = European population mean
σ = European population standard deviation
[image:3.612.57.284.577.657.2]Using the calculated z score and the standard normal distribution table the cumulative probability is obtained. Results show that based on the 2012 European capacity factor mean of 24% and standard deviation of 4.57, the PMG FRC population from this analysis performed in the top 15% and the DFIG population in the top 7% in terms of capacity factor. Even though there is a 2% difference in mean capacity factors, the fact that both populations are in the top 15% indicates that both populations have relatively similar site conditions.
Fig. 3: Turbine capacity factor for both populations
IV. FAILURE DATA AND DEFINITIONS
A. Failure Definition
For the purpose of this analysis a failure is defined as a visit to a turbine, outside of a scheduled operation, in which
material is consumed. A material is defined as anything that is used or replaced in the turbine; this includes everything from consumable material (such as carbon brushes) to replacement parts such as full IGBT units and full generators.
This failure definition does not cover faults that are resolved through remote, automatic or manual restarts. However, if these faults repeatedly occur, they require a visit to the turbine in which material is used and the failure is then captured in this analysis, providing the visit is outside of a scheduled service. Failures are defined differently in most papers encountered. In [4], a failure is defined as the stoppage of a turbine for one or more hours that requires at least a manual restart to return it to operation. Like the failure definition from this paper, the automatic restarts are not captured. The same failure definition is not used in this analysis because the downtime data for each failure was not available.
B. Failure rates and failure rate categories
In this analysis the failure rates are in per turbine per year format as seen in [1],[2],[20]. The formula used to determine failure rate per turbine per year in this analysis can be seen below; it is the same formula used by Tavner to calculate failure rates in [20]:
∑ ∑
∑ (2) where
λ = failure rate per turbine per year
I = number of intervals for which data are collected
K = the number of subassemblies
ni,k = the number of failures
Ni= the number of turbines
Ti = the total time period in hours
The numerator ∑ ∑ is the sum of the number of failures in all periods per turbine. The denominator, ∑
, is the sum of all time periods in hours divided by the number of hours in a year.
The failure types are categorized into three groups. These groups are based on the Reliawind categories from [25] in which failures are classified as a minor repair, major repair or major replacement. For the purpose of this analysis any failure with a total repair material cost of less than €1,000 is considered a minor repair, between €1,000 and €10,000 a major repair and above €10,000 a major replacement.
C. Method
The following paragraphs and flowchart describe the process for analyzing the DFIG failure data. These steps are repeated for the PRC, PMG and FRC failure data.
The wind turbine manufacture that provided access to their data has a database containing all work orders carried out on each of their wind turbines and a database detailing the material used in each of the work orders.
Using SQL, both databases are connected using an inner join to determine the materials used in each operation. The data is then cleaned to remove any work that is not related to the DFIG. The data is also cleaned to remove any scheduled operations, e.g. scheduled services or scheduled inspections. 0-0.1 0.1-0.2 0.2-0.3 0.3-0.4 0.4-0.5 0.5-0.6
DFIG Config. 5 50 728 859 91 13 PMG Config. 1 50 211 85 37 12
0 200 400 600 800 1000
O
cc
ur
re
nc
e
Once each failure related to a DFIG is identified, its total material cost is calculated and the failure is then categorized as a minor repair, major repair or major replacement as described in Section IV-B.
[image:4.612.321.561.83.178.2]Each failure is then labeled with a failure mode. The failure mode of each work order is determined by reading through the work order long text in which the wind turbine technician provides a brief description on the work he has carried out. Examples of the failure modes for the DFIGs can be seen in Section V-B.
Fig. 4: Flow chart of failure rate data analysis
V. RESULTS AND DISCUSSION
A. Generator and Converter Failure Rates
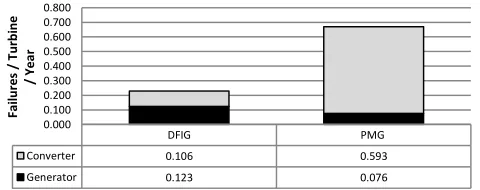
The failure rates for the permanent magnet generator (PMG) and the doubly fed induction generator (DFIG) can be seen in Fig. 5. The failure rates of 0.123 for the DFIG and 0.076 for the PMG include the failures for the generator auxiliary systems, such as cooling and lubrication. The failure rate difference of 0.047 is as expected due to the fewer possible failure modes in the PMG.
The failure rates for the PRC and the FRC can also be seen in Fig. 5. The FRC and PRC are manufactured by the same converter manufacturer. The failure rates of 0.106 for the PRC and 0.593 for the PMG FRCs include the failures for a converter’s auxiliary cooling system. The higher failure rate is expected from the PMG FRCs due to them having higher losses which may cause cooling issues and the greater stress on the converters which cannot be shared with the generator as in the DFIG system. Another reason for the higher failure rate of the FRC can be seen in [26]. It is suggested that the converter module used in the FRC is roughly 3 times the size of the converter module in the PRC meaning there are more opportunities for failure.
The overall PMG FRC failure rate of 0.669 is nearly 3 times greater than the DFIG PRC failure rate of 0.229. The driver for this large difference is the FRC. As seen in Fig. 5, the PMG has a lower failure rate than the DFIG but the much
larger FRC failure rate means the PMG FRC configuration is higher overall.
Fig. 5: Failure rates for generators and converters from both configurations
[image:4.612.46.300.174.356.2]Fig. 6 shows the cost of failures for both configurations. It can be seen that the PMG FRC configuration has a failure rate over 3 times greater than the DFIG failure rate for minor failures costing below €1,000. The DFIG failure rate is ~ 50% that of the PMG FRC failure rate for major repairs costing between €1,000 and €10,000. The major repair failure rate for repairs costing over €10,000 are 0.014 failures per turbine per year for the PMG FRC configuration and 0.003 failures per turbine per year for the DFIG configuration.
Fig. 6: Drive train configuration failure rate per failure severity category
[image:4.612.325.555.329.416.2]Fig. 7 shows the failure rate for each configuration type per year of operation. It can be seen that the PMG FRC configuration has a failure rate ~3 times that of the DFIG configuration for the first 2 years. In year 3 the PMG FRC configuration failure rate drops below the DFIG configuration.
Fig. 7: Drive train configuration failure rate per year of operation
One possible explanation for the third year drop in failure rate for the PMG FRC configuration is that it is a less mature technology, so there is a very high infant mortality rate in the earlier years of operation. However a more likely explanation is that the population of wind turbines in their 3rd year of operation drops to 11. This is a relatively small sample size and perhaps combined with the potential for higher infant mortality rates in the less mature PMG FRC configuration,
DFIG PMG
Converter 0.106 0.593
Generator 0.123 0.076
0.000 0.100 0.200 0.300 0.400 0.500 0.600 0.700 0.800
Fa
ilur
e
s
/ T
ur
bi
ne
/ Y
e
ar
Minor Repair Major Repair Major Replacment DFIG Config. 0.16 0.067 0.003 PMG Config. 0.514 0.141 0.014
0 0.1 0.2 0.3 0.4 0.5 0.6
Fa
ilur
e
s
/ T
ur
bi
ne
/ Y
e
ar
Year 1 Year 2 Year 3 Year 4 Year 5 DFIG Config. 0.1 0.078 0.041 0.011
PMG Config. 0.284 0.276 0.033 0
0.05 0.1 0.15 0.2 0.25 0.3 0.35
Fa
ilur
e
s
/ T
ur
bi
ne
/ Y
ea
r
1. Failure rate data access agreed with leading manufacturer
2. Process and clean failure rate data from work order and material usage databases using SQL and Microsoft Excel
3. Calculate the cost of each failure through adding the material cost of each work order
4. Categorise the failures based on their cost
[image:4.612.320.557.516.608.2]explains the third year drop. The smaller sample size is also reflected in the larger uncertainty bars in Fig. 7. The following formula is used to create the error bars by estimating the accuracy of the standard error of the sample proportion in binomial standard deviation:
EB =√ (3)
where
EB = Error Bars
n = number of turbines in population
Y = x/n where x is the the number of failures
[image:5.612.324.556.50.141.2]Fig. 8 shows the failure rate for the DFIG, PMG, PRC and FRC. It is referred to in each of the following four Sections.
Fig. 8: DFIG, PMG, PRC and FRC failure rate per failure severity category
Fig. 7 and Fig. 9 show that there are only 4 years of failure rates for the DFIG population even though it is clear from Fig. 2 that there are turbines operating in their fifth year. The reason for this is that there are no failures in year 5 due to the small sample size of turbines in their fifth year of operation. A similar case occurs for the PMG in Fig 11. It can be seen from Fig. 2 that there are PMGs in their third year of operation but Fig. 11 only has two years of failure rates. Again, the reason for this is because of the lack of failures from the smaller sample size of PMG turbines in their third year of operation.
B. DFIG Detailed Analysis
[image:5.612.51.290.253.374.2]The DFIG failure rate of 0.123 failures per turbine per year is broken down into the three failure categories as described in Section III-C. This break down is shown in the black hatching in Fig. 8. The majority of the failures that occur in the DFIG are minor repairs, costing less than €1,000. Approximately 25% of failures are major repairs costing up to €10,000 and ~1.6% of the 0.123 failures / turbine / year are major replacements.
Fig. 9 shows the year of operation in which failures occur. It can be seen that the higher failure rates and major replacements occur in the earlier years of operation.
Fig. 9: DFIG failure rate per failure severity category and year of operation
[image:5.612.321.566.321.421.2]To determine which failure modes contributed to the failure rate of 0.123 failures / turbine / year, the failure mode analysis described in Section IV-C is carried out. The results of this analysis are seen in Fig. 10. For the DFIG, brush and slip ring related issues are the greatest contributor to the failure rate. The second highest contributor is generator bearing related issues; this category includes problems with the bearing itself, bearing sensor issues and problems with the generator bearing lubrication system. The majority of the major replacements shown in black in Fig. 10 are due to insulation issues; stator insulation in particular. A major replacement also occurs in the generator bearing category.
Fig. 10: DFIG failure rate per failure mode and failure severity category
C. PMG Generator Detailed Analysis
As with the DFIG in Section V-B, the PMG failure rate of 0.079 failures / turbine / year is broken down into the three failure categories, as described in Section IV-B. This break down is shown in solid black bars Fig. 8. Even more so than the DFIG the vast majority of the failures that occur in the PMG are minor repairs, ~ 97.4% of all the failures are minor repairs below €1,000. Approximately 2.6% of failures are major repairs costing up to €10,000 and there are no major replacements or repairs over €10,000.
The year of operation in which failures occur can be seen in Fig. 11. As mentioned earlier there are PMG turbines in their third year of operation, however due to the PMG having a lower failure rate and a smaller sample size for a lower number of years, we only have failures occurring in two years of operation with no major repairs occurring after year one.
Fig. 11: PMG failure rate per failure severity category and year of operation
Minor Repair Major Repair Major Replacement
DFIG 0.091 0.030 0.002
PMG 0.074 0.002 0.000
PRC 0.069 0.037 0.001
FRC 0.440 0.139 0.014
0.000 0.050 0.100 0.150 0.200 0.250 0.300 0.350 0.400 0.450 0.500
Fa
ilur
e
s/
Tur
bi
ne
/ Y
e
ar
Year 1 Year 2 Year 3 Year 4 Major Replacement 0.001 0.001 0.000 0.000 Major Repair 0.006 0.012 0.011 0.001 Minor Repair 0.035 0.036 0.015 0.006
0.000 0.020 0.040 0.060
Fa
ilur
e
s
/ T
ur
bi
ne
/ Y
e
ar
Slip Ring/Brush
Issue Gen Bearing
Issue Gen Cooling System
Insulation Issue
Gen Encoder
Gen Allignment
Major Rep. 0.0000 0.0003 0.0000 0.0018 0.0000 0.0000 Major Repair 0.0254 0.0012 0.0029 0.0003 0.0000 0.0000 Minor Repair 0.0383 0.0383 0.0124 0.0000 0.0015 0.0009
0.0000 0.0200 0.0400 0.0600 0.0800
Fa
ilur
e
s
/ T
ur
bi
ne
/ Y
e
ar
Year 1 Year 2 Major Repair 0.002 0.000 Minor Repair 0.027 0.047
0.000 0.010 0.020 0.030 0.040 0.050
Fa
ilur
e
/ T
ur
bi
ne
/ Y
ea
[image:5.612.323.551.657.730.2]To determine which failure modes contributed to the failure rate of 0.076 failures / turbine / year, the failure mode analysis described in Section IV-C is carried out. The results of this analysis are seen in Fig. 12. The majority of the failures with the PMG are related to the generators auxiliary systems, with the lubrication and cooling system making up ~89.5% of the failures. The fact that these auxiliary system repairs are generally quite cheap to repair helps explain why ~98.4% of all PMG failures are minor repairs costing below €1,000.
Fig. 12: PMG failure rate per failure mode and failure severity category
D. PRC Detailed Analysis
As seen in Section III-A, the PRC has a failure rate of 0.106 failures / turbine / year. The solid grey bars in Fig. 8 show the failure categorization. Over 99% of the failures are below €10,000 with 64% of these failures costing under €1,000.
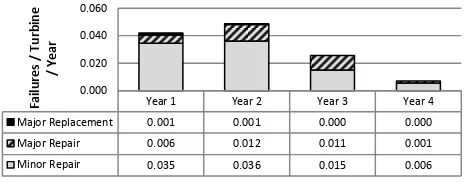
[image:6.612.325.552.204.292.2]The year of operation in which failures occur is shown in Fig. 13. Similar to the DFIG generator, it can be seen that the higher failure rates and major repairs occur in the earlier years of operation.
Fig. 13: PRC failure rate per failure severity category and year of operation
[image:6.612.324.552.386.477.2]As in the two previous Sections with the DFIG and PMG, a failure mode analysis is carried out on the PRCs. The results of this analysis are seen in Fig. 14. The biggest contributor to the failure rate is the converter control modules; they account for approximately 39% of failures, this is closely followed by electrical connection issues. In this analysis the gate-driver board and IGBT issues are included in the electrical connection issues. Other failure modes include the converters cooling system and converter protection.
Fig. 14: PRC failure rate per failure mode and failure severity category
E. PMG Fully Rated Converter Detailed Analysis
As seen in Section V-A, the FRC has the highest failure rate of all parts analyzed in this paper. In Fig. 8 the failure categorization is shown in grey hatched bars. It is worth noting that for the FRC the major repair failures alone are higher than all category failures combined for the converters used in the DFIG configuration at 0.139 and 0.106 respectively.
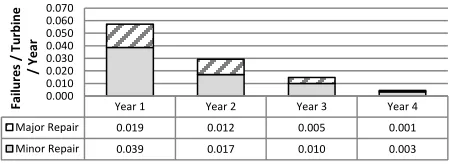
The year of operation in which failures occur are shown in Fig. 15. Similar to the PRC, it can be seen that the FRC also has higher failure rates and major replacements occurring in the earlier years of operation.
Fig. 15: FRC failure rate per failure severity category and year of operation
[image:6.612.63.288.408.490.2]As in Sections V-B, V-C and V-D, a failure mode analysis is carried out on the FRCs. The results of this analysis are seen in Fig. 16. The failure modes seen in Fig. 14 and Fig. 16 are named and grouped in this manner on request of the manufacturer to satisfy confidentiality agreements.
Fig. 16: FRC failure rate per failure mode and failure severity category
Causing over 44% of the FRC failures, the converter cooling system is the largest contributor to the overall failure rate. Converter control module issues are the second most common failure mode for the FRC, followed by electrical connection issues. These electrical connection issues are one of the big contributors towards cost with all of the failures related to these issues being in the higher cost brackets. IGBT issues and gate-driver board issues are again included in the electrical connection issues section. The remainder of the failure modes relate to protection issues or the replacement of the full converter module. No details were provided on why the overall converter module had to be replaced, but these replacements fall into the highest cost bracket.
VI. COMPARISON WITH SIMILAR STUDIES
As stated in the Introduction, a number of papers that look at different failure rates for wind turbine systems and sub-assemblies exist. Fig. 17 compares the failure rates presented Gen Lubrication
System
Gen Cooling
System Gen Alignment Major Repair 0.000 0.002 0.000 Minor Repair 0.051 0.016 0.008
0.000 0.010 0.020 0.030 0.040 0.050 0.060
Fa
ilur
e
s
/ T
ur
bi
ne
/ Y
e
ar
Year 1 Year 2 Year 3 Year 4 Major Repair 0.019 0.012 0.005 0.001 Minor Repair 0.039 0.017 0.010 0.003
0.000 0.010 0.020 0.030 0.040 0.050 0.060 0.070
Fa
ilur
e
s
/ T
ur
bi
ne
/ Y
e
ar
Control Modules
Elec. Con. Issues
Cooling System
Protection Issue Major Rep. 0.000 0.001 0.000 0.000 Major Repair 0.001 0.033 0.000 0.001 Minor Repair 0.041 0.006 0.021 0.003
0.000 0.010 0.020 0.030 0.040 0.050
Fa
iluj
re
s
/
Tur
bi
ne
/
Ye
ar
Year 1 Year 2 Year 3 Major Replacement 0.008 0.006 0.000 Major Repair 0.051 0.082 0.006 Minor Repair 0.225 0.188 0.027
0.000 0.050 0.100 0.150 0.200 0.250 0.300
Fa
ilu
res
/ T
u
rb
ine
/
Yea
r
Cooling system
Control Modules
Elec. Con. Issues
Protection Issues
Converter Rep. Major Rep. 0.000 0.000 0.006 0.000 0.008 Major Repair 0.000 0.004 0.121 0.010 0.004 Minor Repair 0.262 0.157 0.002 0.020 0.000
0.000 0.050 0.100 0.150 0.200 0.250 0.300
Fa
ilur
e
/ T
ur
bi
ne
/ Y
e
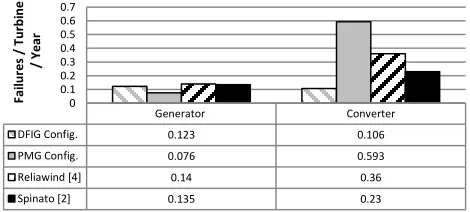
[image:6.612.64.289.635.723.2]in [2],[4] to the failure rates presented in this paper. In this paper the generator and converter failure rates are separated for the different turbine configurations; however, this is not the case for the analyses carried out in [2] and [4], in which both populations analyzed contain mixed drive train configurations.
Fig. 17: Generator and converter failure rate comparison with other papers
Fig. 17 shows all four generator failure rates are relatively similar, with the greatest difference coming between the PMG failure rate from this paper and the generalized generator failure rate from the Reliawind analysis. Both generator failure rates from this paper are lower than the failure rates from the other two analyses. Spinato in [2] provides a failure rate range from 0.05 – 0.135. The range reflects different populations and ages. The lower end of the scale comes from older WindStats Denmark data for smaller turbines. The higher end of the range is from a German population that includes larger turbines and direct drive machines which are known to have a higher failure rate [2]. The Reliawind study from [4] is based on a population that is more modern than [2]; this suggests larger turbines which could explain the slightly higher failure rate. In comparison to this paper, the slightly higher failure rate could also be related to the population including some direct drive machines, which have higher failure rates than geared driven machines [2].
When compared with the generator failure rates across all 3 papers, the converter failure rates show a greater variance. The largest difference is seen between the PRC and the FRC from this paper. The drivers for this difference can be seen in Sections V-D and V-E. The general converter failure rate in [4] comes from modern wind turbines all of which are at least greater than 850kW. This ensures that the nominal power difference is not as much of a factor as it is with [2] in which the turbines nominal power are smaller. The fact that the Reliawind failure rate is slightly closer to the PRC failure rate than to the PMG FRC failure rate from this paper, may suggest that the Reliawind population consists of more DFIG configurations than FRC configurations.
VII. CONCLUSION
This paper shows that in terms of generator alone, the PMG has a lower failure rate than the DFIG. The DFIG has ~ 40% more failures than the PMG. This difference would grow
further if the generator auxiliary systems were removed from the analysis because the majority of the failures for the PMG are minor failures related to its cooling and lubrication system. It can also be seen that the PRCs are more reliable than the FRCs used in a PMG configuration. The failure rate of the FRCs are over 5 times greater than that of the PRCs.
When the generator and converter failure rates are combined for the different configurations, the gain in reliability from the PMG is completely reversed through the poorer reliability of the FRC. The overall combined failure rate for each configuration is shown in Section V-A. The PMG FRC configuration shows an overall failure rate nearly 3 times greater than the DFIG PRC configuration.
As this improved reliability is required both on and particularly offshore, the results from this paper can assist developers in deciding on which drive train configuration to choose for greater reliability. Based on the previous paragraphs and considering failure rate alone, the DFIG configuration is an obvious choice for drive train selection. However, the cost of energy (CoE) is the most important factor when deciding on turbine type. Drive train selection cannot be based on failure rate alone so further work could also look at MTTR, energy production and hardware costs. That further work combined with the failure results from this analysis can calculate the overall CoE for the different drive train types and ensure most appropriate turbine selection.
REFERENCES
[1] J. Carroll, A. McDonald, J. Feuchtwang and D. McMillian, “Drivetrain Availability of Offshore Wind Turbines,” in Proc. Eur. Wind Energy Conf., Barcelona, Spain, Mar. 10–13, 2014.
[2] F. Spinato, P. J. Tavner, G.J.W van Bussel and E. Koutoulakos, “Reliability of wind turbine subassemblies,” IET Renew. Power Generation, vol. 3, no. 4, pp. 1–15, Sep. 2009.
[3] J. Ribrant and L. M. Bertling, “Survey of failures in wind power systems with focus on Swedish wind power plants during 1997-2005,” IEEE Trans. Energy Convers., vol. 22, pp. 167–173, Mar. 2007.
[4] M. Wilkinson, K. Harman, F. Spinato, B. Hendriks, and T. Van Delft, “Measuring Wind Turbine Reliability - Results of the Reliawind Project,” in Proc. Eur. Wind Energy Conf., Brussels, Belgium, Mar. 14–17, 2011.
[5] M. Zhao, Z. Chen, and F. Blaabjerg, “Generation Ratio Availability Assessment of Electrical Systems for Offshore Wind Farms,” IEEE Trans. Energy Convers., vol. 22, pp. 755– 763, Sep. 2007.
[6] E. Echavarria, B. Hahn, G. J. W van Bussel, and T. Tomiyama, “Reliability of Wind Turbine Technology Through Time,” J. Solar Energy Eng., vol. 130, pp. 1–8, August 2008. Generator Converter
DFIG Config. 0.123 0.106 PMG Config. 0.076 0.593 Reliawind [4] 0.14 0.36
Spinato [2] 0.135 0.23
0 0.1 0.2 0.3 0.4 0.5 0.6 0.7
Fa
ilur
e
s
/ T
ur
bi
ne
/ Y
e
[7] F. de Jong, “Sensitivity of offshore wind turbine operation & maintenance costs to key operational parameters,” M.Sc. Thesis, Dept. of Technology Management, Eindhoven Univ. of Technology, Eindhoven, the Netherlands, 2007.
[8] K. Fischer, F. Besnard, and L. Bertling, “Reliability-Centered Maintenance for Wind Turbines Based on Statistical Analysis and Practical Experience,” IEEE Trans. Energy Convers., vol. 27, pp. 184–195, Mar. 2012.
[9] B. K. Subramanian, A. Attya, and T. Hartkopf. “Novel Wind Turbine Reliability Model-Implementation to Estimate Wind Farms Capacity Credit,” in Proc. IEEE ICHQP, Bucharest, Romania, 25-28 May 2014, pp. 97–101.
[10] K. Fischer, F. Besnard, L. Bertling, “Reliability-Centered Maintenance for Wind Turbines Based on Statistical Analysis and Practical Experience,” IEEE Trans. Energy Convers., vol. 27, pp. 184–195, Mar. 2012.
[11] K. Xie, Z. Jiang, and W. Li, “Effect of Wind Speed on Wind Turbine Power Converter Reliability,” IEEE Trans. Energy Convers., vol. 27, pp. 96-104, Mar. 2012.
[12] K. Hart, A. McDonald, H. Polinder, E. Corr, and J. Carroll, “Improved Cost of Energy Comparison of Permanent Magnet Generators for Large Offshore Wind Turbines,” in
Proc. Eur. Wind Energy Conf., Barcelona, Spain, Mar. 10–13, 2014.
[13] D. McMillan and G. Ault, “Techno-Economic Comparison of Operational Aspects for Direct Drive and Gearbox-Driven Wind Turbines,” IEEE Trans. Energy Convers., vol. 25, pp. 191–198, March 2010.
[14] K. Xie and R. Billinton, “Determination of the Optimum Capacity and Type of Wind Turbine Generators in a Power System Considering Reliability and Cost,” IEEE Trans. Energy Convers., vol. 26, pp. 227–234, March 2011.
[15] G. Bywaters et al., “Northern Power Systems WindPACT drive train alternative design study report,” Nat. Renew. Energy Lab., Golden, CO, Tech. Rep. NRELSR-500-35524, Oct. 2004.
[16] H. Polinder, F. van der Pijl, G. J. de Vilder, and P. Tavner, “Comparison of direct-drive and geared generator concepts for wind turbines,” IEEE Trans. Energy Convers., vol. 21, pp. 725-733, Sep. 2006.
[17] H. Li, Z. Chen, H. Polinder, “Optimization of Multibrid Permanent-Magnet Wind Generator Systems,” IEEE Trans. Energy Convers., vol. 24, pp. 82 – 92, Mar. 2009.
[18] S. Siegfriedsen, and G. Böhmeke, “Multibrid technology a significant step to multi‐megawatt wind turbines,” Wind Energy, vol. 1, pp. 89-100, Dec. 1998.
[19] F. Blaabjerg, M. Liserre, and K. Ma, “Power Electronics
Converters for Wind Turbine Systems,” IEEE Trans. Ind. Appl., vol. 48, pp. 708–719, Mar. 2012.
[20] P. Tavner, J. Xiang, and F. Spinato, “Reliability Analysis for Wind Turbines,” Wind Energy, vol. 10, pp. 1-18, Dec. 1998.
[21] B. Hahn, M. Durstewitz, and K. Rohrig, (2007) “Reliability of Wind Turbines, Experiences of 15 years with 1,500 WTs,” ISET, Available: http://renknownet2.iwes.fraun hofer.de/pages/wind_energy/data/2006-02-09Reliability.pdf
[22] K. Harman, R, Walker, and M, Wilkinson, “Availability trends at operational wind farms,” in Proc. Eur. Wind Energy Conf. Brussels, Belgium, Mar. 31–Apr. 3, 2008.
[23] EWEA. (2013) “Wind Energy Statistics and Targets,” Available: http://www.ewea.org/fileadmin/files/library/ publications/statistics/Factsheets.pdf
[24] European Commission. (2013) “EU Energy in Figures, Statistical Pocket Book,” Available: http://ec.europa.eu/energy /publications/doc/2013_pocketbook.pdf
[25] GH, ReliaWind, “Reliability focused research on optimizing Wind Energy systems design, operation and maintenance: tools, proof of concepts, guidelines & methodologies for a new generation,” Reliawind, Rep. 2007.
[26] K. Fischer, T. Stalin, H. Ramberg, T. Thiringer, J. Wenske, R. Karlsson, “Investigation of converter failure in wind turbines,” Elforsk, Rep. 2012.
James Carroll received the B.Eng.
degree in mechanical and manufacturing engineering from Dublin Institute of Technology in 2008, and the M.Eng. in Technical Management from Emden University of Applied Science, Germany in 2010. He is a Ph.D. student at the University of Strathclyde.
Alasdair McDonald received the M.Eng degree in Electrical and Mechanical Engineering from the University of Durham, U.K., in 2004 and a Ph.D. degree from the University of Edinburgh, U.K. in 2008. He is a lecturer in the EPSRC Wind Energy Doctoral Training Centre, University of Strathclyde.
David McMillan received the B.Eng.