City, University of London Institutional Repository
Citation
:
Netkachov, O., Popov, P. T. and Salako, K. (2014). Model-based Evaluation of
the Resilience of Critical Infrastructures under Cyber Attacks. Lecture Notes in Computer
Science, 8985, pp. 231-243. doi: 10.1007/978-3-319-31664-2_24
This is the accepted version of the paper.
This version of the publication may differ from the final published
version.
Permanent repository link:
http://openaccess.city.ac.uk/4364/
Link to published version
:
http://dx.doi.org/10.1007/978-3-319-31664-2_24
Copyright and reuse:
City Research Online aims to make research
outputs of City, University of London available to a wider audience.
Copyright and Moral Rights remain with the author(s) and/or copyright
holders. URLs from City Research Online may be freely distributed and
linked to.
Model-based Evaluation of the Resilience of Critical
Infrastructures under Cyber Attacks
Oleksandr Netkachov, Peter Popov and Kizito Salako
Centre for Software Reliability, City University London, UK {Oleksandr.Netkachov.1, P.T.Popov, K.O.Salako}@city.ac.uk
Abstract. In this paper we report recent results on modelling the impact of cy-ber-attacks on the resilience of complex industrial systems. We use a hybrid model of the system under study in which the accidental failures and the mali-cious behaviour of the Adversary are modelled stochastically, while the conse-quences of failures and attacks are modelled in detail using deterministic mod-els. This modelling approach is demonstrated on a complex case study - a refer-ence power transmission network (NORDIC 32), enhanced with a detailed model of the computer and communication network used for monitoring, pro-tection and control compliant with the international standard IEC 61850. We studied the resilience of the modelled system under different scenarios: i) a base-line scenario in which the modelled system operates in the presence of ac-cidental failures without attacks; ii) several different scenarios of cyber-attacks. We discuss the usefulness of the modelling approach, of the findings, and outline directions for further work.
Keywords: Critical Infrastructures, Power Transmission Network, IEC 61850, stochastic modelling.
1
Introduction
Security of industrial control systems (ICS) used to control critical infrastructures (CI) has attracted the attention of researchers and practitioners. The evidence is over-whelming that, the services offered by CI are somewhat robust with respect to single component failures of the underlying network. The reaction to multiple and cascade failures, however, is much more difficult to understand and to predict, especially when cyber attacks are taken into consideration. Dependencies and interdependencies between the elements of CIs are an important source of risk and risk uncertainty.
reliable methods for indirect measurement exist. For instance, whether a power gener-ator is connected to the power grid or not, is either directly observable or can be es-tablished reliably using sophisticated software tools such as state estimators.
The paper is organized as follows: In section 2 we state the problem of quantitative model based risk assessment studied in the paper. In section 3 we provide a descrip-tion of the modeling approach we take to model cyber-attacks on ICS. A brief de-scription of the case study used in the paper to illustrate the approach is also provided. Section 4 summarizes our findings, section 5 – the related research. Finally, section 6 concludes the paper and outlines directions for future research.
2
Problem statement
In the past we developed a method for quantifying the impact of interdependencies between CI [2], which we called Preliminary Interdependency Analysis (PIA). PIA starts by a systematic search for CI interdependencies at a fairly high level of abstrac-tion; interdependencies which might otherwise be overlooked. In a separate study [3] we demonstrated that although using a high level of abstraction is useful, the risk assessment results are, in general, quite sensitive to the chosen level abstraction. PIA allows the modeller to create hybrid models of the modelled infrastructures and choose the level of detail that suits the specific study. The software tools developed to support the PIA method allow the modeller to quickly build complex hybrid models which combine: i) stochastic models of a system and its constituent elements, ac-counting for functional, spatial and other stochastic dependencies between these ele-ments, and ii) domain specific deterministic models, necessary in case a high fidelity analysis is sought, e.g. flow models, typically operate on a subset of modelled ele-ments.
Cyber security of ICS has become a topic of active research (important contribu-tions are summarised in the Related Research section). Its practical importance, the need for empirical studies and the difficulties with these, have been widely recog-nised.
work by others in this direction, e.g. the ADVISE formalism [4]. The focus of this paper is to study the impact on network service of different attack strategies – where such strategies might be employed by naïve or more sophisticated attackers – and to highlight the effectiveness of some precautionary measures that a network operator could undertake.
3
Solution
3.1 The system under study
We use a non-trivial case study of a power transmission network to demonstrate the analysis one can undertake with the extended PIA and to evaluate how well the method scales to realistically complex industrial systems.
[image:4.595.126.472.315.487.2]
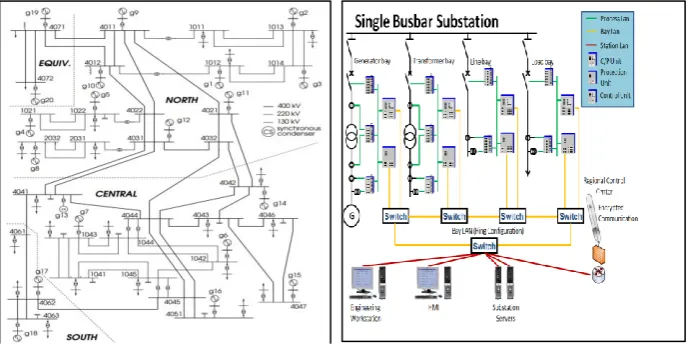
Fig. 1. NORDIC 32 power system topology.
The system model was developed by the FP7 EU project AFTER (http://www.after-project.eu/Layout/after/). It is based on a reference power transmis-sion network, NORDIC 32, enhanced with an industrial distributed control system (IDCS) compliant with the international standard IEC 61850 “Communication net-works and subsystems in sub-stations”. Illustrations of NORDIC 32 and of the archi-tecture of a sub-station are shown in Fig. 1. A detailed description of the case study is beyond the scope of this paper, but a short summary is provided below.
The transmission network (Fig. 1, diagram on the left) consists of a large number of transmission lines which connect 19 power generators and 19 loads. All connec-tions of lines, generators and links are done in 32 sub-staconnec-tions. Each sub-station is arranged in a number of bays. Each bay is responsible for connecting a single element – a line, a generator or a load – to the transmission network.
ar-chitecture but may contain different numbers and types of bays. Some sub-stations may have generators and/or loads, and all sub-stations connect transmission lines.
The sub-stations are connected via a sophisticated ICT infrastructure (not shown for lack of space), which includes a number of control centres, communication chan-nels and data centres.
Each bay is responsible for (dis)connecting one element from the transmission network. This is achieved by a set of elements – relays and electronic devices1. In this case study the electronic devices can be one of the following two types – either a protection device or a control device. The function of the protection devices is to dis-connect power elements from the transmission network, e.g. as a result of overloading of a line or of a generator. The control devices, on the other hand, are used to connect or disconnect power elements from the network and are typically used by either the operators in the respective control centres or by “special purpose software” (SPS) designed to undertake some of the operators’ functions automatically.
Each sub-station has a Local Area Network (LAN), which allows the local devices to communicate with each other. The LAN is protected from the rest of the world by a
firewall. Legitimate traffic in and out the sub-station is allowed, of course.
Each of the protection or control functions (with respect to the individual bays) is available whenever there exists a minimal cut set of available equipment supporting the function. In the absence of a minimal cut set the respective function itself becomes unavailable. A predicate defining the minimal cut sets is provided with each function: some functions are achieved using functionally redundant components, others are not. We model the entire system probabilistically, by building a stochastic state ma-chine for each element included in the system description. Each state machine has three states – “OK”, “Fail” and “Disconnected”. Depending on the element type, its model, in addition to a state machine, may include specific additional non-stochastic properties. For instance, the model of a generator will have a property defining the maximum output power; the model of a load - an additional property defining the power consumed, etc. The interested reader may find further details in [2].
3.2 Modelling cyber-attacks
Now we describe an Adversary model, added to the model of the system.
For the system under study we assumed that each sub-station will have a dedicated firewall (indicated by the “brick wall” in Fig. 1) which isolates the sub-station from the rest of the world. We also assumed that an intrusion detection/prevention system (IDS/IPS) would monitor the traffic in the sub-station’s LAN. When the IDS/IPS detects illegitimate traffic it blocks the Adversary from accessing the assets located at the sub-station.
Our study is limited to the effect of a single type of attack on system behavior: a cyber-attack via the firewall of a sub-station. The Adversary model we developed is
1 IEC 61850 distinguishes between Intelligent Electronic Devices (IED), functions and nodes.
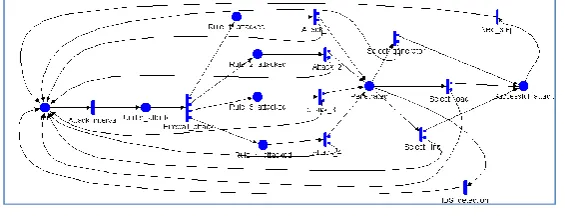
adapted from a recent publication [5]. The model is shown in Fig. 2 using the Sto-chastic Activity Networks (SAN) formalism.
This model assumes that the Adversary is initially idle (represented by the SAN
place labeled “Idle”).
With some regularity, defined by the activity Attack_interval, the Adversary launches a cyber-attack on the system by trying to penetrate the Firewall (modeled in
[image:6.595.158.441.246.354.2]Fig. 2 by the activity Firewall_attack) of one of the 32 sub-stations defined in NORDIC-32 model.
Fig. 2. Model of Adversary applied to NORDIC 32.
The selection of the sub-station to attack is driven by either a uniform distribution, defined over the 32 sub-stations (“Indiscriminate attacker profile”) or by a non-uniform distribution defined in a way to capture the preferences of the Adversary. We discussed elsewhere [6] the difference between the cases of an indiscriminate Adver-sary and an AdverAdver-sary with preferences. In this paper, we limit the study to an indis-criminate Adversary. Under the current model we also assume that the firewalls of all sub-stations are equally easy/difficult to penetrate. In fact, the SAN model in Fig. 2 is incomplete: it does not show how the Adversary chooses a sub-station. This model shows the steps that follow the Adversary’s initial selection of a sub-station to attack: ─ The Adversary may target each of the firewall configuration rules. The decision of
which rule to attack is modeled by the activity Firewall_attack. In Fig. 2 we as-sume that there are 4 rules to choose between, which is just an example. The model assumes that the rules are equally likely to be chosen by an attacker – the proba-bilities associated with the outputs of the Firewall_attack activity are all set to 0.25. ─ Once a rule is selected (modeled by the places Rule_1 – Rule_4), the Adversary
spends time trying to break the selected rule, which is modeled by the activities At-tack_1 – Attack_4, respectively. This effort may be successful or unsuccessful. In the case of a failed attempt, the Adversary returns to an idle state and may launch another attack later, likely to be on a different sub-station.
─ In the case of a successful penetration through the firewall, the state “Penetrated” is entered, which has three alternative options for the Adversary to proceed2:
2
to switch off a generator (in case a bay exists in the sub-station, via which a generator is connected to the grid),
to switch off a load (in case a bay exists in the sub-station via which a consumer is connected to the grid) or
to either disconnect a line from the grid (selecting at random one of those con-trolled by the sub-station) or to tamper the line breaker device associated with the line by changing the threshold of power at which the breaker will trip the particular line.
─ If the Adversary succeeds, she leaves the sub-station. In other words the Adversary under this model affects at most one bay per attack. This choice is modeled by the
instantaneous activity Next_step, which returns the Adversary to the state “Idle”. ─ IDS/IPS is modeled by the activity IDS_detection, which is enabled if the model
state is “Penetrated”. This activity competes with the activities selecting which bay will be targeted by the Adversary. The Adversary may be detected before she switches off a bay. As soon as the activity IDS_detection fires, the attack is aborted and the Adversary is returned to “Idle”.
A successful attack may trigger further activities in the system. For instance, any malicious switching-off of a bay may be “detected” when a new power flow calcula-tions is run. If so, via the respective control function, an attempt is made to reconnect those bays which have been disconnected by the Adversary.
In the presented Adversary model we assume that all timed activities are exponen-tially distributed. We studied the effect of the rates of some of these distributions on the selected utility function (which is discussed next).
4
Findings
4.1 Rewards
We were interested in measuring the effect of cyber-attacks on the service provided by the system under study. We chose to compare the behavior of a base-line model, i.e. a model without attacks, with the behavior of the models in which cyber-attacks are enabled (“system under attack”). The comparison is based on specific rewards (utility function). We selected, somewhat arbitrarily, the length of a simula-tion run to be the equivalent of 10 years of operasimula-tion. We use different rewards all linked to the supplied power – supplied power, in particular, has been used in the analysis of power systems by others [5]. Clearly, for each simulation run, the supplied power varies over time to form a continuous-time stochastic process. We study the following three statistics of this process, each capturing a different aspect of interest: ─ The average power supplied during a simulation run. This would be lower than the
nominal power of 10,940 MW. The average will vary between simulated runs, and we look at the distribution of this average over a number of runs.
─ We also estimate the distribution over the simulation runs of the minimum supplied power and use the percentiles of this distribution as an indication of how large the outage/blackout can be.
4.2 Studies
The studied system is non-trivial. It consists of more than 1500 state machines. With the chosen parameterization, based on input from domain experts, we observed a significant number (~4000 … 40,000) of events over a single simulation run. Many of these events require power flow calculations, which take considerable time to com-plete. Similarly, following overloads or generator failures, active “control” is required to find a new stable system state. Searching for a stable state is another time consum-ing algorithm. As a result, a sconsum-ingle simulation run takes approximately 5 min to com-plete. Obtaining results with high confidence would require a large number of simula-tion runs. All our results are based on 200 simulasimula-tion runs with each of the scenarios3. In a recent paper [6] we presented the results related to attacks targeted at switching off a single bay: a generator, load or a line by an Adversary who selects the substa-tions indiscriminately or who targets with high probability the important assets such as large generators large loads. In this paper, instead, we concentrate on attacks which do not lead to immediate visible consequences. An example of such attacks is chang-ing the trippchang-ing threshold of a line breaker. More specifically, we assume that an Ad-versary can tamper with an intelligent protection device by setting the value of trip-ping the respective line to 110% of the line load at the time the attack. Clearly, a suc-cessful attack will have no immediate effect, but any subsequent accidental failures, which lead to power flow changes, may trigger a trip of the respective lines unneces-sarily. A number of successful attacks over time may lead to multiple protection de-vices being tampered with, which in turn may lead to large cascades. In addition we introduce a model of inspections of the modeled system. An inspection checks if the tripping values of the protection devices are set correctly. If a deviation from these is detected the respective thresholds are restored to correct values.
We completed several simulation campaigns which are summarized as follows:
A base-line scenario. This represents the NORDIC 32 with only accidental failures of network components possible and no cyber-attacks.
A scenario of attacks with immediately visible effect. The base line scenario is ex-tended by adding cyber-attacks which, if successful, lead to a switch-off of a single bay (i.e. a transformer, or a load) in a substation. We model an intelligent adver-sary, who targets only the 5 largest loads and the 5 largest generators. The frequen-cy of the attacks is varied: yearly, monthly, weekly and daily.
Scenarios of attacks with no immediately visible effects. The base-line scenario is extended with attacks which, if successful, lead to a change of the tripping thresh-old of a single line in the bay selected by the Adversary. We distinguish between
3
two groups of such scenarios:
─ A scenario without inspections. The tripping thresholds are never checked by the network operator and restored to their correct values.
─ Scenarios with periodic inspections. The intervals between inspections are as-sumed exponentially distributed, and the rate of inspections is varied: yearly, monthly, weekly and daily.
4.3 Results
Each of the scenarios described above for a particular parameterization (rates of at-tacks and inspections, if applicable) was simulated 200 times. We summarize our findings below.
Base line vs. attacks with an immediately visible effect
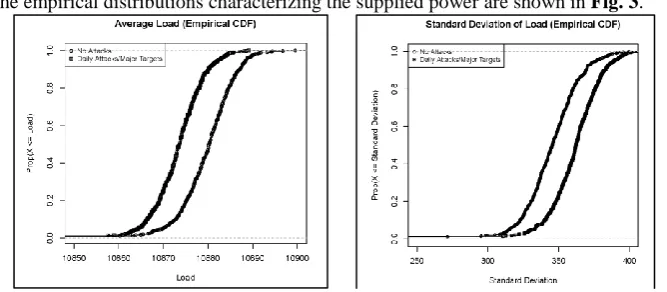
Successful attacks of this type lead to switching off either a generator or a load. The empirical distributions characterizing the supplied power are shown in Fig. 3.
[image:9.595.131.465.335.481.2]
Fig. 3. Base line scenario vs. the scenario of attacks on the most important generators and loads: empirical distributions of Mean and Standard Deviations of the supplied power.
Attacks with no immediately visible effect
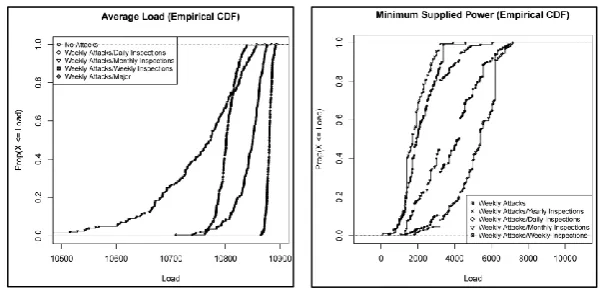
In this study the attacks, if successful, lead to an alteration of the tripping levels of protection devices of a single line in a bay chosen by an Adversary. Fig. 4 illustrates the impact of the inspection frequency on the supplied power.
The plot shows quite clearly that unless inspections are applied, very significant amounts of power will be lost – the average of the supplied power varies between 5000 and 8000 MW. The explanation is quite simple – unless the tripping thresholds are restored to their correct values, they will be gradually reduced by the successful attacks and many lines in the power network will operate with a significantly reduced capacity. Loosing such a large amount of power is unlikely to remain unnoticed and some inspections, as a measure of protection against attacks of this kind, are likely to be put in place. Not surprisingly, inspections change the picture dramatically – the lost power is now significantly reduced to levels comparable with those shown on
supplied (i.e. the distributions are accumulating towards the right in Fig. 4) and reduc-ing variability in power supplied (i.e. accumulatreduc-ing towards the left in Fig. 4).
[image:10.595.142.454.176.319.2]
Fig. 4. The impact on supplied power of the attacks frequency: empirical distributions of the Mean and Standard Deviation of the supplied power.
Comparison of the attacks
So far we looked at the impact on the supplied power of the different attacks, vary-ing their frequencies. Now we compare the scenarios with different attacks.
Fig. 5. Attacks with immediately visible effects vs. attacks without immediately visible effects.
[image:10.595.146.448.404.549.2]disrup-tion than the attacks by the less sophisticated attacker. Is this so? We studied this problem and present our findings in Fig. 5, using the distribution of the average sup-plied power and the distribution of the minimum supsup-plied power resulting from the attacks of the two types. The distributions obtained for the base line scenario are also included in the plot. In the plots of the average supplied power the base line and the scenario with attacks by an intelligent attacker are indistinguishable (both overlap on the far right of Fig. 5). Under the attacks of the second type, even with precautionary daily inspections carried out by the network operator, the average supplied power is lower. In other words, this type of attack, undertaken by a non-discriminating attack-er, leads to more serious losses than the targeted attack with visible effects by an in-telligent attacker. This ordering was not obvious before the study. The right hand half of Fig. 5 further corroborates this observation. The two right-hand-side curves in the plot represent the base lie scenario and the scenario of intelligent attacks with visible effects, respectively. Quite clearly, the distributions of the minimum supplied power under the attacks with no immediately visible consequences are stochastically worse than under the targeted attacks with immediately visible effects. In other words, for any given value of power supply, the chances for, at most, this amount to be supplied by the system is greater under attacks with no immediately visible effects, compared with the chances under targeted attacks with visible effects.
5
Related Research
Different aspects of SCADA system security have been studied extensively. Influential reports by both the Department of Homeland Security [7] and the Na-tional Institute of Standards and Technology (NIST) [1] provide a comprehensive discussion of SCADA architectures and best practice approaches for their security.
Stochastic models have been used in the past to address, specifically, the cyber se-curity of industrial control systems. For instance, Ten et. al [5] offer a model based on stochastic Petri nets, adapted for cyber security on power transmission systems. The study is similar to ours, except that Ten et. al do not provide a base line study and primarily concentrate on cyber-attacks under a fixed model parameterisation. In our study we explore the space of plausible parameters (sensitivity analysis). Ten et al. also use an extreme model of consequences of a successful attack, assuming that all bays of a compromised sub-station will be disconnected.
the illustration of our approach dealt with a single attack too, there is no constraint in our approach which prevents us from combining simultaneous attacks by different adversaries. The utility function used in ADVISE is normalised and is defined in the range [0, 1], which may require some effort to link the model with the specific context of study in order to give domain experts – such as power engineers, as in the example we studied – a clear interpretation of the findings from the modelling. Our approach allows one the freedom to define the reward in a way that is most suitable for the stakeholders.
An interesting approach to modelling an adaptive adversary is developed by Marti-nelli et al [8]. The key idea there is captured by a graph describing the steps that an adversary could take, including “stepping back” in case of unsuccessful attack.
Nash equilibrium has recently become popular in cyber security research, e.g. [9], the key idea being that under fairly broad assumptions, the existence of the worst consequences from cyber-attacks can be established without having to define, in de-tail, the attacks in specific contexts. Such studies, however, operate at a high level of abstraction and the findings from them may be difficult to interpret in practice.
6
Conclusions
We described an approach to stochastic modelling of industrial control systems in which both accidental failures and cyber-attacks are treated in a unified way:
─ stochastic state machines are used to model the behaviour of the elements of the ICS which allow the modeller to capture the accidental failures;
─ malicious behaviour of an Adversary (i.e. cyber-attacks) are modelled by stochastic state machines too, and these capture the behaviour of the Adversary (their knowl-edge/preferences about the assets under attack and the particular actions they would take once access to the assets is acquired);
─ the dependencies between the behaviour of the modelled elements – including accidental failures and the effects of successful cyber-attacks – are captured explic-itly via a set of additional models: either deterministic – such as power flows – or probabilistic – e.g. stochastic dependencies between the system elements.
We illustrated our approach on a non-trivial case study and report on the initial findings from a useful sensitivity analysis of system resilience on the parameters of different threats and defenses. We also compare two types of attacks using as a crite-rion how they affect the amount of supplied power.
We chose relatively simple attacks to illustrate the approach. Extending the work to more sophisticated scenarios of attacks is straightforward. Every new attack type would require a new model of the Adversary, which would define the steps an Adver-sary should take in launching an attack, a relatively simple task. Modelling combined attacks by multiple Adversaries would be also trivial: the system model would in-volve several Adversary models.
the communication protocols used in the ICS. A number of attack scenarios are of immediate interest. An obvious extension of the adversary model used in this paper is one in which the adversary may attack more than one sub-station, e.g. until she even-tually gets caught. Scenarios of simultaneous and/or coordinated attacks by multiple Adversaries (SWARM attacks) are important in practice, too. Modelling such attacks will require more complex models of an Adversary.
Last but not least, the recent work to re-engineer the tools supporting the PIA method makes it suitable to “study the future”, i.e. for studies, in which the system under study evolves. The changes may concern the system topology, the model pa-rameters and, not least, the impact of technological development and various hypothe-ses about how cyber crime may evolve over time.
7
Acknowledgement
This work was partially supported by the European Commission, under FP7 AFTER project, grant agreement number 261788 and under the Artemis JU project SESAMO, grant agreement number 295354.
8
References
1. Stouffer, K., J. Falco, and K. Kent, Guide to Supervisory Control and Data Acquisition (SCADA) and Industrial Control Systems Security. 2006, National Institute of Standards and Technology (NIST). p. 164.
2. Bloomfield, R.E., et al., Preliminary Interdependency Analysis (PIA): Method and tool support. 2010, Adelard LLP. p. 56.
3. Bloomfield, R.E., et al. Stochastic Modelling of the Effects of Dependencies between Criti-cal Infrastructures. in Critical Information Infrastructures Security: 4th International Workshop, CRITIS. 2010. 2009, Bonn, Germany: Springer.
4. Ford, M.D., et al. Implementing the ADVISE security modeling formalism in Möbius. in
The 43rd Annual IEEE/IFIP International Conference on Dependable Systems and Net-works (DSN). 2013. Budapest, Hungary: IEEE.
5. Ten, C.-W., C.-C. Liu, and G. Manimaran, Vulnerability Assessment of Cybersecurity for SCADA Systems. IEEE Transactions on Power Systems, 2008. 23(4): p. 1836-1846. 6. Netkachov, A., Popov, P., Salako, K. Quantification of the Impact of Cyber Attack in
Critical Infrastructures. in 1st International Workshop on Reliability and Security Aspects for Critical Infrastructure Protection (ReSA4CI 2014). 2014 Florence, Italy (co-located with SAFECOMP 2014): Springer International Publishing.
7. US-CERT, Recommended Practice: Improving Industrial Control Systems Cybersecurity with Defense-In-Depth Strategies. 2009, US-CERT. p. 44.
8. Krautsevich, L., F. Martinelli, and A. Yautsiukhin. Towards Modelling Adaptive Attacker's Behaviour. in Foundations and Practice of Security - 5th International Symposium (FPS 2012), revised selected papers. 2012. Montreal, QC, Canada.