City, University of London Institutional Repository
Citation
: Saunders, L. J., Russell, R. A., Kirwan, J., McNaught, A. and Crabb, D. P.
ORCID: 0000-0001-8754-3902 (2014). Examining Visual Field Loss in Patients in Glaucoma
Clinics During Their Predicted Remaining Lifetime. Investigative Ophthalmology & Visual
Science, 55(1), pp. 102-109. doi: 10.1167/iovs.13-13006
This is the published version of the paper.
This version of the publication may differ from the final published
version.
Permanent repository link:
http://openaccess.city.ac.uk/20280/
Link to published version
: http://dx.doi.org/10.1167/iovs.13-13006
Copyright and reuse:
City Research Online aims to make research
outputs of City, University of London available to a wider audience.
Copyright and Moral Rights remain with the author(s) and/or copyright
holders. URLs from City Research Online may be freely distributed and
linked to.
City Research Online:
http://openaccess.city.ac.uk/
publications@city.ac.uk
Examining Visual Field Loss in Patients in Glaucoma
Clinics During Their Predicted Remaining Lifetime
Luke J. Saunders,
1Richard A. Russell,
1,2James F. Kirwan,
3Andrew I. McNaught,
4and David P. Crabb
11Department of Optometry and Vision Science, City University London, United Kingdom
2NIHR Biomedical Research Centre for Ophthalmology, Moorfields Eye Hospital NHS Foundation Trust and UCL Institute of
Ophthalmology, London, United Kingdom
3Department of Ophthalmology, Queen Alexandra Hospital, Portsmouth, United Kingdom
4Gloucestershire Hospitals NHS Foundation Trust, Cheltenham, and Cranfield University, Bedford, United Kingdom
Correspondence: David P. Crabb, Department of Optometry and Visual Science, City University London, Northampton Square, London, EC1V 0HB, UK;
d.crabb@city.ac.uk.
Submitted: August 7, 2013 Accepted: November 16, 2013
Citation: Saunders LJ, Russell RA, Kirwan JF, McNaught AI, Crabb DP. Examining visual field loss in patients in glaucoma clinics during their pre-dicted remaining lifetime.Invest Ophthalmol Vis Sci. 2014;55:102– 109. DOI:10.1167/iovs.13-13006
PURPOSE.To evaluate the proportion of patients in glaucoma clinics progressing at rates that
would result in visual disability within their expected lifetime.
METHODS.This retrospective study used visual field (VF) series of at least 3 years’ duration from 3790 UK patients in glaucoma clinics calculating rates of loss for each eye using linear regression of mean deviation (MD) over time. Residual life expectancies derived from the UK Office of National Statistics actuarial tables for each patient were combined with these rates to estimate predicted MDs at end of expected lifetime. The proportion of patients projected to progress to visual impairment (MD:14 dB or worse) or statutory blindness (MD:22 dB or worse) in both eyes before end of expected lifetime was calculated.
RESULTS.Only 3.0% (95% confidence interval [CI] 2.7%–3.4%) of patient eyes progressed at faster than1.5 dB/year (n¼7149 eyes). Of those patients with both eyes followed, 5.2% (CI 4.5%–6.0%) were predicted to progress to statutory blindness, with a further 10.4% (CI 9.4%– 11.4%) reaching visual impairment in their lifetime. More than 90% (CI 85.7%–94.3%) of patients predicted to progress to statutory blindness, had an MD worse than6 dB in at least one eye at presentation.
CONCLUSIONS.This modeling exercise indicates that most patients in glaucoma clinics are not at
high risk of progressing to statutory blindness. The likelihood of patients suffering impairment in their lifetimes is linked to VF loss at presentation, which illuminates the importance of reliably detecting significant VF defects in primary care.
Keywords: glaucoma, visual fields, perimetry, visual function, life expectancy
T
reatments for glaucoma attempt to slow the rate of visual field (VF) loss, which normally involves reducing the only known modifiable risk factor for the condition, the IOP.1Themain aim of treatment is to avert the threat of blindness and ensure that a patient’s visual function, and quality of life, remains unaffected within his or her lifetime. Once diagnosed, all patients normally need lifelong treatment and monitoring so that any worsening of visual impairment can be detected and treatment can be changed accordingly. As a result, monitoring patients with glaucoma represents a major workload for eye services. Visual field testing (perimetry) is the only direct method for monitoring functional change in patients, and thus, to assess whether a treatment is succeeding in preventing future visual impairment. Levels of VF loss can be summarized using the mean deviation (MD) index. The MD is a weighted average of the differences between the measured and normal age-matched sensitivity values across the whole VF; the more negative the MD, the worse the level of VF damage. In the United States, statutory (legal) blindness continues to be defined as best-corrected visual acuity of 20/200 or worse, but also includes a definition based on VF limitation.2 In
particular, the widest diameter of the VF, in the better eye, must subtend an angle at least 20 degrees. The US Social Security
Administration (SSA) has recently determined that automated perimetry can be used for the latter, with an MD of22 dB in the better eye corresponding to the VF definition of statutory blindness (a landmark used recently by another study).3
Many patients newly diagnosed with glaucoma are not at a high risk of blindness. Studies based on retrospective chart reviews have found that the proportion of patients that progressed to blindness during follow-up ranged from approx-imately 6% to 13%.4–6 However, these studies used data
collected on manual perimetry, were based on relatively small numbers (all fewer than 300 patients) and were all carried out more than 10 years ago. Other estimates for VF loss in predicted lifetime can be extrapolated from more recently conducted prospective studies. The Early Manifest Glaucoma Trial (EMGT) found that the median progression rate of MD, even in patients without treatment, was slower than0.5 decibels (dB) per year7; as an example, a patient with little VF damage at
diagnosis (say,2 dB) would take 40 years to reach an MD of 22 dB at this rate of decay, assuming a linear rate of VF deterioration (progression). Of course, 40 years is likely to exceed most patients’ expected lifetimes when it is considered that the onset of glaucoma is usually toward the end of patients’ lives. Obviously, there is large variation in rates of VF loss and
Copyright 2014 The Association for Research in Vision and Ophthalmology, Inc.
faster progressing patients are at greatest risk of visual impairment, yet the prevalence of these‘‘fast progressors’’in clinical practice is unclear. Cohort studies from Canada and California have indicated that less than approximately 5% of patients progress at a rate of 1.5 dB/year or worse.8–10
However, results from retrospective studies, which may reflect clinical practice more closely but are less well controlled, are less consistent; results from the New York Progression Study suggest that the prevalence of fast progressors ranges from 9% to over 25% (with the use of different exclusion criteria).11–13
In addition, a recent review of clinical data from Sweden by Heijl and colleagues14 recorded more than 15% of patients
progressing at a rate faster than1.5 dB/year.
Taking treatment and monitoring costs into account, it is extremely important that resources are prioritized in favor of those patients who are at greater risk of suffering significant visual disability in their lifetime.15In this context, information
about rate (speed) of VF loss over a period of follow-up is clinically useful. Recent research has emphasized the clinical importance of this approach by recommending frequency and pattern of VF testing required over time so as to establish reasonable estimates of these rates.16–19 Once the rate of VF
loss has been established, a natural next step is to consider the likelihood of a patient suffering visual disability within their expected lifetime. Incorporating estimates of life expectancy adjusted for age (residual life expectancy) in glaucoma care was suggested by Wesselink et al.,20but before now has not
been implemented. Therefore, in this study, we attempted to estimate the proportion of patients under clinical care in glaucoma clinics that progress at a rate quick enough to result in serious visual impairment in their expected lifetime.
M
ATERIALS ANDM
ETHODSThree separate Medisoft (Medisoft Ltd., Leeds, UK) VF databases from glaucoma clinics in Moorfields Eye Hospital in London, Cheltenham General Hospital Gloucestershire Eye Unit and Queen Alexandra Hospital in Portsmouth were made available for this retrospective study. The databases contained a total of 402,357 anonymized VFs from 75,857 patients recorded between 1989 and 2012. The study adhered to the tenets of the Declaration of Helsinki, was approved by a research governance committee of City University London and all anonymized data were transferred to a secure computer database. Only VFs recorded on the Humphrey Visual Field Analyzer (HFA; Carl Zeiss Meditec, Dublin, CA) with the 24-2 test pattern, a Goldmann size III stimulus, and the SITA (SITA Standard or SITA Fast) testing algorithm were included in the study. Unreliable VFs, defined here to have an HFA false-positive or false-negative score of 33% or more, or an HFA fixation loss score of 20% or more were excluded; 29.6% of the SITA Standard and Fast VF records were excluded from the study owing to these reliability criteria.
This study centered on VF progression, and, to be included in the study, one of each patient’s eyes had to have a VF series that was at least 3 years long, with at least five VFs after discounting the first VF in order to attempt to obviate learning effects (improvements in results through the patient becoming more practiced at taking the tests).21–23The first recorded MD,
having excluded the initial VF for learning effects, is subsequently referred to as the baseline MD, whereas the last recorded MD in the follow-up is denoted as the final MD. The study considered only VF data and no other clinical informa-tion. Therefore, it was not possible to confirm whether individuals in the database were clinically diagnosed with glaucoma or were glaucoma suspects. Thus, the baseline VF of each patient had to have an HFA MD or HFA pattern SD value
outside the established HFA 95% normal limits in at least one eye. Given that individuals had measurable VF damage at baseline and were followed regularly for at least 3 years in these glaucoma clinics, it is reasonable to assume that the vast majority in this study had glaucoma. Patients younger than 35 years were not included in the study.
Rates of MD loss were calculated in decibels per year (dB/y) by using ordinary least squares regression. It was assumed that the rate of change in MD would remain constant for the remainder of a patient’s expected lifetime. Therefore, the MD at expected death was calculated as the observed rate of loss multiplied by the patient’s residual life expectancy (see Fig. 1). It is important to use residual life expectancies to take into account patient age rather than use population age statistics, as the probability of dying at a particular age will not remain constant across all ages; for instance, the probability of a 10-year-old living to 78 is very different from an individual who has already lived to 76. Median life expectancies, based on age and sex, were collected from the UK Office of National Statistics24; these were derived using the latest available
English census data (2001) and survey data to estimate expectancies valid for the 2008 to 2010 period.
When assessing visual disability in a patient’s lifetime, it is necessary to consider the VF loss in both eyes; a damaged VF in one eye will not necessarily impact on the overall visual function of a patient if the other eye remains healthy.25
Methods for classifying overall VF damage into ‘‘moderate’’or
‘‘severe’’abound,26–28 but few offer thresholds that have an
evidence base underpinning their link to visual impairment or offer any practical meaning to a patient. Nevertheless, recent results suggest that a patient with an MD less than14 dB in their‘‘better’’eye (the eye with the least-damaged VF) is highly unlikely to satisfy the vision component of legal fitness to drive in the UK.29Hence, this threshold was used as a benchmark for
‘‘visual impairment’’ in the current study. A second MD benchmark for ‘‘statutory blindness’’ equal to 22 dB, as recommended by the US SSA,2was also used. To be classified
as having visual impairment or statutory blindness, both patient eyes had to reach the necessary levels of VF loss. If patients had fewer than three VFs performed in one of their eyes, then their baseline MDs were recorded and the eyes were either deemed to be stable (i.e., progressing at a rate of 0 dB/y) or progressing (at a rate of1.5 dB/y) representing a‘‘best-’’
and ‘‘worst-’’case scenario, respectively. In the event of no recorded VF for the other eye, the eye was recorded as either visually healthy for the ‘‘best-case scenario’’ or blind in the
‘‘worst-case scenario.’’The open-source statistical environment
R30was used for all statistical analyses.
R
ESULTSThe characteristics of the study sample of 3790 patients are given in Table 1.
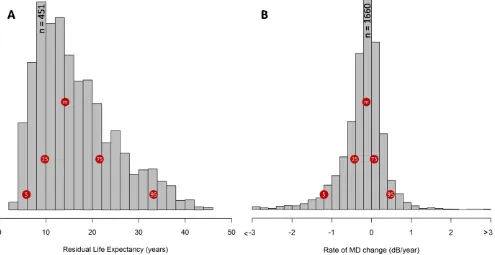
Figures 2A and 2B show the distribution of patient eye follow-up times, patient residual life expectancies, and progression rates in all eyes, respectively. It is apparent from Figure 2B that the vast majority of eyes progressed at a rate between 60.5 dB/y (74%–95% binomial confidence interval [CI]: 73%–75%). A small proportion of patient eyes progressed at a rate worse than1 dB/y (7.5% CI: 6.9%–8.2%) and only 3.0% (CI: 2.7%–3.4%) of eyes progressed at faster than1.5 dB/ y. It is worth noting that a considerable number of eyes recorded positive MD rates (33.3% CI: 32.2%–34.4%).
Of the 3359 patients with a VF series from both eyes (Table 2, Fig. 3; see Supplementary Material Clip S1 for an animated version of Fig. 3), only 5.2% progressed to statutory blindness (both eyes progressing to an MD worse than22 dB) with a
further 10.4% progressing to visual impairment (both eyes progressing to an MD level of worse than 14 dB) in their expected residual lifetime. The‘‘best-case scenario’’produced similar results to those just considering eyes with two series, but under the‘‘worst-case scenario,’’the number of patients at risk of statutory blindness increased to 7.1%, and a further 11.5% were at risk of visual impairment (Table 2). Interestingly, almost half of the patients with both eyes followed had at least one eye with a positive rate of change (49.0% CI: 47.3–50.7). When just patients with series in both eyes tested were considered, 159 of the 175 patients (90.9% CI: 86.6%–95.1%)
who reached statutory blindness had an MD worse than6 dB in at least one eye at baseline; this MD level is equivalent to what is considered to be at least a‘‘moderate defect’’for one criterion of the Hodapp-Parrish-Anderson index.26 Patients
who were predicted to progress to statutory blindness were approximately 70% more likely to have moderate damage (MD worse than6 dB) in at least one eye at baseline than patients not predicted to progress to this stage (þLikelihood Ratio: 1.7; 95% CI: 1.6–1.8). Put differently, only 1.1% (CI: 0.6%–1.6%) of the patients who were likely diagnosed with early VF defects, with an MD better than6 dB in both eyes (44% of the study
FIGURE1. A schematic illustrating the analysis conducted in this study. Visual field series from the left and right eyes of a patient were used to estimate a linear rate of loss in each eye (dB/y). The patient’s median life expectancy was obtained from the UK Office of National Statistics,24and
was used to predict the MD of each eye at expected time of death. In this illustration, the right eye was anticipated to progress into the statutory blindness stage by the end of the patient’s life. However, given that the left eye is progressing less quickly and has less VF damage at the outset, this patient would be unlikely to experience severe visual disability in the patient’s lifetime.
TABLE1. The Demographics of Patients Analyzed in the Study
Measure
Patients With Series in Both Eyes,n¼3359
Patients With a Series in One Eye Only,n¼431
No. of patients with glaucoma (VF defects) in both eyes (%) 2212 (65.9) NA
No. of female patients (%) 1684 (50.1) 228 (52.9)
No. of patients from London (%) 3124 (93.0) 413 (95.8)
No. of patients from Cheltenham (%) 183 (5.4) 10 (2.3)
No. of patients from Portsmouth (%) 52 (1.5) 8 (1.9)
Median no. VFs recorded (IQR) 6 (5–8) 6 (5–8)
Median follow-up time (IQR) 7.1 y (5.2–9.1) 7.2 y (5.5–8.9)
Median baseline age (IQR) 65 y (56–72) 66 y (57–75)
Median final age (IQR) 71 y (62–78) 72 y (63–80)
Median residual life expectancy from final age (IQR) 16 y (11–22) 14 y (9–21)
Median baseline MD in better eye* (IQR) 2.6 dB (5.2 to1.1) 7.0 dB (11.9 to3.7)
Median baseline MD in worse eye* (IQR) 6.9 dB (12.5 to3.8)
Median final MD in better eye* (IQR) 3.4 dB (6.8 to1.3) 8.4 dB (14.6 to4.7)
Median final MD in worse eye* (IQR) 8.7 dB (14.8 to4.6)
Median rates of loss in better eye* (IQR) 0.12 dB/y (0.38–0.07) 0.19 dB/y (0.54–0.05)
Median rates of loss in worse eye* (IQR) 0.15 dB/y (0.46–0.08)
[image:4.612.117.491.63.291.2]population), progressed to statutory blindness. Strikingly, almost 60% (CI: 52.0%–66.4%) of patients progressing to statutory blindness had one eye with an MD already worse than 14 dB in at least one eye at baseline.
D
ISCUSSIONThis retrospective study of a very large number of VFs collected in different clinics over a 23-year period has provided a number of interesting findings. The modeling indicated that a small proportion of patients under clinical care in glaucoma clinics in the United Kingdom were estimated to be at high risk of progressing to a level of statutory blindness in both eyes during their predicted residual lifetime. The proportion of patients predicted to be at risk of progressing to statutory blindness in both eyes within the study was 5.2%, although this figure may be as high as 7.1% (‘‘worst-case scenario’’) depending on the reasons behind testing only single eyes in some patients. These results, from the perspective of the burden of diagnosed glaucoma, seem more optimistic than those of previous studies. For example, Kwon et al.5predicted
from their study that the number of patients becoming legally blind over a follow-up of 22 years could be as high as 19%, whereas others have also predicted higher proportions.4,6The
different methodologies used in these studies conducted more than a decade ago are likely to explain the different results. For example, the previous studies did not use a modeling approach, were based on far fewer patients, used different definitions for legal blindness, and because they used
‘‘retrospective chart review’’ were very likely subject to selection bias. At the same time, it is tempting to explain the differences with the idea that modern therapies are improving patient prognosis in glaucoma. Despite small numbers reaching statutory blindness, it should be noted that a significant minority of patients (approximately one in six patients) in our study were predicted to develop VF loss that could affect their quality of life; for example, a level of impairment that would likely result in loss of a driving license in the United Kingdom.29
Interestingly, the very wide distribution of rates of VF loss shown in Figure 2B is reminiscent of similar results shown in controlled prospective studies.7,9However, the proportion of
eyes that are very rapidly progressing appears substantially smaller than those of many other retrospective studies. The 3% of eyes highlighted in our study as progressing at faster than 1.5 dB/y was in contrast to the figures from the recent findings from the study by Heijl et al.14 in Sweden that
estimated that 15% progressed at a rate faster than1.5 dB/y and the New York Progression Study, which concurred that
FIGURE2. (A) Distribution of residual life expectancies for all 3790 patients included in the study and (B) the rate of progression of MD ( dB/y) from all 7149 eyes. The distribution of life expectancies is positively skewed as a result of the increased prevalence of glaucoma in older patients. Thered circlesindicate the median (m) and other quantiles.
TABLE2. The Proportion of Patients Likely to Suffer VF Impairment in the Course of Their Lifetime
Visual Impairment at Death
% No Impairment (95% CI*)
% Visual Impairment (95% CI*)
% Statutory Blindness (95% CI*)
Including patients with a series for each eye only,n¼3359 84.4 (83.2–85.6) 10.4 (9.4–11.4) 5.2 (4.5–6.0)
All patients best-case scenario,n¼3790 84.9 (83.7–86.1) 10.0 (9.0–11.0) 5.1 (4.3–5.8)
All patients worst-case scenario,n¼3790 81.5 (80.2–82.8) 11.5 (10.4–12.5) 7.1 (6.2–7.9)
* 95% CIs were calculated using the normal approximation of a binomial distribution.
[image:5.612.61.556.68.323.2]this proportion was in excess of 9%.11–13 There are several
possible reasons behind this difference. First, a sizeable proportion of pseudoexfoliation glaucoma (associated with faster disease deterioration7) was present in the Heijl et al.14
study, not as commonly seen in the United Kingdom. Another possible cause is that the patients in these studies were diagnosed with more advanced glaucoma, although it is not really known whether those with advanced defects progress more quickly or whether they have reached a stage of more advanced impairment because they presented later. Our estimates of the‘‘fast progressor’’prevalence was more akin to those results from controlled clinical cohort studies.8–10
Remarkably, approximately half of all the patients sampled experienced an‘‘improved’’MD in at least one eye during their follow-up, as can be seen in Figure 3. These positive slopes can be explained by a combination of high variability associated with VF measurements31–33 and learning effects, which can
persist over 10 or more tests in some individuals.22,23 We
attempted to control for the latter by adopting the common practice of removing each patient’s first recorded VF. However, there evidently remains a substantial difficulty in measuring rates of MD change. This has important implications for the utility of VF testing in clinical practice. Patients who struggle with VF testing and yield noisy measurements, or patients who just simply get better at doing tests over time, should be identified as soon as possible because they are using resources that might be better used elsewhere.
Approximately 90% of those patients predicted to be at risk of statutory blindness in their residual expected lifetime already had noteworthy VF damage (MD worse than6 dB) in at least one eye at baseline (see Fig. 3). Most of these patients had advanced impairment (60% worse than14 dB in at least one eye) at baseline. These statistics strongly suggest that a major contributory factor for the risk of future visual impairment, or statutory blindness, from glaucoma is late presentation of the disease. Other studies support this important notion34,35 and some have explored it in more
detail, highlighting the real threat to blindness associated with the late detection of the disease.36,37Indeed, given this was a
study necessarily limited only to patients who were under clinical care, these results suggest that it is the many undiagnosed glaucoma sufferers who are at the greatest risk of blindness. This finding raises an interesting debate about how best to balance the use of VF resources in primary and secondary care, especially because we have estimated that only a minority of diagnosed patients in clinical care are in danger of being severely impacted by their condition during their lifetime. Specifically, it suggests that more resources should be directed toward detecting and case finding glaucoma. Moreover, although glaucoma is a chronic disease, our data highlight that those affected are, of course, typically elderly and have low residual life expectancy; the results from this study should reinforce the need for clinicians to consider life expectancy in their clinical management of the disease.20
Results from clinical trials and prospective studies primarily inform clinical practice and decisions about health service delivery. Still, retrospective analysis of very large volumes of data collected from the everyday clinical milieu over long periods of time can provide interesting material and informa-tion to develop new hypotheses, as this report shows. It is already known that volunteers for prospective studies in glaucoma have better adherence to prescribed therapy than those in routine medical care,38 so prospective studies and
trials may even misrepresent the routine clinical situation. However, any retrospective study, including our own, will have issues with missing or incomplete data, although, in this case, this was largely offset by sheer volume of data; a significantly larger number of VFs were used compared with other past
retrospective studies. One consequent limitation of the retrospective study was that a small proportion of the patients studied had complete series in only one eye (431 of 3790 patients included in the study). Unfortunately, the reasons behind the other eye not being followed were disparate: the eye may have either had extensive damage that rendered VF tests uninformative, or else it may have been healthy and not tested frequently enough to meet the inclusion criteria. We tried to cater to both of these possibilities by providing both the ‘‘worst-case scenario’’ and ‘‘best-case scenario’’ results. Another issue associated with this retrospective analysis concerns the fact that full patient records were unavailable or not considered. As a result, analyses were based only on age, sex, and VF data. Some of the faster-progressing patients in our sample may have therefore had rapidly lowering MDs as a result of concomitant age-related eye disease, principally cataract. Also, a small minority of the study sample may not have had glaucoma, but this is unlikely given all subjects were monitored at specialist glaucoma clinics over at least 3 years. Furthermore, our findings must be tempered by the possibility that the baseline fields of the patients may not have been their first VF assessment; for instance, patients may have been transferred from a different clinical center.
One strength of our study is that the thresholds chosen for visual impairment and statutory blindness have some evidence-based justification attributed to them. Reaching levels of MD worse than14 dB in both eyes has been shown to correspond highly with likely no longer being legally fit to drive in the United Kingdom, among difficulties carrying out various other visual tasks.39–44Furthermore,22 dB in both eyes is the point
at which one qualifies for statutory blindness in the United States, so represents a significant milestone for patients. However, in spite of the fact that measured sensitivities are weighted toward fixation when calculating MDs, it is, of course, possible to have preserved visual acuity under these conditions; people who are diagnosed with legal blindness can still have some useable vision. In addition, it is important to emphasize that using the MD to define visual disability does not appreciate the spatial distribution of VF damage, which is important in a patient’s visual function, and ability to carry out different tasks.39,40,42,43For example, VF loss close to fixation
is particularly important, and eyes with this damage should be treated more aggressively, especially because the likelihood of further damage in the central VF is higher.45
An assumption of our analysis involves the use of a linear rate of progression of MD over time. This may not reflect the true nature of glaucomatous deterioration given that there is some evidence to show patients tend to progress more quickly at older ages, although it is unknown whether this is a result of older age or more advanced VF deterioration.14Nevertheless,
linear regression of MDs is commonly used in clinical practice; the Glaucoma Progression Analysis software in the Humphrey Field Analyzer, for instance, presents this as ‘‘one method of Tracking Rate of Progression.’’46Furthermore, studies suggest
that linear rates of progression for summary measures are adequate,47and it is important to note that a linear decline in
decibels represents an exponential decay in retinal sensitivity; although loss of sensitivity could occur at greater than an exponential rate, no research to date has suggested that another type of model should be used to measure the rate of decay of MD. In addition, previous work has shown that a linear model of VF progression tends to provide more robust estimates of future measurements than more complex mod-els.48,49 This demonstrates a simple statistical principle that,
although more complex models tend to provide better fits of existing data, linear models tend to be more useful at predicting future change. However, it is important to be aware that this MD regression does not imply a constant rate of
sensitivity loss; a loss of 1 dB implies much more damage going from5 dB to6 dB than from25 to26 dB, as a result of the logarithmic scaling used for the measurement. It is further noteworthy that the‘‘future’’forecasts based on current linear rates of VF loss may make our estimates of future prognosis in the patients studied overly pessimistic, as treatment is usually intensified if a patient is in danger of progressing to visual disability.15On the other hand, the modeling takes no account
of concomitant eye disease, which ultimately might precipitate levels of lifetime visual disability that are worse than those shown in our results. A technical limitation of the calculations is that life expectancies used were periodic and so the study assumes that the probability of dying at a given age will remain constant over time. It was also necessary to assume that mortality rates are independent of glaucoma as a condition, although this seems reasonable given results from other studies that have specifically looked at this.50Mortality rates could be
affected by other morbidities that may be more common in individuals with glaucoma; it is further possible that fast progression rates may be symptomatic of poor general health or access to medical care, which may in turn affect life expectancy. However, more research is required to fully understand how life expectancy corresponds with rates of VF loss before this can be taken into consideration.
It is important to reflect on the generalizability of our results. First, the sample was composed only of patients from hospital care in the United Kingdom, and it should be further noted that the number of patients from hospitals in Ports-mouth and Cheltenham were considerably fewer than those from Moorfields Eye Hospital in London. Of course, there is no guarantee that patients were treated equivalently across hospitals and thus our results mostly reflect observations in Moorfields Eye Hospital. Results are not directly applicable to countries with different demographics and different health care systems. On the other hand, London is a cosmopolitan city; the 2011 Census reported that more than one-quarter of the population of London did not identify themselves as British,51so it could be postulated that there is a fair amount of
diversity among the patients, although the lack of clinical data makes it impossible to determine this for certain. Another issue with the study, particularly when focusing on the finding that worse VF loss at baseline is associated with a higher risk of blindness, is that it is assumed that various factors that may have an effect on end state of disease, such as type of glaucoma and race of patient, were relatively uniform throughout the study. Unfortunately, it was not possible to control for these variables, but it is assumed, given the quantity of the data, that the findings overall represent a reasonable population esti-mate.
In conclusion, the main result from this modeling exercise suggests that most glaucoma patients under clinical care are not in considerable danger of suffering significant visual disability in their lifetime. This report certainly indicates that the great majority of patients who are followed in glaucoma clinics in the United Kingdom have stable VFs. There is, however, enormous variability in rates of VF loss and also in levels of VF damage at presentation. Patients who are in danger of significant VF impairment in their lifetime generally present with more severe VF damage and this may indicate that more resources should be concentrated toward detecting disease before it progresses beyond early damage. We hope that these results can inform the design of better health service delivery and suggest studies that should investigate improved allocation of VF testing resources.15 Furthermore, the results from this
study illuminate very clearly the importance of reliably detecting significant VF defects, and other features of glaucoma, in primary care.37
Acknowledgments
Supported in part by the UK National Institute for Health Research Health Services & Delivery Research Programme (Project 10/2000/ 68).
Disclosure: L.J. Saunders, None; R.A. Russell, None; J.F.
Kirwan, None;A.I. McNaught, None;D.P. Crabb, None
References
1. Heijl A, Leske MC, Bengtsson B, Hyman L, Bengtsson B, Hussein M. Reduction of intraocular pressure and glaucoma progression—results from the early manifest glaucoma trial.
Arch Ophthalmol. 2002;120:1268–1279.
2. US Social Security Administration. Disability evaluation under Social Security. Available at: http://www.ssa.gov/disability/ professionals/bluebook/2.00-SpecialSensesandSpeech-Adult. htm#203. Accessed January 21, 2013.
3. Heijl A, Aspberg J, Bengtsson B. The effect of different criteria on the number of patients blind from open-angle glaucoma.
BMC Ophthalmol. 2011;11:31.
4. Chen PP. Blindness in patients with treated open-angle glaucoma.Ophthalmology. 2003;110:726–733.
5. Kwon YH, Kim C, Zimmerman MB, Alward WLM, Hayreh SS. Rate of visual field loss and long-term visual outcome in primary open-angle glaucoma. Am J Ophthalmol. 2001;132: 47–56.
6. Hattenhauer MG, Johnson DH, Ing HH, et al. The probability of blindness from open-angle glaucoma. Ophthalmology. 1998; 105:2099–2104.
7. Heijl A, Bengtsson B, Hyman L, Leske MC. Natural history of open-angle glaucoma.Ophthalmology. 2009;116:2271–2276. 8. Medeiros FA, Zangwill LM, Mansouri K, Lisboa R, Tafreshi A,
Weinreb RN. Incorporating risk factors to improve the assessment of rates of glaucomatous progression. Invest
Ophthalmol Vis Sci. 2012;53:2199–2207.
9. Chauhan BC, Mikelberg FS, Artes PH, et al. Canadian glaucoma study: 3. Impact of risk factors and intraocular pressure reduction on the rates of visual field change. Arch Ophthal-mol. 2010;218:1249–1255.
10. Reis ASC, Artes PH, Belliveau AC, et al. Rates of change in the visual field and optic disc in patients with distinct patterns of glaucomatous optic disc damage.Ophthalmology. 2012;119: 294–303.
11. De Moraes CG, Prata TS, Tello C, Ritch R, Liebmann JM. Glaucoma with early visual field loss affecting both hemifields and the risk of disease progression.Arch Ophthalmol. 2009; 127:1129–1134.
12. Prata TS, De Moraes CG, Teng CC, Tello C, Ritch R, Liebmann JM. Factors affecting rates of visual field progression in glaucoma patients with optic disc hemorrhage. Ophthalmol-ogy. 2010;117:24–29.
13. Teng CC, De Moraes CG, Prata TS, Tello C, Ritch R, Liebmann JM.b-Zone parapapillary atrophy and the velocity of glaucoma progression.Ophthalmology. 2010;117:909–915.
14. Heijl A, Buchholz P, Norrgren G, Bengtsson B. Rates of visual field progression in clinical glaucoma care.Acta Ophthalmol
Scand. 2012;91:406–412.
15. Heijl A. The times they are a-changin’: Time to change glaucoma management.Acta Ophthalmol Scand. 2013;91:92– 99.
16. Chauhan BC, Garway-Heath DF, Goni FJ, et al. Practical recommendations for measuring rates of visual field change in glaucoma.Br J Ophthalmol. 2008;92:569–573.
18. Crabb DP, Garway-Heath DF. Intervals between visual field tests when monitoring the glaucomatous patient: wait and
see.Invest Ophthalmol Vis Sci. 2012;53:2770–2776.
19. Jansonius NM. On the accuracy of measuring rates of visual field change in glaucoma. Br J Ophthalmol. 2010;94:1404– 1405.
20. Wesselink C, Stoutenbeek R, Jansonius NM. Incorporating life expectancy in glaucoma care.Eye. 2011;25:1575–1580. 21. Wild JM, Dengler-Harles M, Searle AET, O’Neill EC, Crews SJ.
The influence of the learning effect on automated perimetry in patients with suspected glaucoma. Acta Ophthalmol Scand. 1989;67:537–545.
22. Heijl A, Lindgren G, Olsson J. The effect of perimetric experience in normal subjects. Arch Ophthalmol. 1989;107: 81–86.
23. Heijl A, Bengtsson B. The effect of perimetric experience in patients with glaucoma.Arch Ophthalmol. 1996;114:19–22. 24. Office of National Statistics. England, Interim Life Tables,
1980–82 to 2008–10. Available at: http://ons.gov.uk/ons/rel/ lifetables/interim-life-tables/2008-2010/rft-ilt-eng-2008-10.xls. Accessed August 31, 2012.
25. Jampel HD, Friedman DS, Quigley HA, Miller R. Correlation of the binocular visual field with patient assessment of vision.
Invest Ophthalmol Vis Sci. 2002;43:1059–1067.
26. Hodapp E, Parrish RKI, Anderson DR. Clinical Decisions in
Glaucoma. St Louis: The CV Mosby Co.; 1993.
27. Brusini P, Filacorda S. Enhanced Glaucoma Staging System (GSS 2) for classifying functional damage in glaucoma. J
Glaucoma. 2006;15:40–6.
28. Susanna R Jr, Vessani RM. Staging glaucoma patient: why and
how?Open Ophthalmol J. 2009;3:59–64.
29. Saunders LJ, Russell RA, Crabb DP. Practical landmarks for visual field disability in glaucoma.Br J Ophthalmol. 2012;96: 1185–1189.
30. R Development Core Team.R: A Language and Environment
for Statistical Computing. Vienna, Austria: R Foundation for
Statistical Computing; 2013. Available at: http://www. R-project.org.
31. Heijl A, Lindgren G, Olsson J. Normal variability of static perimetric threshold values across the central visual field.
Arch Ophthalmol. 1987;105:1544–1549.
32. Turpin A, McKendrick AM. What reduction in standard automated perimetry variability would improve the detection of visual field progression?Invest Ophthalmol Vis Sci. 2011; 52:3237–3245.
33. Russell RA, Crabb DP, Malik R, Garway-Heath DF. The relationship between variability and sensitivity in large-scale longitudinal visual field data.Invest Ophthalmol Vis Sci. 2012; 53:5985–5990.
34. Grant WM, Burke JFJ. Why do some people go blind from glaucoma?Ophthalmology. 1982;89:991–998.
35. Oliver JE, Hattenhauer MG, Herman D, et al. Blindness and glaucoma: a comparison of patients progressing to blindness from glaucoma with patients maintaining vision. Am J
Ophthalmol. 2002;133:764–772.
36. Kotecha A, Fernandes S, Bunce C, Franks WA. Avoidable sight loss from glaucoma: is it unavoidable?Br J Ophthalmol. 2012; 96:816–820.
37. Henson DB, Thampy R. Preventing blindness from glauco-ma—better screening with existing tests should be the priority.BMJ. 2005;331:120–121.
38. Henson DB, Shambhu S. Relative risk of progressive glau-comatous visual field loss in patients enrolled and not enrolled in a prospective longitudinal study.Arch Ophthalmol. 2006; 124:1405–1408.
39. Kooijman AC, Brouwer WH, Coeckelbergh TRM, et al. Compensatory viewing training improves practical fitness to drive of subjects with impaired vision.Vis Impair Res. 2004;6: 1–27.
40. Kotecha A, O’Leary N, Melmoth D, Grant S, Crabb DP. The functional consequences of glaucoma for eye-hand coordina-tion.Invest Ophthalmol Vis Sci. 2009;50:203–213.
41. Smith ND, Crabb DP, Garway-Heath DF. An exploratory study of visual search performance in glaucoma. Ophthalmic
Physiol Opt. 2011;31:225–232.
42. Black AA, Wood JM, Lovie-Kitchin JE. Inferior field loss increases rate of falls in older adults with glaucoma.Optom
Vis Sci. 2011;88:1275–1282.
43. Tabrett DR, Lathan K. Important areas of the central binocular visual field for daily functioning in the visually impaired.
Ophthalmic Physiol Opt. 2012;32:156–163.
44. Glen FC, Crabb DP, Smith ND, Burton R, Garway-Heath DF. Do patients with glaucoma have difficulty recognising faces?
Invest Ophthalmol Vis Sci. 2012;53:3629–3637.
45. Membrey WL, Poinoosaumy DP, Bunce C, Fitzke FW, Hitchings RA. Comparison of visual field progression in patients with normal pressure glaucoma between eyes with and without visual field loss that threatens fixation.Br J Ophthalmol. 2000; 84:1154–1158.
46. Carl Zeiss Meditec, Inc. Humphrey Glaucoma Progression Analysis. (GPA) Software—An advanced approach to monitor-ing disease progression. Available at: http://www.zeiss.de/ C 1 2 5 6 7 9 E 0 0 5 2 5 9 3 9 / E m b e d Ti t e l I n t e r n / O F S _ W h i t e _ Paper16_eng/$File/OFS_whitepaper16_eng.pdf. Accessed Oc-tober 6, 2013.
47. Bengtsson B, Patella VM, Heijl A. Prediction of glaucomatous visual field loss by extrapolation of linear trends. Arch
Ophthalmol. 2009;127:1610–1615.
48. McNaught AI, Crabb DP, Fitzke FW, Hitchings RA. Modelling series of visual fields to detect progression in normal-tension glaucoma.Graefes Arch Clin Exp Ophthalmol. 1995;233:750– 755.
49. Bryan SR, Vermeer KA, Eilers PHC, Lemij HG, Lesaffre EMEH. Robust and censored modeling and prediction of progression in glaucomatous visual fields.Invest Ophthalmol Vis Sci. 2013; 54:6694–6700.
50. Grodum K, Heijl A, Bengtsson B. Glaucoma and mortality.
Graefes Arch Clin Exp Ophthalmol. 2004;242:397–401.
51. Office of National Statistics. Ethnicity and national identity in England and Wales 2011. Available at: http://www.ons.gov.uk/ ons/dcp171776_290558.pdf. Accessed November 3, 2013.