City, University of London Institutional Repository
Citation
:
Konstantakopoulou, E., Rodriguez-Carmona, M. and Barbur, J. L. (2012). Processing of color signals in female carriers of color vision deficiency. Journal of vision, 12(2), p. 11. doi: 10.1167/12.2.11This is the published version of the paper.
This version of the publication may differ from the final published
version.
Permanent repository link:
http://openaccess.city.ac.uk/14886/Link to published version
:
http://dx.doi.org/10.1167/12.2.11Copyright and reuse:
City Research Online aims to make research
outputs of City, University of London available to a wider audience.
Copyright and Moral Rights remain with the author(s) and/or copyright
holders. URLs from City Research Online may be freely distributed and
linked to.
Processing of color signals in female carriers of color
vision de
fi
ciency
Applied Vision Research Centre, The Henry Wellcome Laboratories for Vision Sciences, City University London, Northampton Square, London, UK
Evgenia
Konstantakopoulou
Applied Vision Research Centre, The Henry Wellcome Laboratories for Vision Sciences, City University London, Northampton Square, London, UK
Marisa
Rodriguez-Carmona
Applied Vision Research Centre, The Henry Wellcome Laboratories for Vision Sciences, City University London, Northampton Square, London, UK
John L.
Barbur
The aim of this study was to assess the chromatic sensitivity of carriers of color deficiency, specifically in relation to dependence on retinal illuminance, and to reference these findings to the corresponding red–green (RG) thresholds measured in normal trichromatic males. Thirty-six carriers of congenital RG color deficiency and 26 normal trichromatic males participated in the study. The retinal illuminance was estimated by measuring the pupil diameter and the optical density of the lens and the macular pigment. Each subject’s color vision was examined using the Color Assessment and Diagnosis (CAD) test, the Ishihara and American Optical pseudoisochromatic plates, and the Nagel anomaloscope. Carriers of deuteranopia (D) and deuteranomaly (DA) had higher RG thresholds than male trichromats (p G0.05). When referenced to male trichromats, carriers of protanomaly (PA) needed 28% less color signal strength; carriers of D required
È60% higher thresholds at mesopic light levels. Variation in the L:M ratio and hence the absolute M-cone density may be the principal factor underlying the poorer chromatic sensitivity of D carriers in the low photopic range. The increased sensitivity of PA carriers at lower light levels is consistent with the pooling of signals from the hybrid MVand the M cones and the subsequent stronger inhibition of the rods. The findings suggest that signals from hybrid photopigments may pool preferentially with the spectrally closest“normal”pigments.
Keywords: heterozygous carriers, color vision, anomalous trichromacy, dichromacy, CAD test
Citation:Konstantakopoulou, E., Rodriguez-Carmona, M., & Barbur, J. L. (2012). Processing of color signals in female carriers of color vision deficiency.Journal of Vision, 12(2):11, 1–11, http://www.journalofvision.org/content/12/2/11, doi:10.1167/12.2.11.
Introduction
Congenital red–green (RG) color vision deficiencies are inherited in an X-linked manner. The genes that specify human middle (M)- and long (L)-wavelength-sensitive cone pigments are localized at Xq28 on the X chromo-some (Nathans, Piantanida, Eddy, Shows, & Hogness,
1986) and express dominantly in males. Mothers of color-deficient males are obligate carriers of one copy of the RG color deficient gene and are known as heterozygous carriers; one of their X chromosomes is carrying the “normal” gene, whereas the other chromosome carries the gene coding for RG deficiency.
To balance the expression of X-linked genes, one of the X chromosomes is silenced very early during female mammalian development (Lyon, 1961). The choice of
which X chromosome is inactivated in each cell appears to be random, but once silencing has taken place for one chromosome, the inactivation remains stable and every descendant cell follows the same inactivation pattern as its precursor cell. The normal expectation would be for each female to express half-maternal and half-paternal X chromosome genes. Evidence, however, exists for skewed X inactivation patterns, where more cells express genes preferentially from a single chromosome. As a result, approximately 5% of the female population show X inactivation ratios beyond 15:85 (Amos-Landgraf et al.,
2006). X chromosome inactivation rates have also been shown to vary with age, with more skewed X inactivation present in older females (Amos-Landgraf et al., 2006; Sharp, Robinson, & Jacobs, 2000).
The implications of random X inactivation for the cone pigments generated are highly dependant on the type of
the color deficiency carried. In carriers of dichromacy, the normal X chromosome codes for both M and L cones but the “deficient” chromosome codes for only one type of cone, i.e., M in carriers of protanopia (P) and L in carriers of deuteranopia (D). In anomalous trichromacy, the peak spectral responsivity of either the M or the L pigment is shifted to a different wavelength. As a result, a female carrier of anomalous trichromacy can express four spectrally distinct photopigments (Nagy, MacLeod, Heyneman, & Eisner, 1981) and can therefore exhibit a unique cone mosaic. Although it is not yet clear if such females exhibit patches of “normal” and “color-deficient” cones (Born, Grutzner, & Hemminger, 1976; Cohn, Emmerich, & Carlson,1989), or if the four types of cones are arranged randomly (Hofer, Carroll, Neitz, Neitz, & Williams, 2005; Roorda, Metha, Lennie, & Williams,
2001), it is acknowledged that the spatial arrangement of the cones could have an effect on the processing of the signals originating from the four different pigments (Sun & Shevell,2008).
Unlike carriers of anomalous trichromacy, carriers of dichromacy are expected to have reduced numbers of either L or M cones, which could shift their L:M cone ratio to extreme values. The L:M cone ratio has been shown to vary significantly among normal trichromats, ranging from 0.4:1 to 16.5:1 (Brainard et al., 2000; Carroll, Neitz, & Neitz, 2002; Hofer et al., 2005), although highly skewed ratios are relatively rare (Carroll et al., 2002). The average L:M cone ratio is È2:1, i.e., 66% L cones and 33% M cones (Carroll, McMahon, Neitz, & Neitz,2000; Cicerone & Nerger, 1989; Kremers et al., 2000; M. Neitz, Balding, McMahon, Sjoberg, & Neitz, 2006), but carriers of dichromacy can have significantly skewed ratios, often extending beyond the normal variability (Gunther & Dobkins,2002; Hofer et al.,
2005; Miyahara, Pokorny, Smith, Baron, & Baron,1998). The effect of highly skewed L:M cone ratios on color vision remains poorly understood, but some studies show a small indirect effect of cone population symmetry on cone opponency (Gunther & Dobkins,2002).
Heterozygous carriers of color vision deficiencies have variable color vision (Cohn et al., 1989; Crone, 1959; Hood, Mollon, Purves, & Jordan,2006; Jordan & Mollon,
1993; Krill & Schneiderman, 1964; Pickford, 1949; Verriest, 1972); carriers of deutan deficiency usually perform worse than carriers of protan deficiency, and normal trichromats (Hood et al.,2006; Verriest,1972) and carriers of protan deficiency show reduced sensitivity to long-wavelength lights (Yasuma, Tokuda, & Ichikawa,
1984). Given the very dissimilar underlying cone mosaics between the carriers of the various deficiencies, the processing of color signals in these females remains of great interest. The studies carried out so far remain inconclusive as to how the signals from the additional pigment contribute to color vision in carriers of anom-alous trichromacy; the presence of a fourth, separate, post-receptoral channel has been proposed (Jordan & Mollon,
1993) as an alternative to the integration of the four pigments in the three existing channels (MacLeod, 1985; Wachtler, Doi, Lee, & Sejnowski,2007). Recent modeling work indicates that the shift in Rayleigh match midpoint can provide insight into the processing of signals derived from hybrid pigments in carriers of anomalous trichro-macy (Sun & Shevell, 2008).
In this study, we measured and examined differences in chromatic sensitivity as a function of retinal illuminance in heterozygous carriers of color vision deficiency and in normal male trichromats. The overall aim of the study was to improve the understanding of the underlying neural processing of color signals in female carriers of color deficiency.
Methods
Subjects
All subjects were recruited from the families of subjects assessed routinely for color deficiency at City University London. The study adhered to the principles of the Declaration of Helsinki and the tests employed had all been approved by the university’s Research and Ethics Committee. All subjects provided informed consent before undergoing an ophthalmic assessment without pupil dilation. All subjects had healthy eyes, with no ocular pathology and no history of ocular disease, trauma, surgery, or laser treatment. All subjects were refracted appropriately, when required, for the viewing distances employed in the various tests. None of the subjects were suffering from any systemic or ocular conditions known to affect color vision. All subjects had a full color vision assessment including screening with the Ishihara and American Optical Hardy, Rand, Rittler (AO HRR) pseudoisochromatic plates and Rayleigh matches on the Nagel anomaloscope.
Color assessment and diagnosis test
contrast (LC) noise isolates the use of color signals by masking the detection of subject-specific, residual lumi-nance contrast signals that may be present in the isoluminant, color-defined test stimulus (Barbur, Harlow, & Plant, 1994). A smaller, color-defined test stimulus consists of 5 5 checks (subtending a visual angle of È0.8-) and is buried in the larger array of LC checks. The colored stimulus moves diagonally at a speed ofÈ4-/s in one of four possible directions. The subject’s task is to indicate the direction of movement of the colored stimulus by pressing one of four buttons arranged appropriately to correspond to the four directions of motion. The chance probability of a correct response is 1 in 16, as a correct response has to be reported twice in succession for each hue direction before the signal strength is decreased according to the staircase procedure. The color thresholds measured along each of the 16 hue directions examined provide the information needed to classify accurately the class of deficiency and to compute the subject’s RG and yellow–blue (YB) thresholds.
The CAD thresholds are proportional to the cone contrasts generated by the colored stimulus; the deviation from linearity is small (Rodriguez-Carmona, O’Neill-Biba, & Barbur, 2012). The results of the CAD test are expressed in “standard normal units” (SNU). One SNU is the median color signal strength for a population of 330 normal trichromats. A RG threshold of 2 SNU would indicate that a subject requires twice the RG color signal strength compared to the standard CAD normal observer, while a threshold of 0.90 would indicate better than average chromatic sensitivity.
The test stimuli were generated with 30-bit resolution on a visual display (LaCIE Electron Blue, 20W CRT monitor). Spectral and luminance calibration was carried out with a Minolta CS-2000 telespectroradiometer and an LMT-1003 luminance meter, respectively. The subject viewed the display through a hood from a distance of 2.5 m and adapted to the uniform background field for 1 to 3 min before the onset of the test. The color assessment was carried out monocularly for screen luminances of 2.6, 7.8, 26, and 65 cd/m2. This extension of the CAD test captures more information by revealing how retinal illuminance affects chromatic sensitivity (Barbur & Konstantakopoulou,2012).
Pseudoisochromatic plates
The Ishihara (38 plate edition) and AO HRR (2nd edition) pseudoisochromatic plates were administered to every subject. The tests were performed in a dark room and each book was placed on a specially designed tray at 45- angle below a Macbeth Easel lamp (Kollmorgan, Waltham, MA). The illuminance level as measured in the plane of the plate was 280 lm/m2. The examiner turned the pages and allowed the subjects to view each page for
approximately 4 s. Both tests were performed monocu-larly, at approximately 0.7 m viewing distance.
Nagel anomaloscope
The Nagel anomaloscope (Nagel Type I, Schmidt and Haensch, Berlin, Germany) was employed to establish the matching range and the Y setting of the intensity of the yellow hemifield required to match the mixture field at each extreme end of the matching range. This instrument has a visual field of 3- diameter and the subject is provided with two control knobs, one to alter the RG color mixture ratio (1R = 650 nm and 1G = 546 nm) and the other to alter the intensity of the spectrally narrow, yellow field (1Y = 589 nm). The limits of the matching range were determined first by initially allowing the observer to make four complete matches when the two half-fields appeared to be equally bright and to have the same color. Then, the examiner set a predetermined RG mixture ratio (based on the mean of the observer’s four initial matches) and the observer had to adjust the intensity of the yellow hemifield to achieve the best possible match. Using this procedure, a number of red–green mixture ratios were investigated on either side of the mean, to establish the extreme ends of the range when the subject could no longer make a complete match. Mesopic ambient illumi-nation in the testing room was achieved using a distant, low-wattage, tungsten lamp. The number of scale units between the matching limits was recorded as the matching range and the midpoint was computed from the matching limits.
Retinal illuminance
Retinal illuminance (E) was computed from knowledge of screen luminance, pupil size, and the combined trans-mittance of the lens and the macular pigment for short-wavelength (SW) light. Retinal illuminance in relation to RG chromatic sensitivity was calculated by taking into account only the area of the pupil (P) and the luminance of the screen (L), i.e.,
E¼LIP: ð1Þ
When assessing retinal illuminance in relation to YB chromatic sensitivity, the combined transmittance of the lens and the macular pigment (MP) (Tc) was also included in the calculation, i.e.,
E¼LIPI Tc: ð2Þ
system uses infrared video imaging techniques to measure the size of the pupil and to compute its center coordinates (Barbur, Thomson, & Forsyth, 1987). A pulsed, infrared illumination system is used to illuminate the iris for 4 ms within each image frame to eliminate pupil image smear caused by eye movements. The subject views a uniform display similar to that employed in the CAD test. The system is focused as the patient fixates the center of the screen and a number of pupil measurements are averaged. All measurements were taken monocularly with the subject viewing a uniform background of 2.6, 7.8, 26, and 65 cd/m2, under conditions identical to those employed for the CAD test.
The macular pigment optical density (MPOD) and the lens optical density (lens OD) were measured with the MAP test (Barbur et al., 2010). The test employs an optical filter to separate the outputs of the three phosphors into two separate components; the SW test beam is absorbed maximally by the MP and the crystalline lens, whereas the reference beam consists of long-wavelength light that is not absorbed significantly by pre-receptoral filters. The two beams are modulated sinusoidally in counterphase at 17 Hz. The test was implemented on a 17WCRT visual display driven at a frame rate of 140 Hz. The MAP test measures the spatial profile of the MPOD at a number of stimulus eccentricities (i.e., 0-, 0.8-, 1.8-, 2.8-, 3.8-, 6.8-, 7.8-). In addition, the test also calculates the average spectral absorption of the MP over the center T2.8-. This value is then used to correct for changes in retinal illuminance for blue light when measuring YB chromatic sensitivity. The test was performed monocu-larly at a viewing distance of 0.7 m.
The luminance of the SW test beam needed to cancel the perception of flicker at the largest eccentricity reflects the absorption of blue light by the lens. The average lens transmittance,TAVG, for the blue light that makes up the test beam is given by
TAVG¼
Z 760
380
TLð1ÞLBð1Þd1
Z 760
380
LBð1Þd1
; ð3Þ
where TL(1) is the spectral transmittance of the lens and LB(1) is the wavelength radiance distribution of the “blue” test beam of the MAP test. Although we cannot compute the absoluteTAVGvalue, we can estimate any changes in the subject’s average lens OD with respect to the mean density measured in young subjects. Previous experiments involving 35 subjectsG22 years of age yielded a measure of the mean luminance of the SW test beam. The OD of the lens for any subject can be measured with respect to the young subject group:
OD¼log10 Lp
Lo; ð4Þ
where Lp represents the subject’s mean test beam flicker null threshold at 7.8- eccentricity and Lo represents the median threshold value for the young subjects group at the same eccentricity (i.e., the 35 subjects G22 years old). A negative value for OD means that the subject’s lens absorption of blue light is less than the mean value for the young subject group.
Classification of the class of congenital deficiency
Classification of the female carriers followed a full color vision assessment of their offspring, including the Ishihara and AO HRR plates, the City University test, the D-15, the Nagel anomaloscope, and the CAD test. No genetic data were available to aid classification. In spite of this limitation, the use of the Nagel and CAD data ensures accurate classification of deutan- and protan-like defi-ciency. The parameters of the Rayleigh match have been frequently used to separate anomalous trichromats from dichromats (Franceschetti, 1928; M. Neitz, Neitz, & Jacobs, 1995; J. Neitz, Neitz, & Kainz,1996), as well as a classification tool for carriers of color vision deficiency (Hood et al., 2006; Jordan & Mollon, 1993). Although deuteranopes and protanopes accept any red–green mix-ture as a match, these subject subgroups are completely separable using the remaining tests. The CAD test includes classification algorithms for color vision defi-ciency based on the pattern of CAD thresholds and anomaloscope match parameters measured in 289 sub-jects; the agreement between the two tests yields a kappa statistic (k value) of 0.97 (Barbur & Rodriguez-Carmona,
2012). The very rare cases of disagreement involve subjects that make normal Nagel matches but have a small yet significant loss of chromatic sensitivity, often equivalent to the loss observed in minimum deuterano-maly. These subjects may rely on variant M- and L-cone pigment genes, which would cause reduced spectral separation without shifting significantly the midpoint between the their peak sensitivities. When this happens, the Nagel anomaloscope produces match parameters within the normal range (Barbur et al., 2008). None of the subjects investigated in this study fell into this category, with 100% agreement between CAD and Nagel classifications.
Statistical analysis
NC) was used to fit the non-linear function that describes the variation in the subject’s threshold with retinal illuminance.
Results
A total of 62 participants were recruited. The control group consisted of 26 normal trichromatic males and the female carriers were divided into four groups depending on the deficiency carried: 16 carriers of deuteranomaly (cDA), six carriers of protanomaly (cPA), seven carriers of deuteranopia (cD), and seven carriers of protanopia (cP). There were no statistically significant differences in age between the groups (all p 9 0.05). The demographic characteristics of the population are shown inTable 1.
The RG chromatic sensitivities of all groups for the 4 light levels tested are shown inFigure 1. Carriers of DA showed reduced RG chromatic sensitivity at 26 cd/m2 compared
[image:6.612.68.262.437.616.2]to trichromatic males (p = 0.015 for 26 cd/m2, p 9 0.05 for all other light levels). Carriers of D showed reduced RG chromatic sensitivity compared to male controls at 2.6 cd/m2 (p = 0.04, p 9 0.05 for all other light levels). The detection thresholds of carriers of P and PA were not significantly higher than male controls (allp 90.05). The chromatic sensitivity of carriers of PA at 26 cd/m2 correlated significantly with the Rayleigh match midpoint of their offspring (R2= 0.9,p= 0.004) but not for carriers of DA (R2 = 0.08, p = 0.34; Figure 2). All groups of carriers had comparable YB chromatic sensitivities and retinal illuminances to the male trichromats (allp90.05).
Figure 3 and Table 2 show the Rayleigh match midpoints and matching ranges of all carriers and the male trichromats. Carriers of DA showed significant shifts in match midpoint (p = 0.04) when compared to male trichromats. There were no other significant differences in the midpoints or the matching ranges between any of the carrier groups and the male trichromats.
Carriers of DA performed worse than normal trichromats on the pseudoisochromatic plates, making significantly more errors, both on the AO HRR (p= 0.001, mean = 0.7 errors, ranging from 0 to 1) and on the Ishihara plates (p = 0.001, mean = 1.9 errors, ranging from 0 to 4). Almost 50% of carriers of DA misread plate number 12
n Age (meanTSD) p
Male controls 26 51.2T14.1
cDA (carriers of deuteranomaly) 16 54.0T14.9 0.5*
cD (carriers of deuteranopia) 7 54.7T7.3 0.6*
cPA (carriers of protanomaly) 6 51.0T8.7 0.9*
cP (carriers of protanopia) 7 49.1T13.0 0.8*
[image:6.612.344.544.500.689.2]Table 1.Population demographic data.Note: *Each group of carriers was compared to the male controls.
Figure 1. RG chromatic sensitivity of cP, cPA, cDA, cD, and normal trichromatic males for each of the four light levels investigated. Individual Mann–Whitney tests compared each group of carriers to the male trichromatic group. Carriers of DA had worse RG chromatic sensitivity at 26 cd/m2(p = 0.015) and carriers of D had reduced RG chromatic sensitivity at 2.6 cd/ m2 (p = 0.04). Comparable retinal illuminances were achieved within each group for the same screen luminance adaptation level (p90.5).
and 37.5% misread plates 9 and 17. Carriers of D performed significantly worse than normal trichromats on the Ishihara plates (p = 0.001, mean = 1.3 errors, ranging from 1 to 2) but not on the AO HRR plates (p 9 0.05). More than 85% of the D carriers misread plate number 12 and approximately 29% misread plate 19.
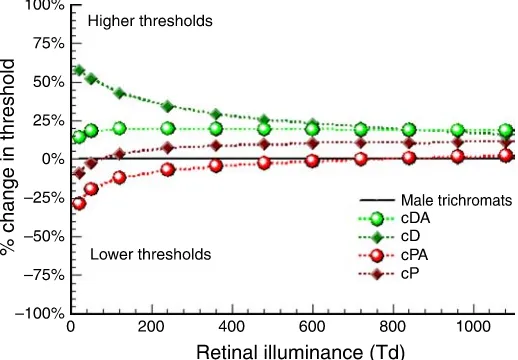
Chromatic sensitivity was measured for each subject at 4 different background adaptation levels, while the pupil diameter, the lens OD, and MPOD were measured and allowed for an estimate of subject-specific retinal illumi-nance (E). A non-linear function that describes the increase in RG thresholds with decreasing retinal illumi-nance was fitted for each group.Figure 4shows how RG thresholds vary with retinal illuminance for normal trichromats and for carriers of DA, D, PA, and P.Figure 5
shows the mean % change in RG thresholds for each group of carriers with respect to male control group as a function of retinal illuminance. Carriers of D performed worse than males at all retinal illuminances, but the effect was particularly large at lower light levels, with thresholds approximately 60% larger than normal males at 20 Td. Carriers of DA performed consistently worse than males for all light levels. Carriers of PA performed very
similarly to normal trichromatic males, except at lower light levels, when their RG thresholds decreased by 28%, outperforming normal trichromats. Carriers of P exhibited slightly larger thresholds over most of the range, except for the lowest retinal illuminances, when their thresholds became comparable to those measured in the male control group.
Discussion
In this study, we investigated the neural processing of color signals in female carriers of color vision deficiency. All groups had comparable age ranges, and therefore, any differences in chromatic sensitivity can be attributed to receptoral and/or post-receptoral factors. The measured differences in color vision between female carriers and male trichromats cannot be attributed to slight variations in “normal” pigments in either male or female subjects, since no measurable color vision differences between males and females can be detected when known carriers are excluded from the sample (Costa, Ventura, Perazzolo, Murakoshi, & Silveira,2006; Hood et al.,2006; Pickford,
1947; Rodriguez-Carmona, Sharpe, Harlow, & Barbur,
2008). The findings from this study confirm previous reports on the lower chromatic sensitivity of deutan carriers compared to male control, as well as their inferior performance on the pseudoisochromatic plates (Crone,
1959; Hood et al.,2006; Jordan & Mollon,1993; Waaler,
1927).
The RG color detection thresholds measured in PA carriers correlate well with the Rayleigh match midpoint of their offspring (Figure 2). The principal parameter that causes an increase in the Rayleigh match midpoint in PA subjects is the decrease in wavelength separation (%1) between the normal M and the variant MV pigments (Barbur et al., 2008). Protanomalous subjects with a large separation between M and MVcones are, therefore, likely to exhibit lower match midpoints, as well as larger ranges. The results of Figure 2 suggest that the RG chromatic thresholds in carriers of PA decrease significantly with decreasing %1 values, an observation consistent with the pooling of MVwith M cones in carriers of PA; the closer the two pigments (M and MV), the smaller the spectral
Figure 3.Rayleigh match midpoints and ranges for males, cDA, cPA, cD, and cP (in blue, light green, light red, dark green, and dark red symbols, respectively).
Male trichromats cDA cD cPA cP
MidpointTSD 39.1T1.4 38.3T2.5 39.1T1.38 38.6T2.5 37.9T2.1
p 0.04 0.77 0.32 0.36
Range 37.0–42.5 36.5–40.5 37.0–41.5 36.0–43.0 34.5–40.0
[image:7.612.82.250.59.250.2]p 0.41 0.34 0.5 0.21
broadening of the pooled response and, hence, the better the color detection sensitivity of the resulting RG mechanism.
Carriers of PA showed a small but insignificant deutan shift in their Rayleigh matches. Of the 6 PA carriers, 5 required less1R(650 nm) light than normal trichromats in their Rayleigh match, which is also reflected in the matching ranges (Table 2 and Figure 3). Although this finding is not consistent with some earlier observations (Schmidt,1955), a number of studies have either found no significant shift from the normal position in the midpoints set by carriers of PA (Jordan, Deeb, Bosten, & Mollon,
2010; Waaler, 1927) or have even suggested a small deutan shift (Wieland,1933). On the assumption that MV pools with M and the resulting combined spectral responsivity function shifts toward L, the Rayleigh match midpoint of the PA carriers would be expected to show a
deutan shift, which is in agreement with the current findings. Other Nagel models also predict that the pooling of MVwith M would cause a slight deutan shift in the match midpoint (Sun & Shevell,2008).
A correlation of the carriers’ RG threshold with the Rayleigh match midpoint of their offspring was not found in carriers of DA (Figure 2). Carriers of DA exhibited a significant deutan shift in their match midpoint compared to normal trichromats (Figure 3), a finding that has been reported in previous studies (Jordan et al., 2010; Waaler,
[image:8.612.117.497.54.477.2]1927). If LVwas pooled with L, the Rayleigh match midpoints of DA carriers should be shifted to higher than normal values (Barbur et al.,2008; Sun & Shevell,2008). The absence of a correlation between the RG detection thresholds of cDA and their offsprings and/or the absence of a protan shift suggest that LVis not pooled selectively with L.
The current findings do not exclude the possibility that LVis pooled with M, but the consequences of this outcome need critical examination. Deuteranomalous subjects rely on L-cone pigments separated by a maximum of 12 nm (J. Neitz et al.,1996), rendering the wavelength separation between LVand M pigments in DA carriers fromÈ16 nm to È27 nm. If LVpooled exclusively with M, the large potential broadening of the resulting spectral responsivity function would alter significantly the carriers’ chromatic sensitivity and this would not pass undetected using current color assessment tests. The combined pooling of LVwith either L or M, depending on the hybrid pigment’s spectral tuning, would cause only a moderate loss of RG sensitivity compared to normal trichromatic males.
Carriers of D and PA show a markedly different behavior in terms of the rate of change of chromatic sensitivity with light level, when compared to male controls or other carrier groups. Carriers of D show a faster rate of chromatic sensitivity loss with reducing light level, reaching 60% worse performance than male controls, whereas carriers of PA outperform males by 28% at mesopic light levels (Figure 5). The performance of PA carriers cannot be attributed to the use of luminance
cues (Verriest, 1972), since the CAD test employs achro-matic dynamic luminance contrast noise to mask the use of luminance contrast signals (Rodriguez-Carmona, Harlow, Walker, & Barbur,2005).
[image:9.612.38.297.61.241.2]The percentage of L cones in normal trichromats can be approximated by a normal distribution, with a mean value of 66%. Although the standard deviation is less well defined, it is expected that almost 70% of the subjects have between 50 and 80% L cones (M. Neitz et al.,2006). X inactivation ratios in female carriers are also normally distributed and 95% of females show an X inactivation ratio of no more than 15:85 (or conversely 85:15; Amos-Landgraf et al.,2006). The range of L:M ratios in female carriers can be predicted by taking into account the statistical distribu-tion of X inactivadistribu-tion and the expected mean and spread in normal trichromats. Although the L:M ratios of cD, cPA, and normal trichromatic males show some overlap (see
Table 3), the means of the distributions in these groups are sufficiently different to minimize the overlap. For example, if one assumes a mean L:M ratio of 2:1 and the limits of X inactivation for 95% of the female population, carriers of D, carriers of PA, and male trichromats show non-overlapping L:M ratio ranges; carriers of D show, on average, a reduced number of M cones (or conversely a higher % of L cones on their retinas) and carriers of PA show increased M-like cones (or conversely a reduced number of L cones on their retinas).
The effectiveness of rod signals at lower light levels may well depend on the number of M cones, which overlap significantly in spectral sensitivity with rods. At lower light levels, cone signals become weaker and the responses of many ganglion cells that would normally depend on cone inputs become dominated by rod signals (Lee, Smith, Pokorny, & Kremers, 1997; Stabell & Stabell, 1996, 1998). The efficiency of the rod–cone interaction effects that minimize the use of rod signals in the mesopic range depends largely on the strength and number of cone signals available at any given light level; the increased dependence on rod signals in the mesopic range is accompanied by a selective loss of S-cone sensitivity, with vision being mediated primarily through the use of rod and L-cone signals (Pokorny, Lutze, Cao, & Zele,2006).
Figure 5.Mean % change in RG thresholds of cPA (red circles), cDA (green circles), cD (green diamonds), and cP (red diamonds) with respect to normal trichromatic males for a range of retinal illuminances (fitted data).
Males
Range of L:M* Average L:M*
41% L 97% L 66% L
X inactivation ratio 15:85 85:15 15:85 50:50 85:15
cD È99.5% L È49.9% L È95% L È83.5% L È72% L
cPA È6.2% L È82.5% L È9.9% L È33% L È56% L
As argued above, carriers of D have, on average, a reduced number of M cones and it is possible that rod signals become effective sooner than would be expected for normal trichro-mats, leading to a measurable reduction in RG chromatic sensitivity (as shown inFigures 1 and 5). Interestingly, RG thresholds in carriers of PA decrease by 28% at low light levels. This observation supports the proposed pooling of MV and M cones, which results in an increased number of M-like cones, a subsequent broadening of spectral responsivity, and enhanced signals. Carriers of PA could use this outcome to suppress more effectively rod signals at lower light levels. Rod intrusion may not, however, affect significantly the chromatic sensitivity in carriers of DA, who exhibit a consistent and unaltered disadvantage to normal trichromats throughout the 1000-Td range. This observation supports the combined pooling hypothesis of LVwith both L and M, since this outcome is likely to reduce chromatic sensitivity, independent of light level.
Conclusion
The significant differences observed among the four groups of carriers suggest that spectral similarities between the hybrid MVand LVpigments and the normal pigments might mediate the processing of the fourth pigment’s signal in carriers of anomalous trichromacy. Consequently, in carriers of PA, MVmight pool preferably with M, while the lack of obvious trends in carriers of DA suggests less specific pooling of LVsignals. The addition of full genetic analysis of carriers and their offspring and the prediction of the corresponding pigments and the peak spectral responsivities are needed to investigate further the mechanisms that cause the differences in chromatic sensitivity with light level within the four groups of carriers of color deficiency.
Acknowledgments
We wish to thank City University London for the doctoral studentship awarded to Evgenia Konstantakopoulou and the Colt Foundation (Ref. CF/05/11) for supporting M. Rodriguez-Carmona. We acknowledge the Engineering and Physical Sciences Research Council (EPSRC, Grant EP/G044538/1) for support with the equipment employed in this study. We also wish to thank J. A. Harlow for his support with the programming work.
Commercial relationships: none.
Corresponding author: Evgenia Konstantakopoulou. Email: Evgenia.Konstantakopoulou.2@city.ac.uk.
Address: Applied Vision Research Centre, The Henry Wellcome Laboratories for Vision Sciences, City University London, Northampton Square, London EC1V 0HB, UK.
References
Alexandridis, E., Leendertz, J. A., & Barbur, J. L. (1991). Methods for studying the behaviour of the pupil. Journal of Psychophysiology, 5, 223–239.
Amos-Landgraf, J. M., Cottle, A., Plenge, R. M., Friez, M., Schwartz, C. E., Longshore, J., et al. (2006). X chromosomeVInactivation patterns of 1,005 phe-notypically unaffected females. American Journal of Human Genetics, 79,493–499.
Barbur, J. L., Harlow, A. J., & Plant, G. T. (1994). Insights into the different exploits of colour in the visual cortex. Proceedings of the Biological Science, 258,327–334.
Barbur, J. L., & Konstantakopoulou, E. (2012). Changes in color vision with decreasing light level: Separating the effects of normal aging from disease. Journal of the Optical Society of America A, 29,A27–A35. Barbur, J. L., Konstantakopoulou, E., Rodriguez-Carmona, M.,
Harlow, J. A., Robson, A. G., & Moreland, J. D. (2010). The Macular Assessment Profile testVA new VDU-based technique for measuring the spatial dis-tribution of the macular pigment, lens density and rapid flicker sensitivity.Ophthalmic and Physiological Optics, 30,470–483.
Barbur, J. L., & Rodriguez-Carmona, M. (2012). Varia-bility in normal and defective colour vision: Con-sequences for occupational environments. In J. Best (Ed.), Colour design (pp. 24–82). Cambridge, UK: Woodhead Publishing.
Barbur, J. L., Rodriguez-Carmona, M., Harlow, J. A., Mancuso, K., Neitz, J., & Neitz, M. (2008). A study of unusual Rayleigh matches in deutan deficiency. Visual Neuroscience, 25,507–516.
Barbur, J. L., Thomson, W., & Forsyth, P. (1987). A new system for the simultaneous measurement of pupil size and two-dimensional eye movements. Clinical Visual Science, 2,131–142.
Born, G., Grutzner, P., & Hemminger, H. (1976). Evidence for reduced colour vision in carriers of congenital colour vision deficiencies (author’s trans-lation).Human Genetics, 32, 189–196.
Brainard, D. H., Roorda, A., Yamauchi, Y., Calderone, J. B., Metha, A., Neitz, M., et al. (2000). Functional con-sequences of the relative numbers of L and M cones. Journal of the Optical Society of America A, Optics, Image Science, and Vision, 17,607–614.
Carroll, J., Neitz, J., & Neitz, M. (2002). Estimates of L:M cone ratio from ERG flicker photometry and genetics. Journal of Vision, 2(8):1, 531–542, http://www. journalofvision.org/content/2/8/1, doi:10:1167/2.8.1. [PubMed] [Article]
Cicerone, C. M., & Nerger, J. L. (1989). The relative numbers of long-wavelength-sensitive to middle-wavelength-sensitive cones in the human fovea centralis. Vision Research, 29,115–128.
Cohn, S. A., Emmerich, D. S., & Carlson, E. A. (1989). Differences in the responses of heterozygous carriers of colorblindness and normal controls to briefly presented stimuli. Vision Research, 29,255–262. Costa, M. F., Ventura, D. F., Perazzolo, F., Murakoshi, M., &
Silveira, L. C. (2006). Absence of binocular summation, eye dominance, and learning effects in color discrim-ination.Visual Neuroscience, 23,461–469.
Crone, R. A. (1959). Spectral sensitivity in color-defective subjects and heterozygous carriers.American Journal of Ophthalmology, 48,231–238.
Franceschetti, A. (1928). Die Bedeutung der Einstellungs-breite am Anomaloskop fu¨r die Diagnose der einzelnen Typen der Farbensinnsto¨rungen, nebst Bemerkunge-nu¨ber ihren Vererbungsmodus. Schweizerische Medizi-nische Wochenschrift, 52,1273–1279.
Gunther, K. L., & Dobkins, K. R. (2002). Individual differences in chromatic (red/green) contrast sensitiv-ity are constrained by the relative number of L- versus M-cones in the eye.Vision Research, 42, 1367–1378. Hofer, H., Carroll, J., Neitz, J., Neitz, M., & Williams, D. R. (2005). Organization of the human trichromatic cone mosaic.Journal of Neuroscience, 25, 9669–9679. Hood, S. M., Mollon, J. D., Purves, L., & Jordan, G.
(2006). Color discrimination in carriers of color deficiency.Vision Research, 46, 2894–2900.
Jordan, G., Deeb, S. S., Bosten, J. M., & Mollon, J. D. (2010). The dimensionality of color vision in carriers of anomalous trichromacy. Journal of Vision, 10(8):12, 11–19, http://www.journalofvision.org/content/10/8/12, doi:10.1167/10.8.12. [PubMed] [Article]
Jordan, G., & Mollon, J. D. (1993). A study of women heterozygous for colour deficiencies.Vision Research, 33,1495–1508.
Kremers, J., Scholl, H. P., Knau, H., Berendschot, T. T., Usui, T., & Sharpe, L. T. (2000). L/M cone ratios in human trichromats assessed by psychophysics, elec-troretinography, and retinal densitometry. Journal of the Optical Society of America A, Optics, Image Science, and Vision, 17, 517–526.
Krill, A. E., & Schneiderman, A. (1964). A hue discrim-ination defect in so-called normal carriers of color vision defects.Investigative Ophthalmology, 3,445–450.
Lee, B. B., Smith, V. C., Pokorny, J., & Kremers, J. (1997). Rod inputs to macaque ganglion cells.Vision Research, 37,2813–2828.
Lyon, M. F. (1961). Gene action in the X-chromosome of the mouse (Mus musculusL.).Nature, 190,372–373. MacLeod, D. I. A. (1985). Receptoral constraints on color appearance In D. Ottoson & S. Zeki (Eds.),Central and peripheral mechanisms of color vision(pp. 103–116). London: MacMillan.
Miyahara, E., Pokorny, J., Smith, V. C., Baron, R., & Baron, E. (1998). Color vision in two observers with highly biased LWS/MWS cone ratios.Vision Research, 38,601–612.
Nagy, A. L., MacLeod, D. I., Heyneman, N. E., & Eisner, A. (1981). Four cone pigments in women heterozygous for color deficiency. Journal of the Optical Society of America, 71,719–722.
Nathans, J., Piantanida, T. P., Eddy, R. L., Shows, T. B., & Hogness, D. S. (1986). Molecular genetics of inherited variation in human color vision.Science, 232,203–210. Neitz, J., Neitz, M., & Kainz, P. M. (1996). Visual pigment gene structure and the severity of color vision defects. Science, 274,801–804.
Neitz, M., Balding, S. D., McMahon, C., Sjoberg, S. A., & Neitz, J. (2006). Topography of long- and middle-wavelength sensitive cone opsin gene expression in human and Old World monkey retina.Visual Neuro-science, 23,379–385.
Neitz, M., Neitz, J., & Jacobs, G. H. (1995). Genetic basis of photopigment variations in human dichromats. Vision Research, 35,2095–2103.
Pickford, R. W. (1947). Sex differences in colour vision. Nature, 159,606.
Pickford, R. W. (1949). Colour vision of heterozygotes for sex-linked red–green defects.Nature, 163, 804. Pokorny, J., Lutze, M., Cao, D., & Zele, A. J. (2006). The
color of night: Surface color perception under dim illuminations.Visual Neuroscience, 23, 525–530. Rodriguez-Carmona, M., Harlow, A. J., Walker, G., &
Barbur, J. L. (2005).The variability of normal trichro-matic vision and the establishment of the normal matching range. Paper presented at the Proceedings of the 10th Congress of the Association Internationale de la Couleur (AIC), Granada, Spain.
Rodriguez-Carmona, M., O’Neill-Biba, M., & Barbur, J. L. (2012). Assessing the severity of color vision loss with implications for aviation and other occupational environ-ments.Aviation, Space, and Environmental Medicine, 83, 19–29.
Roorda, A., Metha, A. B., Lennie, P., & Williams, D. R. (2001). Packing arrangement of the three cone classes in primate retina.Vision Research, 41, 1291–1306. Schmidt, I. (1955). A sign of manifest heterozygosity in
carriers of color deficiency. American Journal of Optometry and Archives of American Academy of Optometry, 32, 404–408.
Sharp, A., Robinson, D., & Jacobs, P. (2000). Age- and tissue-specific variation of X chromosome inactiva-tion ratios in normal women. Human Genetics, 107, 343–349.
Stabell, B., & Stabell, U. (1996). Peripheral colour vision: Effects of rod intrusion at different eccentricities. Vision Research, 36,3407–3414.
Stabell, B., & Stabell, U. (1998). Chromatic rod–cone interaction during dark adaptation. Journal of the Optical Society of America A, Optics, Image Science, and Vision, 15, 2809–2815.
Sun, Y., & Shevell, S. K. (2008). Rayleigh matches in carriers of inherited color vision defects: The
contribution from the third L/M photopigment. Visual Neuroscience, 25,455–462.
Verriest, G. (1972). Chromaticity discrimination in protan and deutan heterozygotes.Die Farbe, 21, 7–16. Waaler, G. H. M. (1927). Uber die
Erblichkeitsverha¨It-nisse der verschiedenen Arten von angeborener Rotgru¨nblindheit. Zeirschrtft fir induktive Abstam-mungs und Vererbungslehre, 45,279–333.
Wachtler, T., Doi, E., Lee, T., & Sejnowski, T. J. (2007). Cone selectivity derived from the responses of the retinal cone mosaic to natural scenes. Journal of Vision, 7(8):6, 1–14, http://www.journalofvision.org/ content/7/8/6, doi:10.1167/7.8.6. [PubMed] [Article] Wieland, M. (1933). Untersuchungen u¨ber Farbenscwa¨che
bei Konduktorinnen. Archiv fu¨r Ophthalmology, 30, 441–462.