City, University of London Institutional Repository
Citation
:
Gkoktsi, K., TauSiesakul, B. & Giaralis, A. (2015). Multi-channel sub-Nyquist
cross-Spectral Estimation for Modal Analysis of Vibrating Structures. In: UNSPECIFIED .
IEEE. ISBN 978-1-4673-8352-3
This is the accepted version of the paper.
This version of the publication may differ from the final published
version.
Permanent repository link:
http://openaccess.city.ac.uk/13618/
Link to published version
:
http://dx.doi.org/10.1109/IWSSIP.2015.7314232
Copyright and reuse:
City Research Online aims to make research
outputs of City, University of London available to a wider audience.
Copyright and Moral Rights remain with the author(s) and/or copyright
holders. URLs from City Research Online may be freely distributed and
linked to.
Multi-channel sub-Nyquist cross-Spectral Estimation
for Modal Analysis of Vibrating Structures
Kyriaki Gkoktsi
1, Bamrung Tau Siesakul
1, Agathoklis Giaralis
11 Department of Civil Engineering, City University London, Northampton Square, EC1V 0HB, London, UK [email protected]
Abstract – Operational modal analysis (OMA) is a widely used construction verification and structural health monitoring technique aiming to obtain the modal properties of vibrating civil engineering structures subject to ambient dynamic loads by collecting and processing structural response acceleration signals. Motivated by the need for cost-efficient OMA using wireless sensor networks which acquire and transmit measurements at a lower than the Nyquist rate, a novel OMA approach is put forth to derive modal properties directly from sub-Nyquist sampled (compressed) acceleration measurements from arrays of sensors. This is achieved by adopting sub-Nyquist deterministic non-uniform multi-coset sampling devices and by extending a previously proposed in the literature power spectrum blind sampling (PSBS) method for single-channel spectral estimation of stochastic processes to treat the case of multiple channel cross-spectral estimation. The standard frequency domain decomposition is used to obtain the modal properties from the cross-spectral matrix derived directly from the sub-Nyquist measurements. The applicability and efficiency of the proposed approach is exemplified by retrieving mode shapes of a white-noise excited simply supported steel beam with good accuracy according to the widely used modal assurance criterion (MAC) using 70% less than the Nyquist rate measurements.
Keywords - Power spectrum blind sampling; multi-channel cross-spectral estimation; compressive sub-Nyquist sampling; structural health monitoring
I. INTRODUCTION AND MOTIVATION
Operational modal analysis (OMA) relies on linear system identification techniques to derive the dynamic (modal) properties of vibrating civil engineering structures (i.e., natural frequencies, damping ratios, and mode shapes) subject to low-amplitude ambient dynamic excitations (e.g., due to wind or traffic induced loads) [1][2]. This is achieved by processing only acceleration structural response signals recorded by relatively dense arrays of sensors, while the input excitation loads are not measured but are assumed to have a flat spectrum over a wide range of frequencies (i.e., white noise excitation assumption). OMA is a widely used structural health monitoring technique since it obtains modal properties efficiently, under operational conditions, which are then used for condition assessment, design verification, and damage detection of civil engineering structures. From a practical viewpoint, the use of wireless sensor networks (WSNs) offers low-cost and rapid OMA implementations compared to tethered sensors, especially in large scale and geometrically complex structures [3],[4]. On the antipode, the consideration of WSNs for OMA increases maintenance costs as wireless
sensors require frequent battery replacement (or expensive local energy harvesting), while they pose limitations to the amount of data that can be transmitted.
To address the above issues, fairly recently, various researchers considered compressive sensing (CS) based techniques for OMA aiming to reduce the energy consumption at the sensors by considering slower sampling rates at the analog-to-digital converter (ADC) units and, at the same time, to reduce the data transmitted within WSNs [5][7]. The latter is achieved without local on-board offline data storage and compression-before-transmission, which is the current norm for wireless sensors [3]. Therefore, CS techniques may also lead to simpler and cheaper sensors. However, in all CS approaches reported in the literature, the response acceleration signals are treated as deterministic, which is not in alignment with the assumption of white-noise excited structural systems, while a certain level of sparsity is assumed for measured signals which may not hold true for noisy environments encountered in practice. Further, with the exception of [5], computational expensive signal reconstruction from the compressed measurements is required after transmission [8].
To circumvent the above limitations, this paper proposes a novel sub-Nyquist approach for OMA which treats response acceleration signals as stochastic processes (i.e., white noise filtered through linear structural systems), does not theoretically require signal sparsity, and provides estimates of modal properties directly from the compressed (sub-Nyquist sampled) measurements without signal reconstruction. The proposed approach builds on recent work by the authors on power spectrum blind sampling (PSBS) for system identification of white-noise excited structural systems [9],[10], and extends the works in [11],[12], to achieve cross-spectral estimation from simultaneous multiple sensing channels. Specifically, the multi-coset sampling device in [11] is adopted yielding deterministic, non-uniform, periodic samples taken at a sub-Nyquist rate [13]. The PSBS technique in [12] is extended to estimate the cross-spectral matrix from sub-Nyquist measurements from an array of such devices. The standard frequency domain decomposition algorithm [14] is finally employed to retrieve structural modal properties.
II. SUB-NYQUIST OPERATIONAL MODAL ANALYSIS
A. Multicoset Sampling Strategy and Device
in the frequency domain by the power spectrum Px(ω)
band-limited by 2π/T. It is desired to sample x(t) at a rate lower than the Nyquist sampling rate 1/Τ (in Hz), and still be able to obtain a useful estimate of the spectrum Px(ω). To this aim, the
multi-coset sampling strategy is herein adopted [13], which can be implemented by utilizing M interleaved ADC devices operating at a sampling rate 1/(NT). A discrete-time model of such a sampling device is shown in Figure 1 in which the discrete-time signal x[n]= x(n/T) enters M branches and at each
m branch (m= 0, 1,…, M−1), the signal is convolved by an N -length sequence cm[n] and down-sampled by N [11]. The
selection of M samples (sampling pattern) within each block is governed by the coefficients cm[n] of the filter written as cm [n]
= 1 for n = −nm and cm [n] = 0 for n ≠ −nm where there is no
repetition in nm, i.e.,
i j
m m
n n mimj. The output of the
m-th branch is given as
0
1
[ ] [ ] [ ].
m m
p N
y k c p x kN p
The [image:3.595.60.236.305.439.2]limiting case of M=N samples x[n] at the Nyquist rate, while the case of M/N<1 corresponds to sub-Nyquist sampling and the ym sequences become “compressed measurements” of x[n].
Figure 1. Discrete-time model of the adopted AIC device in [11]
B. Input/Output Correlation Function Relationships
Consider an array of D identical multi-coset sampling devices measuring acceleration response signals at different locations of a white-noise excited structure. Each device has M
branches with output sequences d[ ]
m
y l where m= 0,1,…, M−1
and d=1, 2,…, D. The cross-correlation function between two output sequences of the mi branch of the da device and of the mj
branch of the db device is hereafter denoted by
y
, [ ] E [ ] [ ] ,
a b a b i j i j d d m m y y
r k y l y lk where Ea{·} is the
mathematical expectation operator with respect to a. Further, the cross-correlation function between the input signals
[ ]
d
x m to the devices da and db is denoted by
[ ] E a[ ] b[ ] .
a b
d d
x x x
r n x m x m n
Under the assumption that all considered devices have the same sampling pattern across their branches, the common pattern cross-correlation function is expressed as
0
,
1
[ ] [ ] [ ] [ ( )],
i j i j i j
c c m m m m
k N
r n c k c k n n n n
where δ[n]= 1 for n = 0 and δ[n] = 0 for n ≠ 0. The above assumption
allows to relate the cross-correlation functions of the output sequences in the array as
1
0
[ ] [ ] [ ],
a b c a b
y y x x
l
k l k l
r R r (1)
which is a generalization of the single device (channel) case considered in [9][12]. In the previous expression,
0 0 0 ( 1) 1 0 ( 1) ( 1)
T
, , , ,
[ ] [ ] [ ] [ ] [ ] ,
a b a b a b a b a b
M M M
y y k ry y k ry y k ry y k ry y k
r
is the M2-by-D matrix collecting the output cross-correlation
sequences
, [ ]
a b i j
y y
r k among the M branches of the array of devices, where a “T” superscript denotes matrix transposition;
T
[ ] [ ] [ 1] [( 1) 1]
a b a b a b a b
x x n rx x nN rx x nN rx x n N
r is
the N-by-D matrix collecting the input cross-correlation sequences; and Rc[ ]l is the M
2-by-N matrix defined as
0 0 0 1 1 0 1 1
T
, , , ,
[ ] [ ] [ ] [ ] [ ] .
M M M
c l c c l c c l c c l c c l
R r r r r
By assuming that the input cross-correlation sequences
[ ]
a b
x x n
r take on negligible values outside the range −L ≤ k ≤ L, the input/output relationship can be cast in matrix form
c yayb
=
xaxb,
r
R r
(2)where ry ya b is the M
2(2L+1)-by-D matrix defined as
y y y y
T T T T
y ya b [0] [ ] [ ] [ 1]
a by a by L a by L a by
r r r r r ,
x xa b
r is
the N(2L+1)-by-D matrix defined in a similar manner, andRc
is the M2(2L+1)-by-N(2L+1) matrix given by
c
[0] [1]
[1] [0]
[1] [0] ,
[1] [0] c c c c c c c c
R O O R
R R O O
R O R R
O
O O R R
(3)
Equation (2) defines an overdetermined system of linear equations which can be solved for
a b
x x
r without any sparsity
constraints provided that Rc is full column rank. The latter condition is satisfied for M2N [11].
C. Power Spectrum Blind Sampling from compressed sub-Nyquist measurements
Suppose that xa[n] and xb[n] are sampled at the Nyquist rate
from the band-limited continuous-time processes xa(t) and xb(t)
respectively. Then, the cross power spectrum of xa(t) and xb(t)
i[ ] e ,
a b a b
n
x x x x
n
P r n
where i 1. The latterexpression is further discretized in the frequency domain and cast in matrix form as
(2 1) ,
a b L N a b
x x x x
s F r (4)
where F(2L1)N is the N(2L+1)-by-N(2L+1) standard discrete Fourier transform matrix and sx xa b is a N(2L+1)-by-D power
spectrum matrix evaluated at discrete frequencies ω= [0, 2π/((2L+1)N), …, 2π(2L+1)N−1/((2L+1)N)].
Consider the unbiased estimator of the output cross-correlation function
,
ˆa b[ ]
i j
y y
r k . The following weighted least
squares criterion is adopted [12]
2
c
ˆa b arg min ˆa b a b ,
x xa b
x x r y y x x W
r r R r (5)
in which the weighted version of the Euclidean norm is given
by 2 T
W
a a Wa, and W is a weighting matrix. An estimate of the cross-spectrum matrix sx xa bis obtained by
T 1
1 T 1(2 1)
ˆx xa b L N c c c ˆy ya b,
s F R W R R W r (6)
where the “−1” superscript denotes matrix inversion. In the last equation, the (2L+1)M2-by-D matrix
y y
ˆa b
r is an unbiased
estimator of the matrix y ya b.
r The cross-spectrum matrix in (6)
is efficiently computed directly from the cross-correlation estimator of the compressed acceleration measurements from the array of D AIC devices. This is achieved by exploiting the sparse structure of the Rc matrix as detailed in [12].
D. Frequency Domain Decomposition (FDD) algorithm
Any established frequency domain algorithm for OMA can be utilized to derive structural modal properties from the cross-spectral matrix in (6) obtained directly from sub-Nyquist acceleration measurements of white-noise excited structures. In this study, the standard frequency domain decomposition (FDD) algorithm is used, which applies the singular value decomposition to the matrix in (6) , i.e. sx xa b = U Σ VT, where Σ is a diagonal positive semi-definite matrix comprised of the singular values, and U, V are the unitary singular matrices holding the left and right singular vectors respectively. The modal information is carried on the singular values and singular vectors of the first coordinate (principal component) which retains the highest variance [15]. In this respect, natural frequencies are located at the peaks of the principal singular values and the pertinent mode shapes are obtained from the left singular vector of the principal components.
III. NUMERICAL ASSESSMENT
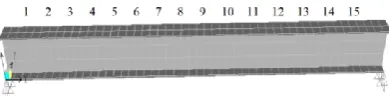
[image:4.595.336.531.196.244.2]For numerical validation, it is sought to verify the vertical in-plane mode shapes and corresponding natural frequencies of the simply supported IPE300 steel beam depicted in Figure 2 with length l=5m and elastic modulus E=210GPa using the proposed sub-Nyquist OMA approach. A critical damping ratio of 1% is assumed for all modes. The dynamic properties (natural frequencies and mode shapes) of this beam are found by application of standard continuous structural dynamics formulae (e.g. [2]). The first 4 natural frequencies are given in Table I. Further, the n-th mode shape of the beam is given as φn(x)= sin(nπx/l) along the x longitudinal ordinate (0≤x≤l).
Figure 2. Simply supported steel beam instrumented with 15 sampling devices measuring vertical acceleration response signals.
It is assumed that the vertical response acceleration of the beam is measured at 15 equi-distant locations along its length, as indicated in Figure 2, using the multi-coset sampling device of Figure 1 for white noise excitation applied at location 1 along the gravitational direction. The discrete-time Nyquist-sampled sequence that enters each sampling device is simulated by filtering band-limited zero-mean discrete-time white noise sequences through appropriately defined auto-regressive-moving-average (ARMA) filters. Specifically, for each of the 15 measurement locations, a different ARMA filter is considered defined by “fitting” the magnitude of its transfer function to the following power spectral density function
using the two-stage method detailed in [16]. The function in (7) is the square magnitude of the frequency response function for an input excitation force at location j and an output acceleration response at location i on the beam [2]. In particular, ωnand ζn
are the natural frequency and critical damping ratio of the n-th mode, respectively, φni is equal to the φn(xi) mode shape
ordinate at a distance xi of point i from the left end of the beam,
and δrs=1 for r=s, and δrs=0 for r≠s. All 15 sampling devices
considered are identical comprising M=5 branches with a down-sampling parameter N=16 and a common deterministic, non-uniform, and periodic sub-Nyquist multi-coset sampling pattern given by the sequence n = [0 1 2 5 8]T [8],[10][12].
They achieve a compression ratio of M/N≈30%. Following the
PSBS approach in section II, the spectral matrix in (6) is approximated using the output cross-correlation estimates derived directly from the sub-Nyquist measurements of the 15 AIC devices. The thus obtained matrix is used together with the standard FDD algorithm to estimate the natural frequencies and mode shapes of the beam under study.
4
2 4
1
2 2 2 2 2
2 2 2 2 2 2 2 2
2φ φ φ φ (ω) ω
δ 1
(ω ω )(ω ) 4ω ω ω ζ ζ [(ω ω ) (2ωω ζ ) ] [(ω ω ) +(2ωω ζ ) ]
ir jr is js ij
r,s rs
r s r s r s r r r s s s
ω
,
-
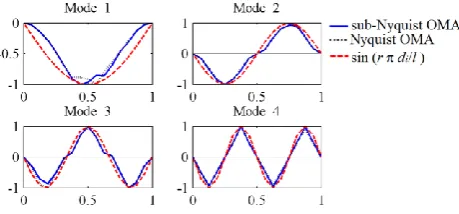
HTable I reports the percentage error between the estimated and the exact natural frequencies for the first 4 mode shapes. The case of natural frequency estimation from measurements sampled at the Nyquist rate (i.e., for M/N=100%) is also reported. The differences found are small and well within the range of engineering accuracy. Further, Fig. 3 plots the first 4 mode shapes estimated from the left singular vector U of the decomposed spectral matrix (solid curves), together with the exact mode shapes of the beam (broken curves). Mode shapes estimated from Nyquist sampled measurements are also included in Fig. 3 for comparison. It is seen that the herein proposed OMA approach using sub-Nyquist samples yield reasonably accurate mode shapes. The level of accuracy for the estimated mode shapes is quantified using the modal assurance criterion (MAC) [2] which is widely used in OMA for the purpose. Note that MAC is a correlation measure between two eigenvectors (in this work between the exact and the estimated mode shapes) taking values between 0 and 1. It is common to assume that MAC values above 0.9 represent practically valid estimates of mode shapes [2]. Table I reports the obtained MAC values for the sub-Nyquist OMA approach which are well above 0.9 for all mode shapes considered.
[image:5.595.38.286.467.576.2]Figure 3. Exact (dashed curves) and estimated (solid and dotted curves) mode shapes of the beam in Figure 2.
TABLE I. NATURAL FREQUENCIES AND MODE SHAPES VALIDATION
Modes
Natural Frequencies Mode Shapes
Theoretical values (Hz)
Difference [%] MAC Nyquist Sub-Nyquist Nyquist Sub-Nyquist
1 54.9 0.3 0.3 0.955 0.955
2 153.1 0.89 −0.11 0.964 0.967
3 313.5 −0.01 −0.01 0.958 0.953
4 409.2 0.52 0.52 0.970 0.971
IV. CONCLUDING REMARKS
A novel OMA approach is put forth to derive modal properties directly from sub-Nyquist sampled (compressed) acceleration measurements from arrays of sensors. This is achieved by adopting sub-Nyquist deterministic non-uniform multi-coset sampling devices and by extending a previously proposed in the literature power spectrum blind sampling (PSBS) method for single-channel spectral estimation of stochastic processes to treat the case of multiple channel cross-spectral estimation. The standard frequency domain decomposition is used to obtain the modal properties from the
cross-spectral matrix derived directly from the sub-Nyquist measurements. The applicability and efficiency of the proposed approach is exemplified by retrieving mode shapes of a white-noise excited simply supported steel beam with good accuracy according to the widely used modal assurance criterion (MAC) using 70% less than the Nyquist rate measurements. These numerical results render the proposed approach a promising tool for cost-efficient and rapid implementation of OMA using WSNs, though further numerical work pertaining to more complex structures and to noisy measurements is warranted.
ACKNOWLEDGMENTS
This work has been funded by EPSRC in UK, under grant EP/K023047/1. The first author further acknowledges the support of City University London through a PhD studentship.
REFERENCES
[1] E. Reynders, "System identification methods for (operational) modal analysis: review and comparison," Arch. Comput. Methods Eng., vol. 19(1), pp. 51-124, 2012.
[2] D. J. Ewins, Modal Testing: Theory practice and application,2nd ed., Research Study Press, Baldock, 2000.
[3] J. P. Lynch, "An overview of wireless structural health monitoring for civil structures," Phil. Trans. R. Soc. A 365(1851), pp. 345-372, 2007. [4] B. F. J. Spencer, and C. B. Yun, "Wireless sensor advances and
applications for civil infrastructure monitoring," NSEL Report No 24, University of Illinois at Urbana-Champaign, 2010.
[5] J. Y. Park, M. B. Wakin, and A. C. Gilbert, "Modal analysis with compressive measurements," IEEE Trans. Signal Proces. Vol. 62(7), pp. 1655-1670, 2014.
[6] S. M. O’Connor, J. P. Lynch, and A. C. Gilbert, "Compressed sensing embedded in an operational wireless sensor network to achieve energy efficiency in long-term monitoring applications," Smart Mater. Struct. vol. 23(8), 085014, 2014.
[7] Y. Yang, and S. Nagarajaiah, "Output-only modal identification by compressive sensing: non-uniform low-rate random sampling," Mech. Syst. Sign. Proces. 56-57, 15-34, 2015.
[8] E. J. Candes, J. Romberg, T. Tao, "Robust uncertainty principles: exact signal reconstruction from highly incomplete frequency information," IEEE Trans. Inf. Theory,vol. 52, pp. 489-509, 2006.
[9] B. Tausiesakul, K. Gkoktsi, and A. Giaralis, "Compressive power spectrum sensing for vibration-based output-only structural identification," Proc. 7th Int. Conf. Comp. Stochastic Mechanics, 2014. [10] B. Tausiesakul, , K. Gkoktsi, and A. Giaralis, "Compressive sensing
spectral estimation for output-only system identification of structural systems in the precence of noise," Proc. In SPIE Sensing Technologies and Applications, 2015.
[11] D. D. Ariananda, and G. Leus, "Compressive wideband power spectrum estimation," IEEE Trans. Signal Proces. vol.60(9), pp. 4775-4789, 2012. [12] B. Tausiesakul, and N. Gonzalez-Prelcic, "Power spectrum blind
sampling using minimum mean square error and weighted least squares," Proc. 47th Asilomar Conf. Signals, Systems and Computers (ACSSC 2013), pp. 153-157, 2013.
[13] M. Mishali, and Y. C. Eldar, "Blind multiband signal reconstruction: Compressed sensing for analog signals," IEEE Trans. Sign. Proces. vol.
57(3), pp. 993-1009, 2009.
[14] R. Brincker, and L. Zhang, "Frequency domain decomposition revisited," Proc.3rd Int. Operational Modal Analysis Conf. (IOMAC’09), pp. 615-626, 2009.
[15] I. T. Jolliffe, Principal component analysis, 2nd ed., Springer, NY, 2002. [16] P. D. Spanos and M. P. Mignolet, "Recursive simulation of stationary
![Figure 1. Discrete-time model of the adopted AIC device in [11]](https://thumb-us.123doks.com/thumbv2/123dok_us/1478213.100457/3.595.60.236.305.439/figure-discrete-time-model-adopted-aic-device.webp)