Rochester Institute of Technology
RIT Scholar Works
Theses Thesis/Dissertation Collections
5-10-2013
Measuring attention using Microsoft Kinect
Darren Stanley
Follow this and additional works at:http://scholarworks.rit.edu/theses
Recommended Citation
Measuring Attention using Microsoft Kinect:
Master’s Thesis
Darren Stanley
Department of Computer Science
College of Computing and Information Sciences
Rochester Institute of Technology
Abstract
The transfer of knowledge between individuals has increasingly become achieved with the aid of interfaces or computerized training applications. However, computer based training currently lacks the ability to monitor human behavioral changes and respond to them accordingly.
Signatures
I, Darren Stanley, do hereby submit this thesis in partial fulfillment of the require-ments for the degree of Master of Science in Computer Science. It is approved by the committee memebers below.
Darren Stanley
Dr. Joe Geigel
Committee Chair
Dr. Reynold Bailey
Reader
Sean Strout
Contents
1 Introduction 5
2 Background 7
2.1 Attention . . . 7
2.1.1 Measuring Attetion . . . 8
2.1.2 Continous Performance Task . . . 12
2.2 Microsoft Kinect . . . 12
2.2.1 Technical Specifications . . . 13
3 Related Work 15 3.1 Objective Measures of Attention Using Posture . . . 15
3.1.1 Behavioral Coding Systems . . . 15
3.1.2 Gaze Detection . . . 16
3.2 Predicting Affect and Engagement Through Posture . . . 16
3.2.1 Pressure Sensors . . . 17
3.2.2 Body Lean . . . 18
3.2.3 Measuring Engagement Using Kinect . . . 19
3.2.4 Discussion . . . 19
3.3 Hypothesis . . . 20
4 Methodology 21 4.1 Overview . . . 21
4.2 Subjects . . . 21
4.3 Measures . . . 22
4.3.1 PEBL . . . 22
4.3.2 Kinect . . . 28
4.4 System . . . 35
4.4.2 Software Architecture . . . 37
5 Analysis 40 5.1 Body Posture . . . 41
5.1.1 Within . . . 41
5.1.2 Between . . . 42
5.2 Head Pose . . . 44
5.3 Audio . . . 45
5.4 Multivariate Regression . . . 46
5.5 Groups . . . 51
5.5.1 Head Depth . . . 52
5.5.2 Head Depth Variance . . . 53
5.5.3 Body Lean . . . 54
5.6 Case Studies . . . 54
5.6.1 Subject Orange . . . 55
5.6.2 Subject Green . . . 56
5.6.3 Subject Blue . . . 57
5.6.4 Test Edges . . . 58
6 Conclusions 60 6.1 Conclusion . . . 60
6.2 Contributions . . . 61
6.3 Limitations and Future Work . . . 61
6.3.1 Limitations . . . 61
6.3.2 Improvements . . . 61
6.3.3 Future Work . . . 62
A Attentional Tasks 63 A.1 Conners Continuous Performance Test . . . 63
A.2 Test of Variables of Attention . . . 65
A.3 Psychomotor Vigilance Task . . . 66
B PCPT Report 68
C PPVT Report 71
D TOAV Report 74
E.1 Cross-sectional Features . . . 78
E.2 Aggregate Features . . . 79
F System Requirements 81 G Multivariate Regression Results 84 G.0.1 PCPT . . . 85
G.0.2 TOAV . . . 86
G.0.3 PPVT . . . 87
Chapter 1
Introduction
The idea of monitoring human behavior computationally is not new. Over the years, different techniques have been applied to affective and cognitive state detection. Two of the most well known approaches are facial recognition algorithms and brain-wave recordings through electroencephalography(EEG). Significant progress has been made in both fields, but they each suffer from problems that have prevented them from wide-spread adoption.
The first limitation is cost. Both facial recognition and EEG technologies require expensive sensors that are not affordable to the general public. This limits both the exposure to the technology and its applications. The second problem is that of invasiveness. Sensors that need to be worn on the body or limit the mobility of the learner are more difficult to introduce and gain acceptance.
Recognizing these deficiencies, researchers have begun to look for alternative ap-proaches. Until recently, the analysis of posture and gross body movement to deter-mine cognitive states has been limited. This is largely due to the fact that posture was difficult to measure without using invasive or expensive technology. Advances in technology, such as the release of the Microsoft Kinect, have provided lower cost, non-invasive tools for capturing posture data. [5] looked at using pressure sensors on seats and [19] used video to capture learners seated posture as non-invasive measures of affect and user engagement. These techniques showed that useful information can be obtained from body posture alone and without hindering the learners mobility. [18] took the lessons learned from [19] and [5] and applied them to data collected from the Microsoft Kinect.
Chapter 2
Background
2.1
Attention
Every one knows what attention is. It is the taking possession by the mind, in clear and vivid form, of one out of what seem several simultane-ously possible objects or trains of thought. Focalization, concentration, of consciousness are of its essence. It implies withdrawal from some things in order to deal effectively with others, and is a condition which has a real opposite in the confused, dazed, scatterbrained state which in French is called distraction. [13]
Despite William James’ famous observation about attention, the definition of atten-tion is often context specific. In general, attenatten-tion is a type of focus that allows us to perceive certain objects or thoughts above others. The object that we are focusing on is commonly called the stimulus and we usually refer to the act of choosing on which stimulus to focus selecting.
be a further contemplation on a previously collected external stimulus.
Overt attention is usually described in terms of what sensory organ perceives the stimulus, for example visual attention or auditory attention. In general when atten-tion is being described by a sensaatten-tion (visual, auditory, etc) there is an implicaatten-tion that the source of the stimulus is external.
The orienting response is the changing of orientation for a particular sensory organ in response to the recognition of an external stimulus.
Since covert attention refers to the idea that attention can be directed inward or reflected back on one’s own thoughts, it is not typically identifiable by the orientation of an individual towards a stimulus but can sometimes be identified by the abscence of an expected orientation. The lack of an orienting response to a given stimuli can indicate either a malfunction of the sensory organ or a strong attention to some other stimuli. If there is no orienting response for any of the sensory organs, it may imply the subject is directing his or her attention inwardly, or covertly attending.
Most research aimed at understanding or measuring attention is geared toward overt attention. In particular, most experimentation involves either visual or auditory stimuli. One exception to this is the EEG, which focuses on signals sent to the brain and is capable of detecting focus directed externally or internally. However, even when using the EEG to measure attention, it is generally desireable to control the stimulus and therefore a stimulus external to the subject is typical.
2.1.1
Measuring Attetion
A great deal of research has been done on how to effectively measure attention. Most of this work involved studying individuals with learning disabilities. The ability to focus on and attend to a given task are critical aspects of learning. In order to study the different demensions of attention, a number of tests have been created to specifically target indiviual situations. Often a comprehensive analysis of a subject’s attention requires performing multiple of these tests.
Alertness
to remain focused and alert over time. Over time it is expected that one’s level of alertness will decrease. The rate at which that measure decreases, and the consistency of the decline can be used to describe how well a person can sustain attention. A high variance in reaction time or large number of omissions might indicate that one has trouble maintaining the same level of alertness or that their attention drops more quickly over time than average. The measure of reaction time alone may be misleading, since slow reaction time alone does not mean that the subject was not paying attention. It is possible that the stimulus is too complex to quickly identify or that the subject is struggling to identify the stimulus for some other reason. Comparing the reaction time of an individual against the group provides insight into whether the subject is able to recognize the stimulus as effectively as the rest of the group. Looking at the variance (amount of change) in the reaction times for an individual allows us to determine how quickly the subject’s attention dissipated or how often their attention strayed. A linear decrease in reaction times expresses waning attention while unpredictable variance in reaction time expresses a tendency towards attentional shifts. The number of omission errors is similar to the reaction time variance; it is expected that over time an individual will experience a higher frequency of missed signals, but a steep increase or frequently sporadic misses might indicate trouble maintaining attention.
Often when collecting measurements on alertness, both tonic and phasic alertness are measured. Tonic alertness is a measure of alertness when the subject is asked to respond to a stimulus without prior warning. The subject is presented with a stimulus randomly over a period of time and asked to respond each time the stimulus is present. When measuring phasic alertness, the subject is still asked to respond whenever a stimulus is presented over a period of time; however, during the test the subject is always presented with a warning stimulus before the target stimulus is presented. The warning stimulus gives the subject a chance to refocus their attention before the target stimulus is presented.
An alertness task is good at measuring how well an individual can sustain attention in terms of how consistent that attention is sustained and how long it is sustained.
Vigilance
particu-larly low interest. An individual who performs well on a standard alertness task may not necessarily do well with vigilance tasks since the vigilence task requires greater patience and self control. In addition to the metrics used to measure alertness, vigi-lance also measures the number of commission errors (an error in which the subject erroneously responds to a non-target stimulus). The number of errors of commission are likely to be higher for subjects who exhibit more impulsive behavior. Vigilance tasks are representative of many real life tasks where the stimulus is unknown and occurs at an unknown time. For example, a student listening to a lecture does not know when the most useful information will be presented or even what the most use-ful information is going to be. For many tasks where the target stimulus is unknown (such as in the lecture example) one must be vigilant and attend to all stimulus and be able to decide what is important.
Divided Attention
Divided attention tasks are another type of task that is often used to asses a subject’s likelihood of having ADHD. In a divided attention task, a person is asked to respond to multiple target stimuli simultaneously. Children suffering from ADHD have a tendency to perform poorly on divided attention tasks and are more likely to commit the entirety of their attention towards a single task. The metrics used for measuring vigilance – reaction time, variance in reaction time, number of omission, and number of commission errors – are also used for divided attention tasks.
Visual Scanning
Incompatibility
The incompatibility test is used to measure how well an individual filters irrelevant data. Participants are asked to respond differently to multiple target stimuli where some of the stimuli contain contradictory content. For example, the subject may be presented with the word GREEN written in red text. How the subject responds to these contradictory cases measures how well the individual filters irrelevant data. This task also uses reaction time, reaction time variance, and number of commission errors to analyze the subject. A subject who is inattentive may be expected to miss the same ratio of target stimuli for both compatible and incompatible presentations while a subject who struggles to select only the relevant information will have a higher number of errors on incompatible presentations. This is valuable for determining if the subject is suffering from inattention or some other learning disability.
Flexibility
The flexibility task measures the flexibility (ability to change) of focused attention by a mental alteration between two sets of targets. [22] This test helps to expose subjects who have difficulty context switching, but does not necessarily indicate if the subject has trouble maintaining attention. In one example of a flexibility task, a subject is placed in front of a computer screen with each hand placed on a different button. The participant is instructed to respond by alternately pressing the button that was on the same side of the screen as the letter, and then pressing the button that was on the same side of the screen as the number. After each response, a new letter and number appears, randomly assigned to either side of the screen. [21]
Cross-Modal Integration
display while simultaneously playing either a high or low frequency audio tone. The subject is asked to press a response button when the up arrow is displayed along with the high frequency sound or when the down arrow is displayed along with the low frequency sound. [22] [21]
2.1.2
Continous Performance Task
The Continuous Performance Task (CPT) is a common method for clinically assessing ADD [17]. The CPT is a form of sustained attention task that places the subject in front of a computer monitor and asks them to respond to a particular stimulus when it is presented on the screen. Typically the test will run for 14 minutes in order to measure the subjects performance over time and allow for subjects to become impulsive or inattentive.
Most CPTs measure response time, errors of omission, and errors of commission. Omission errors occur when the subject does not respond to the target stimulus and indicate the individual is not paying attention, while commission errors occur when the subject incorrectly responds to a non-target stimulus which indicate the indi-vidual is reacting impulsively. Indiindi-viduals with inattentive and impulsive tendencies will record a higher number of these errors and suffer from inconsistent response times.
2.2
Microsoft Kinect
The Microsoft Kinect was released in November 2010 and was originally designed as an accessory for the Xbox 360 gaming system. The main function of the Kinect is to provide gross body movement capture in a non envasive and affordable manner. This allowed the development of games that required no controller and could be played entirely by user gestures and body movement.
the Kinect, specifically designed for use with a computer, was released in February 2012 along with updated hardware and an enhanced API (Kinect 1.5 SDK).
2.2.1
Technical Specifications
Kinect for Windows can run on any machine running Windows 7 or greater with a modern processor and at least 2GB of RAM [4].
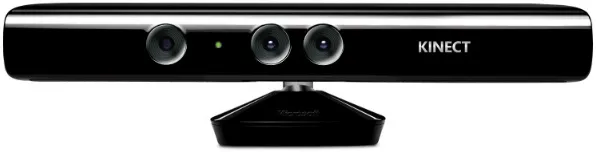
[image:16.612.157.455.323.399.2]The Kinect sensor (also called a Kinect) is a physical device that contains two cam-eras, a microphone array, and an accelerometer and comes with a software pipeline that processes color, depth, and skeleton data.
Figure 2.1: Image of Kinect sensor.
Chapter 3
Related Work
The concept of using posture to measure cognitive and emotional states has appeared in various forms and different fields of study throughout the years. Existing work has been done to measure attention using aspects of posture and observable behavior and a good deal of research has recently been directed toward automated techniques for detecting user affect and engagement using postural data.
3.1
Objective Measures of Attention Using
Pos-ture
3.1.1
Behavioral Coding Systems
One method that has been used to measure attention and impulsiveness in children is to use a behavioral coding system. Coding systems provide a well defined set of observable behaviors that an observer can use to ’score’ a child’s attention level. The use of predefined behavorial definitions helps to eliminate bias and helps ensure that all observers are using the same criteria to asses an individual. Studies have shown that behavioral coding systems, such as the Abikoff coding system, which provides a set of observed behaviors to score the likelihood a child may be experiencing a learning disability, are effective tools for objectively identifying children with various learning disorders [12].
idea that common, observable behaviors which are objective can be used to gauge levels of attention. The success of coding systems like Abikoff provide strong support that it is possible to build an automated system for detecting attention. In order to be successful the system needs to be able to correctly identify the defined set of objective behaviors and then build a score from its observations.
3.1.2
Gaze Detection
As discussed earlier, overt attention requires the use of a sensory organ to process information about the stimulus. Aspects of our attention that are directed at visual targets can be measured by external observation of the sensory organ used. That is, an observer can watch where our sensory organ (in this case the eyes) is directed and infer that the subject is attending to the stimulus. A common scenario where we might want to measure attention is a student during a classroom lecture. During this scenario we can say there are two target stimuli, the teacher, who is speaking, and the whiteboard, which contains supporting content for the lecture. We can easily identify if the student is visually attending to either target by analyzing their gaze direction and determining if they are looking at either target. Determining if the student is listening is more complex, but those who are not visually attending to a presentation are less likely to be paying attention to it auditorially. This idea has been used as an approximation of a student’s attentiveness during automated engagement detection. [2] uses video recording with face recognition to calculate the direction students are looking in order to classify them as attending or not-attending. This feeds into a larger behavior analysis framework which calculates the overall engagement level for each student.
3.2
Predicting Affect and Engagement Through
Posture
and amount of pressure placed on the different regions of the seat were also found to be revealing signs of affective state. In other research, [19] used video analysis to study the posture of children playing a game with a robotic interface and found that the angle and curvature of the child’s back could be used to identify the level of engagement that child experienced during the gaming session. Early exploration with the Kinect has begun to show it could be an effective tool for collecting posture related data. [18] used depth information reported from the Kinect to calculate a vector consisting of the lower torso, mid torso, and head distances from the sensor. This vector was used as an approximation of the subjects body lean and was shown to support the findings described by [19].
3.2.1
Pressure Sensors
Detection of learners affect from gross body language collected from pressure sensors located along the seat and back of a chair was conducted in comparison with other communicative techniques, such as facial recognition and dialogue analysis [5]. This research used the pressure sensors to gather feature vectors for use with traditional classifier algorithms, such as Bayesian classifiers, functions, instance-based learners, meta classifiers, rules, and trees. Specifically, the average amount of pressure placed on certain regions of the sensor along with the magnitude and direction of pressure changes was used feed these classifiers.
3.2.2
Body Lean
Some interesting work has been done connecting the angle of lean towards a stimulus to the level of engagement the subject is experiencing. Findings show that engaged users tend to increase their proximity to a target with increasing interest. This is generally achieved by leaning towards the target. Several research efforts have explored techniques for capturing this information.
[5] indirectly captured this information from pressure sensors placed on a chair. When the subject is leaning back in the chair more pressure is recorded by the sensors and when the subject leans forward (toward the target stimulus) less pressure is recorded.
Previous work, specifically that of [5], has identified that when subjects are bored they have a tendency to lean back, while during delight and flow (affective states correlated with engagement) students tend to lean forward. Students also lean for-ward when experiencing confusion and frustration, but at a lesser inclination All of these states suggest a high probability of attention focused on the target. It seems likely that students would focus more attention toward the target in both scenarios. During frustration and confusion the student focuses more as an attempt to resolve the source of frustration while during delight and flow the student attends because of their interest in the topic. [5] were able to identify when a subject was leaning forward using a series of pressure sensors (discussed earlier) placed on chairs. If the subject was leaning back in the chair pressure values increase on the sensors located on the back of the chair and when the subject leans forward pressure values decrease. This provides a good measurement of when a student is leaning forward.
3.2.3
Measuring Engagement Using Kinect
There is also existing research which has identified the possibilities opened up by the release of the Microsoft Kinect for measuring engagement levels. So far, this work has not been able to take advantage of the articulated data provided by the Kinect, but has shown even the raw data can be used to effectively gauge engagement.
3.2.4
Discussion
All of the measures of affect and engagement discussed so far rely on subjective anal-ysis. The two techniques discussed in this review for capturing affect and engagement are self rating and analysis by a trained judge. In the first scenario the subject is given a questionnaire about their experience and asked to recall their emotions and state of mind during the examination. The second technique requires the ability to obtain subject matter experts and have them watch the subject during the experi-ment and record their perception of the individuals state of mind. In contrast to the measurement of engagement, the study of attention has made greater use of more reproducible and unbiased measurements and assessment techniques.
There are, however, a number of similarities between measuring engagement and attention. Psychologists have long acknowledged the relationship between observable physical behavior and attention. In fact, this is the foundation of overt attention mechanisms. Another example is the identification of children with ADD. Often children are first suspected of having ADD by their parents or teachers based on observed behavior patterns. Indeed, some of the earliest techniques for identifying ADD were behavioral checklists filled out by an expert or someone close to the child. This is analogous to the self assessment exams given to subjects after a training session.
3.3
Hypothesis
The purpose of this study is to determine if a system can be built to recognize both inattentive and attentive behaviors in order to use that information as feedback for dynamic improvement. Some behaviors are obvious indications of inattention while others are more subtle. For example, when a person is not looking at a computer screen during a presentation, it is obvious they are not visually attending to the target. Using the measures described in the methodology section, this study seeks to categorize inattentive and attentive behaviors.
More specifically, this study seeks to determine if common behavioral patterns and postures can indicate the attentiveness of an individual. To accomplish this, Kinect hardware, which is capable of recording articulated data over time, was employed to identify such movements and postures. The Kinect has the additional benefit of being cost effective and non-invasive.
The study’s hypothesis was that measures reported as having a high correlation to engagement in [10] will also positively correspond to when the subject is actively attending during the exam. The body lean and side lean measurements are an attempt to use skeletal data directly to replicate the results of the head and torso distance measures in previous research. It was also expected that head gaze will positively correlate with subjects’ attention and the more movement recorded, the more likely in-attention will be witnessed.
Behavior Type Measures
Not Looking In-Attentive Gaze Direction
Fidgety/Restless In-Attentive Gross Body Movement Fatigue/Tiredness In-Attentive Slouch / Posture
[image:23.612.141.472.430.520.2]Engagement Attentive Body Lean, Head Proximity At Attention Attentive Sitting up-right posture
Chapter 4
Methodology
4.1
Overview
This study attempted to measure the level of attention for test subjects participating in a sustained attention task. Each subject participated in well known attention tasks in order to provide an objective measure of the subject’s attentiveness. This measure was then compared with different measured features of body posture obtained from a Microsoft Kinect. Each test subject participated in 3 Continuous Performance Tasks (CPTs) for a total time of 1 hour. The tests were 14 minutes, 24 minutes, and 17 minutes long and run back to back with a one minute break between.
4.2
Subjects
4.3
Measures
Measures for this experiment were the results of three sustained attention tasks administered to the test subjects along with corresponding postureal data, collected by a Kinect.
Two of the tasks chosen were Continuous Performance Tasks (CPT), since CPTs tend to be longer than other attention tasks and have been shown to be a good measure of sustained attention. Since the test subjects were normal adults, they were expected to have well developed attention spans compared to young children and therefore less likely to commit errors. Providing a longer, more tedious exam than typically administered, offered a greater opportunity to capture lapses in attention.
Although many versions of the CPT have been developed, the basic methodology of these tasks remains consistent with that of the original. Subjects are presented with a variety of stimuli, which are displayed on a screen for a short duration and are instructed to respond to a predefined ”target” stimulus. A number of values are often recorded in these tasks, including omission errors and commission errors. In addition, response times for correct detections and for various commission errors are recorded in an effort to better measure problems of inattention and impulsivity [11].
4.3.1
PEBL
A test battery was created from three sustained attention tasks provided by the Psychology Experiment Building Language (PEBL) in order to measure different features of attention during the experiment. PEBL is an open source language de-signed for building psychology tests and comes equipped with implementations for a number of common psychological tests including several CPTs. The open source nature of PEBL makes it easy to modify tests to suit individual measurment require-ments. For this experiment the PEBL Continuous Performance Test (PCPT), Test of Attentional Vigilance (TOAV), and the PEBL Perceptual Vigilance Task (PPVT) were used.
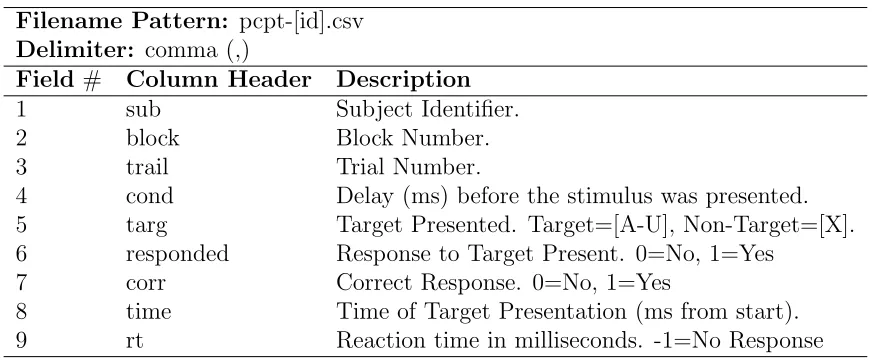
PCPT: PEBL Continuous Performance Test
Description: This test is an implementation of the well known Conner’s
asked to respond every time a letter is presented that is not the letter X. Stimuli are chosen randomly with an ’X’ appearing 10 percent of the time. During the PCPT the subject is presented with 360 letters at different inter-stimulus intervals (ISI). The entire test takes approximately 14 minutes. Each stimulus is presented for 250 milliseconds. The test is divided into 24 blocks with each block consisting of 20 trials. The ISI value changes at the beginning of each block, cycling between 1, 2, and 4-second delays. Six ISI cycles are completed during the test. PCPT measures 1) omissions 2) commissions 3) Hit RT 4) RT Std Error 5) Hit RT Block Change and 6) Hit SE Block Change.
Output: PCPT outputs two files: 1) A CSV data file containing features for each
trail and 2) a human readable text file report summarizing the results. For a complete description of the PCPT output fields and example documents “see appendix B on page 68”.
Filename Pattern: pcpt-[id].csv
Delimiter: comma (,)
Field # Column Header Description
1 sub Subject Identifier.
2 block Block Number.
3 trail Trial Number.
4 cond Delay (ms) before the stimulus was presented. 5 targ Target Presented. Target=[A-U], Non-Target=[X]. 6 responded Response to Target Present. 0=No, 1=Yes
7 corr Correct Response. 0=No, 1=Yes
[image:26.612.90.528.317.497.2]8 time Time of Target Presentation (ms from start). 9 rt Reaction time in milliseconds. -1=No Response
Table 4.1: PCPT raw data file format.
TOAV: Test of Attentional Vigilance
Description: This is the PEBL implementation of the visual version of the well
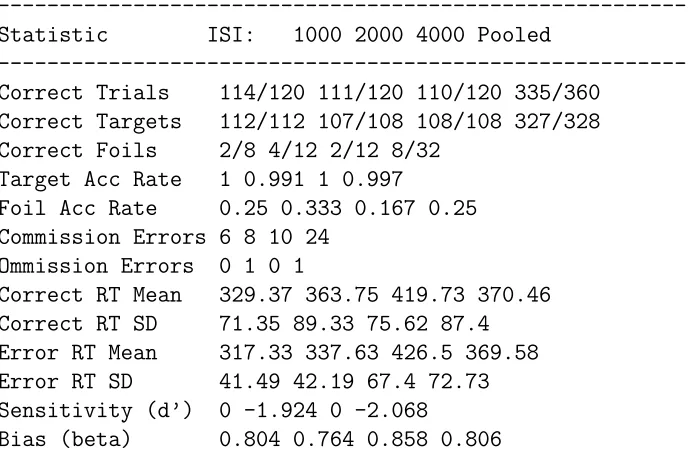
---Statistic ISI: 1000 2000 4000 Pooled
---Correct Trials 114/120 111/120 110/120 335/360
Correct Targets 112/112 107/108 108/108 327/328 Correct Foils 2/8 4/12 2/12 8/32
Target Acc Rate 1 0.991 1 0.997
Foil Acc Rate 0.25 0.333 0.167 0.25 Commission Errors 6 8 10 24
Ommission Errors 0 1 0 1
Correct RT Mean 329.37 363.75 419.73 370.46 Correct RT SD 71.35 89.33 75.62 87.4 Error RT Mean 317.33 337.63 426.5 369.58 Error RT SD 41.49 42.19 67.4 72.73 Sensitivity (d’) 0 -1.924 0 -2.068
Bias (beta) 0.804 0.764 0.858 0.806
---Table 4.2: Example PCPT report statistics.
whenever it is presented on the screen by pressing a defined key on the keyboard. This test includes two sections. During the first section, known as the infrequent condition, targets randomly occur once for every 3.5 non-targets. This pattern is reversed for the second half of the task, with targets appearing 3.5 times for every one non-target. This task measures Response Time, Response Time Variability, Performance Deterioration Rate, Errors of Omission, Errors of Commission, Post Commission Response Time, Multiple Responses, and Anticipatory Responses.
Output: TOAV outputs two files: 1) A CSV data file containing features for each
trail and 2) A human readable text file report summarizing the results. For a com-plete description of the TOAV output fields and example documents “see appendix D on page 74”.
PPVT: PEBL Perceptual Vigilance Task
Description: This is an implementation of a Psychomotor Vigilance Task (PVT).
[image:27.612.93.437.95.323.2]Filename Pattern: toav-[id].txt
Delimiter: whitespace (tab, space)
Field # Column Header Description
1 sub Subject Identifier.
2 trail Trial Number.
3 targ Target Presented. 0=Non-Target, 1=Target. 4 toofast Response too fast. 0=No, 1=Yes
5 responded Response to Target Present. 0=No, 1=Yes 6 corr Correct Response. 0=No, 1=Yes
[image:28.612.92.405.304.518.2]7 mult Multiple Responses to Target. 0=No, 1=Yes. 8 time Time of Target Presentation (ms from start). 9 rt Reaction time in milliseconds. -1=No Response
Table 4.3: TOAV raw data file format.
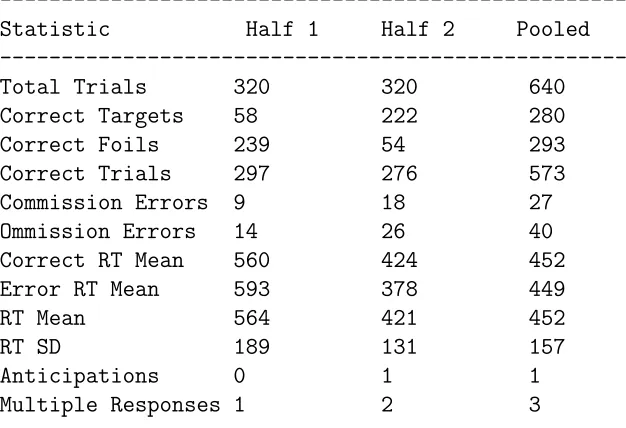
---Statistic Half 1 Half 2 Pooled ---Total Trials 320 320 640 Correct Targets 58 222 280 Correct Foils 239 54 293 Correct Trials 297 276 573 Commission Errors 9 18 27 Ommission Errors 14 26 40 Correct RT Mean 560 424 452 Error RT Mean 593 378 449
RT Mean 564 421 452
RT SD 189 131 157
Anticipations 0 1 1
Multiple Responses 1 2 3
---Table 4.4: Example TOAV report statistics.
long intervals. This test is used to identify and record lapses (which are defined as reaction times slower than 500ms).
Output: PPVT outputs two files: 1) A CSV data file containing features for each trail and 2) A human readable text file report summarizing the results. For a com-plete description of the PPVT output fields and example documents “see appendix C on page 71”.
Filename Pattern: ppvt-[id].txt
Delimiter: single space
Field # Column Header Description
1 sub Subject Identifier.
2 block Block Number.
3 trail Trial Number.
4 ISI Delay before target presentation.
5 ISIbin ISI ’bin’ by 1000 ms intervals. [1000-9000] 6 abstime Time of Target Presentation (ms from start). 7 rt Reaction time in milliseconds. -1=No Response 8 type Categorization of the reaction time. 1=Too
[image:29.612.100.519.165.340.2]Fast, 2=Typical, 3=Lapse, 4=Sleep Attack Table 4.5: PPVT raw data file format.
Because normal, non-inattentive adults tend to have well developed attentional skill, all CPTs suffer from a lack of omission errors when working with older individuals [11]. Nevertheless, the CPT is one of the best measures for attentional features in normal adults. As such, this study focused on using the CPTs’ measures for reaction time and reaction time variance for identifying inattention in normal adults [1]. Also, due to the concern of only collecting data from attentive individuals, for the PCPT test; subjects were divided into two groups. The first group participated in the PCPT test as typically administered, without any modifications.
The second group was given a modified version of the PCPT test which required them to attend to a secondary computer screen and answer questions about the images displayed in addition to the sustained attention task. Introducing this secondary objective created a divided attention situation where the test subject was incapable of providing their full attention to a single screen. A visual task was chosen to stay in the same modality as the visual continuous performance task so that both tasks could place demands on the same sensory resources (eyes). This provided an oportunity to detect when the subject’s focus was away from the sustained attention task and determine its impact on test performance.
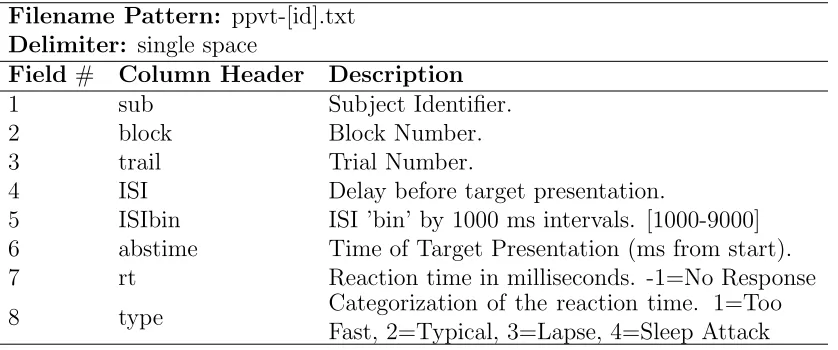
---Delay Count Median RT Mean RT SD RT
---1000 13 742 909.923 356.629
2000 16 1519.5 5484.38 15376.4 3000 4 1390.5 1317.25 561.523 4000 10 832 969.5 391.935 5000 18 804 1009.39 571.046 6000 14 881.5 2847.36 6920.1 7000 16 925 963.625 415.788 8000 15 619 882.867 510.153 9000 15 1004 1510.07 1717.56
---Too Fast: 0
Correct: 10 Lapse: 110 Sleep Attack: 1
---Table 4.6: Example PPVT report statistics.
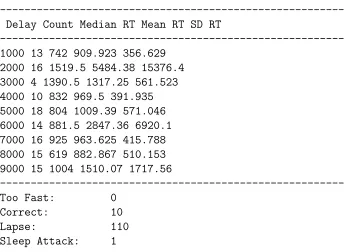
[image:30.612.92.440.88.340.2]T
est
Correct
T
argets
Omissions Commissions Mean
R T SD R T Correct R T Mean Error R T Mean An ticipations Num b er of Lapses T arget
P-CPT x x x x x x x non-X letters TOAV x x x x x x x x geometric shape
[image:31.612.139.473.93.235.2]PPVT x x x geometric shape
Table 4.7: Description of the features measured by each task in the test battery. Group Id PCPT PCPT(DA) TOAV PPVT
Group 1 x x x
Group 2 x x x
Table 4.8: Summary of administered tests by group.
4.3.2
Kinect
The Microsoft Kinect sensor was used during the battery of sustained attention tasks to collect posture and movement data. This data is categorized into two groups, cross-sectional and aggregate features. The Kinect was selected because of its ability to process and translate depth information into articulated figures within a defined three-dimensional space. This greatly simplifies the effort needed to track different parts of an individuals body over time.
Cross-sectional Features
Cross-sectional features are collected throughout the exam and were correlated with the subject’s response on a per target basis. That is, for each target/response pair the value of the cross-sectional features was examined. The study’s hypothesis was that a pattern will emerge in which subjects respond correctly to a target but have a higher than average response time p, % of the time they present feature x. The following cross-sectional features were assessed and recorded:
Distance Head
millime-ters) between the reported head joint and the location of the Kinect sensor.
Body Orientation
Measures the difference between the left and right shoulder depth values (in millimeters). This provides an estimation of the direction the body is facing. If the shoulders are square with the computer this value will be close to zero. As the body rotates away from the computer, this value increases.
Head Pose
Heading (in degrees) of the subjects face relative to the location of Kinect sensor. Directly facing the sensor is treated as a heading of zero degrees. This is calculated for yaw, pitch, and roll or rotation of the face around the y, x, and z axis, respectively.
Hand Position
Position of each hand in relation to the Kinect sensor. Measured in X,Y, and Z coordinate space with the Kinect sensor at 0, 0, 0.
Forward Body Lean
Angle and direction of back lean in relation to the hip. This is the angle between the Y component of the Hip Center-Shoulder Center edge and the Kinect Y axis.
Side Body Lean
Angle and direction of back lean in relation to hip. This is the angle between the X component of the Hip Center-Shoulder Center edge and the Kinect X axis.
Talking
Measures whether the individual is talking during any particular moment in time. Talking is a good measure of inattention in situations where the subject is supposed to be attending the stimulus but not verbally responding to it. This generally indicates there is a distraction and that the subject is at least partially attending to that over the target stimulus.
Aggregate Features
hypothesis was that individuals with a greater number of head movements would be identified as more inattentive than their peers by the collected CPT results. The aggregate features used in this study were:
Distance Head Mean Average value of the Distance Head feature during the recorded time period.
Distance Head Delta Represents the variance in Head joint positions. Provides a measure of how far the head was moving during the designated time window.
Body Orientation Average values for each metric reported in the body orientation.
Body Orientation Delta Represents the variance for each metric in the body ori-entation.
Gaze Percentage Percent of time gaze was directed at target.
Movement Head Total amount of movement by the Head vertex during the recorded time window. Calculated as a summation of the movement recorded for be-tween each frame.
Forward Body Lean Mean Average value of the Forward Body Lean feature during the recorded time period.
Forward Body Lean Delta Represents the variance in Forward Body Lean angles.
Side Body Lean Mean Average value of the Side Body Lean feature during the recorded time period.
Side Body Lean Delta Represents the variance in Side Body Lean angles.
Talking Percentage Percent of time the individual spent talking during the exam.
Raw Measures
Kinect Studio Along with the Kinect SDK, Microsoft has released a suite of
these applications were written to comma separated value (csv) files to be processed further for analysis.
Joint Data: The CSV file for joint information contains depth and x,y,z values for
12 of the 20 joints the Kinect is capable of tracking. Since we are working with seated test subjects whose legs are partially occluded behind a table, it was difficult to track any joints below the hip.
Head Pose Data: The CSV file for head pose and gaze tracking data contains
recorded values for head yaw, pitch, and roll.
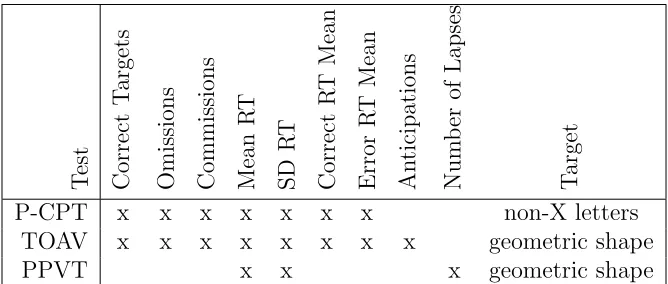
Audio Data: The CSV file for audio contains a calculation of volume, source angle,
beam angle and confidence. The beam angle describes the angle of the Kinect audio array. This can be adjusted at 10-degree increments between -50 and 50 to point toward target of interest. Accurately pointing the beam angle of the Kinect helps to improve the quality of audio collected. The reported source angle is an estimation of the direction the strongest speech is coming from. The source angle is accompanied by a confidence value, between 0 and 1, describing how reliable the reported source angle is.
Application Contents Test Ouput Filename
KinectAudioRecorder Timestamp, Confidence, Source Angle, Beam Angle, Volume
pcpt subject.pcpt.audio.csv toav subject.toav.audio.csv ppvt subject.ppvt.audio.csv
KinectJointRecorder Timestamp, All Joint Depths, All Joint Positions (X,Y,Z)
pcpt subject.pcpt.joint.csv toav subject.toav.joint.csv ppvt subject.ppvt.joint.csv
KinectGazeRecorder Timestamp, Yaw, Pitch, Roll
[image:34.612.93.559.360.556.2]Body Lean
[image:35.612.102.514.281.587.2]Body lean is the most commonly discussed posture for determining engagement [5] [19] [18]. One objective of this research was to determine if there is a relationship between forward body lean and attention. We know that users who are engaged tend to lean forward more than those who are not. Hence, identifying that a person is leaning forward is a strong indication that the person is also paying close attention. Leveraging the Kinect skeleton tracking framework forward body lean will be calcu-lated as the difference between the hip joint and head Z value. Large positive values for body lean indicate the subject is leaning toward the screen, values close to zero indicate an upright posture, and negative values indicate the subject is leaning back (away from the screen).
Side Lean
[image:36.612.94.522.223.487.2]Side lean is a less explored measure of attention and engagement than forward body lean. It was also be examined during this experiment to see if an upright posture is correlated with attention. Side lean is expected to be similar to measurements of slouch discussed by [19], and can be visualized as a person slouching sideways rather than forward. This measurement is calculated as the different between the hip joint and head position X value.
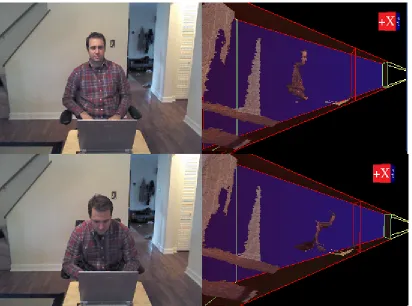
Figure 4.2: RGB and depth views from joint recording application comparing side body lean.
Body Orientation
Calculated values start close to zero with the shoulders square to the computer and increase as the body turns away. The further the orientation measure is from zero the less attentive the person is assumed to be.
Head Depth and Movement
Head depth is closely related to Body Lean, but looks solely at the proximity of the head to the screen and is not concerned with the body’s angle of inclination. It is possible to be far from the computer screen yet still have a significant Body Lean. Movement is a features discussed by [5] and [12] as correlating to attention and engagment. This study only examined movement of the head since most postural shifts change the location of the head. Hands and feet are also useful measures of body motion but both are largely occluded in the current setup and therefore not utilized as a measure in this study.
Head Pose (Gaze Tracking)
As of 1.5 the Kinect SDK offers face-tracking abilities which this study leveraged to estimate gaze direction. The Kinect uses both the depth and RGB data streams to build and track an 87 point model of the human face. Along with the 87 facial points identified and tracked by the Kinect, a calculation of the subjects head pose is provided. Head pose values of pitch, roll, and yaw can each be tracked between -90 to 90 degrees.
This study used the provided measurement of head pose to estimate the subjects gaze direction. A similar estimation of gaze was used by [2] to determine which gaze target students were looking at based on their head pose. This estimation is based on the theory that subjects frequently turn their head in the direction they are attending. [2] supported this theory with research from Stiefelhagen et al [20] and others who found eye gaze to correlate with focus of attention and head pose to commonly agree with eye gaze.
For the purpose of this study, subjects were classified as looking at the target if each head pose angle (yaw, pitch, and roll) was less than a predetermined threshold. The subject looking directly at the Kinect sensor register head pose values of (0.0, 0.0, 0.0) for yaw, pitch, and roll respectively.
this time eye gaze can be difficult to calculate without expensive equipment, such as high resolution cameras. [15] has done some interesting work on a technique which utilizes the Kinect face tracking in combination with several image processing techniques to obtain an estimation of eye gaze more accurate than is traditionally possible from low resolution cameras such as the one installed in the Kinect. This could be applied to future versions of this software to obtain better gaze direction estimations.
Figure 4.3: Comparison of from head pose tracking of subject looking at and away from screen.
Audio
In addition to body posture and head pose, this system measured the amount of noise in the room during the attention tests. Utilizing the Kinect’s build in microphone, volume and source direction were tracked and used to calculate an estimation of when the test subject was talking. Audio tracking is used to get an idea of how much interference from a different modality will affect a subject’s attention.
4.4
System
the test subject interacted during the experiment. Each subject performed three sustained attention tasks (outlined above) within the PEBL application. The result of each task was written to a Comma Separated File (CSV) which captured the user id, time of each test stimuli presentation, and all of the attention measurements specific to that task. While the attention task was being conducted, the Kinect Studio application (provided by Microsoft) was being run on a separate machine connected to a Kinect sensor located on a tripod directly behind the PEBL test computer and facing the user. Kinect Studio was used for recording time-stamped RGB, depth, and articulated data (at a rate of 30 frames per second) to an external file.
The second phase of the pipeline is a series of applications responsible for extracting a particular set of data from the saved Kinect Studio File. The applications are titled: AudioRecorder, JointRecorder, and GazeRecorder. These save audio, articulated figure, and head pose data to another set of CSV files.
The last stage of the pipeline is an application responsible for combining the results from both sets of CSV files into a summary file containing both measures of attention and posture. A time window was used to select which values from the recorded Kinect data files were associated with results of the attention tasks. This allowed for an analysis of data within each test subject by asking summary questions about the values of a feature before and after the presentation of each target during a PEBL attention task.
4.4.1
Hardware Architecture
Participants were asked to take the attention test battery during a single session, lasting approximately one hour. During testing, the subject was seated in a tradi-tional desk chair, including rolling feet and arms with a small notebook computer placed on a desk directly in front of them. The laptops built in keyboard and mouse were used for input during the attention task. The Kinect sensor was mounted 3 inches above the computer monitor approximately 3 feet from the student and facing directly at them. The exact distance of the Kinect from the student varied based on how close the student chose to sit from the screen. This configuration is believed to be a realistic estimation of how subjects might engage in automated tutoring systems or remote learning classrooms which is the main focus of this study.
The Kinect for Windows sensor was placed directly in front of the test subject on a video camera tripod behind the test machine. For the first round of testing the following configuration was used.
Distance 36” (from computer); 56” (from test subject) Height 49”
Sensor Angle -8 degrees (approx) Desk Height 26”
This architecture allowed for the collection of 1) Distance Head 2) Distance Torso 3) Body Orientation 4) Gaze Direction 5) Head Position 6) Hand Position 7) Volume Of Motion and 8) Side Body Lean.
4.4.2
Software Architecture
This study utilized software applications freely available from Microsoft and PEBL in addition to software developed solely for the purpose of the experiment. This section describes the role of each software application in the study.
Third Party Software
PEBL - The Psychology Experiment Building Language (PEBL) is an open source software project licensed under the GPL and designed to provide access to basic implementations of well known psychological experiments. This study utilized three of the provided experiments, the PCPT, TOAV, and PPVT.
Kinect Studio - Kinect Studio is a software application developed and distributed
Developed Software
KinectAudioRecorder [C#] - This application was developed to record
descrip-tive details about noise detected by the Kinect during the exam. The application is written in C# and is a modified version of the Microsoft Kinect SDK’s Kinect-Explorer application. This application was run during the exam and provided the initial Kinect data stream for the Kinect Studio application to connect to.
KinectJointRecorder [C#] - This application was developed to record joint
po-sition and depth values from the Kinects tracked skeltal frame. The application is a modified version of the Microsoft Kinect SDK KinectExplorer example and is run after the initial recording of the depth and RGB data streams by the Kinect Studio application.
KinectGazeRecorder [C#]- This application was developed to record head pose
information for estimating gaze direction. The application is a modified version of the Microsoft Kinect SDK FaceTrackingBasics example and is run after the initial recording of the depth and RGB data streams by the Kinect Studio application.
KinectFeatureBuilder [Java]- The KinectFeatureBuilder application was written
Chapter 5
Analysis
The data collected during this experiment contains information about each test sub-ject for each test taken. This analysis looks at patterns of behavior ’within’ and ’between’ test subjects.
Within:
Within analysis refers to analysis of data within a single test subject, or analysis of collected features during a single test execution, (cross-sectional).
Between:
Between analysis looks at the differences between test subjects in an attempt to find correlations across test subjects attention and body posture using the aggregate data collected from the Kinect and sustained attention tasks.
How Results Are Interpreted Most sustained attention tasks, especially CPTs,
between these different values can be overlooked during single variable correlation analysis.
5.1
Body Posture
This section will examine the relationships between posture and attention both within and between test subjects.
5.1.1
Within
The first set of results were the measures of body posture compared to attention within individual test subjects. Reaction time (RT) and reaction time standard deviation (RT STD) were independently treated as measures of attention for this analysis. For RT, smaller RT values indicated better attention. Likewise, smaller RT STD values are indicative of better attentiveness.
A linear regression was calculated, first with RT as the response variable and then with RT STD as the response variable for each of our cross-sectional measures of posture, HD, BODY LEAN, and SIDE LEAN, as well as their standard deviations. A resulting P-value smaller than 0.05 is considered significant and indicates a pos-sible correlation between the feature and the response. Linear regression results for this calculation did not result in significant or consistent correlations for any of the proposed measures of posture and reaction time.
One explanation for the lack of a correlation between measures of posture and at-tention is that a lack of sufficient body posture variance during a single atat-tention exam. The lack of variation in body posture for this sample is confirmed by a quick visual analysis of the tested features. 5.1 shows a line plot of head depth over time, during the course of the TOAV exam. Similar visual analysis was conducted for each feature and also across the PCPT and PPVT exams. Each inspection showed simi-lar results. This confirmation that our tested features vary infrequently during the course of the exam is an indication that analysis within test subjects might not be appropriate for this data set. A notable exception to this observation, was one test subject whose head depth changed significantly during the exam. This exception is discussed further during case studies in section 5.6.
Figure 5.1: A side by side comparison of Head Depth and Reaction Time. Each unique color represents a different test subject.
it is clear that, using reaction time and omission rate, most test subjects were clas-sified as attentive. Considering our hypothesis that movement is an indication of of inattention, the observed lack of motion during the exams is not a surprising result.
5.1.2
Between
This analysis looked at the measured attention and posture differences between test subjects in attempt to find correlations between test subjects attention and body posture during the test to determine if test subjects with particular body posture behaviors tend to perform better on attention tasks. We started by looking at the body posture feature of head depth. Given that engaged subjects tend to lean for-ward, bringing their head closer to the screen, we expected to find that test subjects with smaller average head depth during the course of the exam had better average reaction times. A visual analysis confirmed that several of the test subjects who sat closest to the screen performed well in regard to average reaction time.
between the feature and the response.
Linear regression results for the relationship between BLEAN and RT were statisti-cally significant for the PCPT and combined regression tests; this was also true for BLEAN and RT STD. For the TOAV exam, measures of Body Orientation (SDIFF) and Movement (MOVE) were statistically significant for both RT and RT STD. In-terestingly, Head Depth showed a relationship with RT only for the combined results. This is possibly related to the fact that test subjects expressed greater interest in, and performed better on, the PPVT exam and therefore tended to sit closer to the screen. A comparison of the collected results across all tests reflects this relationship. One explanation for why the relationship between Movement and RT was only iden-tified during TOAV is that, on average, test subjects were sitting very still during the attention exams. The length of the TOAV (24 minutes) may have caused greater dis-comfort or boredom with test subjects, leading toward more restless behavior. A full description of the linear regression results for posture features are described in 5.1 and 5.2.
[image:46.612.91.530.344.394.2]HD HD STD BLEAN BLEAN STD SLEAN SLEAN STD SDIFF SDIFF STD MOVE MOVE STD PCPT 0.13 0.877 0.056 0.833 0.333 0.99 0.575 0.589 0.759 0.963 TOAV 0.385 0.601 0.261 0.879 0.52 0.49 0.403 0.457 0.004 0.013 PPVT 0.263 0.862 0.24 0.824 0.314 0.658 0.145 0.606 0.431 0.719 Combined 0.008 0.933 0.01 0.845 0.091 0.431 0.1 0.789 0.443 0.331
Table 5.1: Single variable regression P-Values for posture features using Reaction Time as the response. P-Values smaller than 0.05 are considered statistically signif-icant and are highlighted in gray.
HD HD STD BLEAN BLEAN STD SLEAN SLEAN STD SDIFF SDIFF STD MOVE MOVE STD PCPT 0.073 0.856 0.01 0.905 0.262 0.585 0.632 0.835 0.75 0.861 TOAV 0.562 0.381 0.391 0.414 0.097 0.026 0.019 0.037 0.004 0.041 PPVT 0.449 0.972 0.38 0.386 0.612 0.72 0.624 0.767 0.381 0.524 Combined 0.08 0.856 0.031 0.981 0.258 0.341 0.243 0.441 0.988 0.822
Table 5.2: Single variable regression P-Values for posture features using Reaction Time Standard Deviation as the response. P-Values smaller than 0.05 are considered statistically significant and are highlighted in gray.
5.2
Head Pose
For visual attention tasks, such as the those used for this experiment, eye gaze should be a clear indication of whether the test subject is attending to the target. Here we review the usage of head pose, obtained from Kinect face tracking, for gaze estimation. For the purpose of this analysis, the following metrics were defined for head pose:
Look Away (LA)
A measurement signifying when the subject looks away from the screen. The subject is considered to be looking away from the screen any time the YAW value of the head pose is greater than 15 degrees away from 0.
LA COUNT
The number of recorded frames where the subject is determined to be looking away from the screen.
LA OM
The number of omission errors that occurred while the YAW was greater than 15 degrees away from 0.
LA OM %
The percent of omission errors that occurred while the subject was classified as looking away from the screen.
The strongest indication of in-attention in a CPT is the number of omission errors. Overall, our test setup witnessed few omission errors as was expected since the test group consisted of normal adults. The division of the PCPT exam into two groups with Group 2 participating in a divided visual attention task provided an excellent distraction which was easily measurable. A comparison of the number of omission between Group 1 and Group 2 shows a clear distinction between the two groups. Subjects participating in the divided attention version of the PCPT averaged 39.90 omission errors while subjects participating in the traditional PCPT exam only average 1.89 omission errors.
look-away metrics for these subjects reflected the system’s inability to accurately assess head pose. These cases are highlighted in Table 5.3 and clearly stand out as the only look-away metrics which did not correspond to the increased omission errors for the Group 2 test subjects.
The PCPT data set shows that 44.10% of omission errors occurred when subjects had a YAW value greater than 15 degrees. If we remove the suspect data from test subjects 2 and 18 we get 76.02% of omission errors occurring with YAW greater than 15 degrees. It is important to note that of all the measured YAW values only 12.84% of them were greater than 15 degrees.
SUBJECT ID GROUP ID OM CM RT RT STD LA COUNT LA OM LA OM %
1 2 53 11 474.80 387.44 9789 41 0.77
2 2 59 14 460.02 320.87 218 0 0.00
3 2 30 22 348.05 142.68 3610 24 0.80
4 1 3 10 318.83 76.31 490 3 1.00
5 2 19 22 342.35 91.14 5199 15 0.79
6 1 0 13 318.69 79.14 0 0 0.00
7 1 1 13 329.11 50.37 17 0 0.00
8 1 7 13 341.64 78.80 0 3 0.43
9 2 20 32 371.57 184.59 3992 13 0.65
10 1 1 8 447.68 238.27 296 1 1.00
12 1 2 15 355.23 82.30 0 1 0.50
13 1 0 13 335.49 75.15 165 0 0.00
14 2 41 13 433.06 209.37 762 32 0.78
15 2 5 6 562.23 214.67 6098 5 1.00
16 2 29 25 438.79 295.79 8087 21 0.72
17 2 24 13 322.16 87.48 3823 19 0.79
18 2 119 14 348.36 107.45 91 0 0.00
19 1 2 11 369.78 87.93 110 0 0.00
20 1 1 17 338.36 81.40 545 1 1.00
Group 1 Avg 1 1.89 12.56 351.54 92.81 172.9 1.7 0.44 Group 2 Avg 2 39.90 17.20 410.14 204.15 4166.9 17 0.63
[image:48.612.94.505.244.498.2]Group 2 Mod Avg 2 21.25 0.79
Table 5.3: Summary of test subject omission rates for PCPT test. Highlighted in gray are suspect values related to a known deficiency in the system. Group 2 Mod Avg is a calculation of group 2 averages with these values removed.
5.3
Audio
rate as dependent variables to determine if the total amount of time a subject spent talking during the exam affected their attention. Results showed that talking was not a significant predictor of reaction time or omission rate for any of the adminstered tests. This is a somewhat surprising result, but may be explained by the fact that the given attention tasks were entirely visual and required no responses to auditory stimuli. Additionally, a regression analysis was peformed with the total noise in the room as the independent variable to determine if more noise in the room acted as a distraction and lowered the test subjects attention. This regression also showed there was not a significant correlation between noise in the room and attention. This could be because the only noise in the room came from a conversation between the test subject and the test administrator and was controlled by the test subject. This conversation was only maintained while the test subject was asking questions or telling a story. That is, the subject may have been engaging in the conversation when the test was placing relatively few demands on his or her attentional capacity and hence the subject talking did not result in diminished performance.
Past divided attention research shows that individuals are significantly better at multi-tasking across multiple sensory modalities than within the same sense. This supports the non-significant regression results for the auditory features measured. Extending the results obtained from the Head Pose analysis, where multiple stimuli were competing for the same sensory organ, it follows that if given an auditory atten-tion task subject talking and external noise measures would have a larger relaatten-tionship with attention.
5.4
Multivariate Regression
The analysis thus far has attempted to find correlations between two variables using standard linear regression techniques. While visual inspection of the data seemed to indicate relationships between attention and posture, single variable regression analyses did not attain statistical significance. Consequently, this section explores several other techniques starting with a multivariate regression.
The complete results can be found in Appendix G, while the most significant findings are discussed below.
PCPT Based on single variable regression results, the features chosen as predictors for the PCPT multivariate regression were: AVGHD, HDGROUP, BODYLEAN, YAW, LOOK AWAY SUM, and PITCH.
Predictor Coef SE Coef T P Constant -285.1 568.6 -0.50 0.630 AVGHD 0.2788 0.4065 0.69 0.512 hdgroup -33.67 45.31 -0.74 0.479 TALK% 593.88 96.01 6.19 0.000 BODYLEAN -0.9020 0.4656 -1.94 0.089 fleangroup 78.19 30.83 2.54 0.035 YAW 0.396 1.993 0.20 0.848 YAWD -10.666 3.485 -3.06 0.016 LOOK_AWAY_SUM 0.033427 0.007586 4.41 0.002 PITCH 0.478 1.727 0.28 0.789 ROLLSD 19.043 6.150 3.10 0.015
S = 39.5593 R-Sq = 92.9% R-Sq(adj) = 84.1%
Analysis of Variance
Source DF SS MS F P
Regression 10 164906 16491 10.54 0.001 Residual Error 8 12519 1565
Total 18 177425
values were removed to obtain the following results:
Predictor Coef SE Coef T P Constant 91.30 54.37 1.68 0.121 TALK% 594.43 83.20 7.14 0.000 BODYLEAN -0.9789 0.3498 -2.80 0.017 fleangroup 78.52 25.51 3.08 0.011 YAWD -10.293 2.926 -3.52 0.005 LOOK_AWAY_SUM 0.031251 0.004522 6.91 0.000 PITCH 0.906 1.296 0.70 0.499 ROLLSD 17.062 4.892 3.49 0.005
S = 34.9136 R-Sq = 92.4% R-Sq(adj) = 87.6%
Analysis of Variance
Source DF SS MS F P
Regression 7 164016 23431 19.22 0.000 Residual Error 11 13409 1219
Total 18 177425
Further reduction of duplicate measures and poor contributors gives us
Predictor Coef SE Coef T P Constant -37.51 35.26 -1.06 0.304 TALK% 477.74 88.04 5.43 0.000 LOOK_AWAY_SUM 0.018755 0.003709 5.06 0.000 ROLLSD 19.426 5.977 3.25 0.005
S = 47.6061 R-Sq = 80.8% R-Sq(adj) = 77.0%
Analysis of Variance
Source DF SS MS F P
Regression 3 143430 47810 21.10 0.000 Residual Error 15 33995 2266
This demonstrates that if we combine the subject’s gaze direction and their verbal activity, we have a good prediction of what their reaction time variance will be. This also tells us that body posture features, such as head depth and lean were not as important as where the test subject was looking. This makes sense for PCPT as it was composed of two groups with the second group being requested to attend to a secondary visual stimulus. These results show that participation in the divided attention task had an effect on subject response time and the Kinect was able to capture sufficient information to identify the scenario.
TOAV For the TOAV test, setting RT as the response and selecting the predic-tors HDGROUP, LDROOP, LDROOP SD, RDROOP SD, YAWD, PITCHSD, and ROLLSD resulted in:
Predictor Coef SE Coef T P Constant 472.76 69.20 6.83 0.000 hdgroup 33.95 19.85 1.71 0.111 LDROOP -2410 1083 -2.23 0.044 PITCHSD 3.177 5.132 0.62 0.547 ROLLSD 3.818 7.311 0.52 0.610
S = 44.7602 R-Sq = 63.1% R-Sq(adj) = 51.8%
Analysis of Variance
Source DF SS MS F P
Regression 4 44616 11154 5.57 0.008 Residual Error 13 26045 2003
Total 17 70662
PPVT For RT STD the selected predictors were HDGROUP, TALK%, BODYLEAN, LDROOP,
S = 34.0259 R-Sq = 42.4% R-Sq(adj) = 27.0%
Analysis of Variance
Source DF SS MS F P
Regression 4 12771 3193 2.76 0.067 Residual Error 15 17366 1158
Total 19 30137
TOAV+PPVT Last, we look at the combined results of TOAV and PPVT. PCPT
was left out since it was determined head pose has such a large impact on that result set. Looking at both TOAV and PPVT together will help us identify features that were predictive across multiple attention tasks.
Predictor Coef SE Coef T P Constant 85.67 18.17 4.72 0.000 SDHD 0.6768 0.2866 2.36 0.025 AVGVOL -2862 1019 -2.81 0.009 TALK% 493.8 131.4 3.76 0.001 BODYLEANSD -2.9684 0.9083 -3.27 0.003 SIDELEANSD 4383 1378 3.18 0.004 YAWD -7.452 3.533 -2.11 0.044 ROLLSD 8.359 3.485 2.40 0.023
S = 34.2345 R-Sq = 57.6% R-Sq(adj) = 47.0%
Analysis of Variance
Source DF SS MS F P
Regression 7 44627 6375 5.44 0.001 Residual Error 28 32816 1172
Total 35 77443
room talking.
The summary chart for the multivariate regression analysis displays interesting re-sults in the frequency of certain features in the final regression equation. The most frequent features were ROLL STD and TALK% with BODYLEAN, PITCH, and YAW STD close behind. The most surprising value was how often LDROOP was used in the equation and how infrequently SIDELEAN was used. This may indi-cate that when a subject slumps sideways in a chair they may only be shifting their shoulders and not their entire body. This body posture could be picked up by an LDROOP, but not the calculation used for SIDELEAN.
TEST RESPONSE RSQ PVAL AV
GHD HDGR OUP SDHD HDSTDGR OUP A V GV OL SD V OL T ALK% BOD YLEAN FLEANGR OUP BOD YLEANSD
SIDLEAN SIDELEANSD SDIFF SDIFFSD LDR
OOP LDR OOP SD RDR OOP RDR OOP SD Y A W Y A WD LOOK A W A Y SUM
PITCH PITCHSD ROLL ROLLSD
PCPT RT 36.4 0.125 x x x x
PCPT RTSTD 92.4 0 x x x x x x x
PCPT RTSTD 80.8 0 x x x
TOAV RT 63.1 0.008 x x x x
TOAV RTSTD 60.5 0.012 x x x x
PPVT RT 48.6 0.164 x x x x x x
PPVT RTSTD 42.4 0.067 x x x x
TOAV PPVT RT 27.6 0.063 x x x x x
TOAV PPVT RTSTD 28 0.012 x x x
TOAV PPVT RTSTD 61.6 0.001 x x x x x x x x x
TOAV PPVT RTSTD 57.6 0.001 x x x x x x x
[image:54.612.94.538.245.414.2]2 2 2 1 2 0 7 5 2 2 0 2 1 1 3 0 1 1 1 5 2 4 1 0 9
Table 5.4: Results of multivariate regression for all attention tasks.
5.5
Groups
Groups were identified for HD, BODYLEAN, TALK, and YAW. For each group the average RT and RT STD were compared.
5.5.1
Head Depth
[image:55.612.94.540.263.394.2]The first grouping used was head depth. Features of head depth and head depth stan-dard deviation were divided into three groups. The boundaries for each group were chosen to provide distinguishable groups as much as possible. Group 0 represents values below the average, Group 1 represents the average, and Group 2 represents above average.
Figure 5.2: Line plot of all test subject average head depths. Horizontal orange bars represent division lines for the three groups, below average, average, and above average.
Group Id Group Range (mm) # in Group Average Head Depth (mm) Average RT (ms) Average RT STD (ms)
0 <1300 16 1253.690115 338.6400384 90.75586022
1 1300 - 1400 23 1355.994657 364.3284019 98.55166589
2 >1400 21 1472.020674 405.5424338 136.3229105
Table 5.5: Comparison of RT and RT STD for subjects grouped by head depth. A brief examination of the groupings for head depth, found in 5.5, shows those grouped with below average head depth values (sitting closer to the screen) had slightly faster average RT and a smaller variance in RT. This group also had an average RT and RT STD which was slower and had more variance. These values appear to agree with the notion that attentive subjects tend to sit closer to the screen.
Source DF SS MS F P Factor 2 42786 21393 5.51 0.007 Error 57 221383 3884
Total 59 264169
The P-Value of 0.007 is a good indication that there is a statistical difference between the RT values of the different groups.
ANOVA for RT STD
Source DF SS MS F P Factor 2 23485 11743 2.37 0.103 Error 57 282878 4963
Total 59 306363
5.5.2
Head Depth Variance
Features of head depth variance were also divided into three groups. The boundaries for each group was chosen to create as clearly distinguishable groups as possible. Group 0 represents values below the average, Group 1 represents the average, and Group 2 represents above average.
Group Id Group Range (mm) # in Group Average Head Depth Std (mm) Average RT (ms) Average RT STD (ms)
0 <40 34 21.75301937 367.2458799 99.81616397
1 40 - 80 15 54.91220139 371.7484665 139.2147832
[image:56.612.91.333.97.154.2]2 >80 11 107.9527625 386.5089137 99.96289797
Table 5.6: Comparison of RT and RT STD for subjects grouped by Head Depth Std. ANOVA for RT
Source DF SS MS F P Factor 2 3084 1542 0.34 0.716 Error 57 261085 4580
Total 59 264169
ANOVA for RT STD
Source DF SS MS F P Factor 2 17431 8716 1.72 0.188 Error 57 288932 5069
5.5.3
Body Lean
Features of body lean were divided into three groups. The boundaries for each group was chosen to create as clearly distinguishable groups as possible. Group 0 represents values below the average, Group 1 represents the average, and Group 2 represents above average.
Group Id Grou