models of the interaction between the user and the system, whether it be to run a simulation, conduct an economic analysis, measure system performance, or simply to better understand the interactions. In this pa-per, we present a cost model that characterizes a user examining search results. The model shows under what conditions the interface should be more scroll based or more click based and provides ways to estimate the number of results per page based on the size of the screen and the var-ious interaction costs. Further extensions to the model could be easily included to model different types of browsing and other costs.
1
Introduction
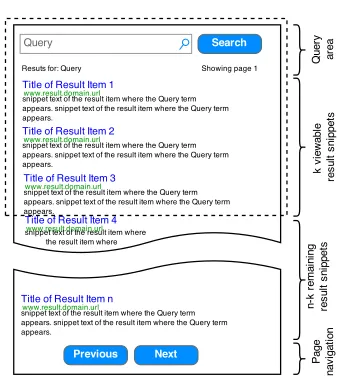
Fig. 1. The area marked by the dotted line shows how much of the page is initially visible, whereksnippets can be seen.kwill vary according to screen size. If the number of results per pagenis larger thank, thenn−kresults are below the fold.
2
Cost Model
To develop a cost model for results browsing we assume that the user will be interacting with a standard search engine result page (SERP) with the following layout: a query box, a list of search results (snippets), and pagination buttons (see Figure 1). Put more formally, the SERP displaysnsnippets, of which only k are visible above-the-fold. To view the remaining n−k snippets, i.e., those that are below-the-fold, the user needs to scroll down the page, while to see the nextnsnippets, the user needs to paginate (i.e., click next). And so we wonder whether is it better to scroll, click, or some combination of?
Here, we consider the case where the user wants the document at themth result. However, mis not known a priori. To calculate the total browsing costs we assume that the user has just entered their query and has been presented with the result list. We further assume that there are three main actions the user can perform: inspecting a snippet, scrolling down the list, or clicking to go to the next page. Therefore, we are also assuming a linear traversal of the ranked list. Each action incurs a cost:Csto inspect a snippet,Cscrto scroll to the next
snippet3, and when the user presses the ‘next’ button to see the subsequentn
results, they incur a click costCc. The click cost includes the time it takes the
user to click and the time it takes the system to respond. Given these costs, we can now express a cost model for browsing to themth result as follows:
Cb(n, k, m) =b m
nc.Cc
| {z }
clicking
+bm
nc.(n−k) + (mr−k)
.Cscr
| {z }
scrolling
+ m.Cs
| {z }
inspecting
(1)
3
2.1 Application and Example
With this model it is possible to analyze the costs of various designs by setting the parameters accordingly. For example, a mobile search interface with a small screen size can be represented with a low k, while a desktop search interface with a large screen can be characterized with a largerk. The interaction costs for different devices can also be encoded accordingly.
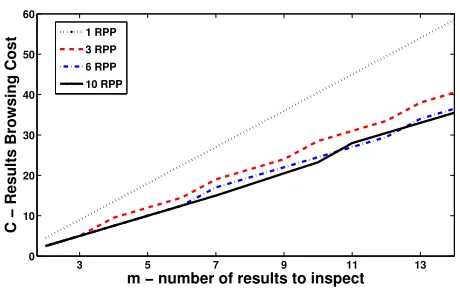
Figure 2 shows an example of the cost of browsingmresults when the number of results presented per page (n) is 1, 3, 6 and 10 with up to k = 6 viewable results in the display window. Here we have approximated the costs of interaction as follows: 0.25 seconds to scroll, 2 seconds to click and 2.5 seconds to inspect a snippet4.
Intuitively, displaying one result per page requires the most time as (m−1) clicks are needed to find the mth document. Displaying three results per page is also costly as m increases requiring approximatelym/3clicks. However, the difference in costs for 6 and 10 results per page vary depending on the specific number of results the user wants to inspect. For example, if m=12 then 6 results per page is lower in cost; whereas if m=13 then 10 results per page is lower in cost. In this example, since scrolling is relatively cheap, one might be tempted to conclude that the size of the result page should be as large as possible. However, using the model, we can determine the optimal size of the result page depending on the different parameters.
2.2 Estimating SERP Size
To determine the optimal number of results to show per page,n∗, we want to minimizeCb. We can do this by differentiating the cost function with respect to
4 These values were based on the estimated time spent examining each snippet being between
3 5 7 9 11 13 0
10 20 30 40 50 60
m − number of results to inspect
C − Results Browsing Cost
[image:4.612.188.418.112.256.2]1 RPP 3 RPP 6 RPP 10 RPP
Fig. 2.The cost (total time in seconds) to examinemsnippets for SERPs of different
sizes (cscr= 0.25, cc= 2, cs= 2.5 seconds).
n. However, sinceCbcontains floor operators we need to use an approximation
of Eq. 1:
ˆ
Cb(n, k, m)≈ m
n.Cc+ m
n.(n−k).Cscr+Cs.m (2)
which essentially provides a smoothed estimate of the clicking and scrolling costs (here we drop/ignore the inspect costs as they are constant). We can now dif-ferentiate this function, to obtain:
∂Cˆb ∂n =−
m n2.Cc+
m
n2.k.Cscr (3)
and then solve the equation by setting ∂Cˆb
∂n = 0, in order to find what values
minimize Eq. 2. The following is obtained:
−m n2.Cc+
m
n2.k.Cscr= 0 m
n2.k.Cscr= m n2.Cc
k.Cscr=Cc (4)
Interestingly, n disappears from the equation. This at first seems counter intuitive, as it suggests that to minimize the cost of interactionnis not a factor. However, on closer inspection we see that the number of results to show per page depends on the balance betweenkandCscr, on one hand, andCc, on the other.
If k.Cscr is greater than, equal to, or less than Cc, then the influence on total
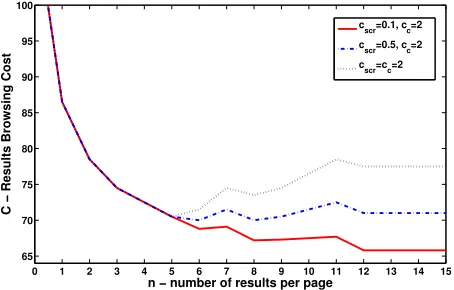
cost in Equation 1 results in three different cases (see below). To help illustrate these cases, we have plotted three examples in Figure 3, where the user would like to inspectm=25result snippets, and a maximum ofk=6result snippets are viewable per page.
1. if k.Cscr>Cc, then n should be set to k. In fact, if n=k, then Cscr
our model, where the total cost decreases at a diminishing rate. However, it is likely that other costs, which have not been modelled (i.e., cognitive costs, download costs, etc.) would lead to an increase in total cost at some point.
0 1 2 3 4 5 6 7 8 9 10 11 12 13 14 15
65 70 75 80 85 90 95 100
n − number of results per page
C − Results Browsing Cost
c
scr=0.1, cc=2
c
scr=0.5, cc=2
[image:5.612.191.418.354.499.2]cscr=cc=2
Fig. 3.An example of how the cost changes as the page size increases, whenm= 25
andk≤6 for the three different cases ofk.Cscr versusCc.
3
Discussion & Future Work
We have derived a general cost model of result browsing, which provides an indication of how the total cost of interaction changes with SERP size (n), screen size (k) and the associated interaction costs. In a desktop setting, as modeled above, where k≈6 and the cost of click Cc is generally larger than the scroll
costCscr, it is likely that the total cost is approximated by the blue dot dashed
size to beyond ten would lead to lower total costs, this is at a diminishing rate. In this model, we have assumed a fixed download cost, (within Cc). However,
a more realistic estimate of this cost would be proportional to n, such that Cc(n), where a larger page takes longer to download. Another refinement of the
model would be to condition scrolling on the number of results that need to be scrolled through; as users might find it increasingly difficult and cognitively taxing to scroll through long lists. Nonetheless, our model is still informative and a starting point for estimating the browsing costs. Future work, therefore, could: (i) extend the model to cater for these other costs in order to obtain a more accurate estimate of the overall cost, (ii) obtain empirical estimates for the different costs, on different devices (e.g., laptops, mobiles, desktops, tablets, etc.) as well as with different means of interaction (e.g., mouse with/without a scroll wheel, touchscreen, touchmouse, voice, etc.), and, (iii) incorporate such a browsing model into simulations, measures and analyses. A further extension would be to consider different types of layouts (e.g., grids, lists, columns, etc.) and different scenarios (e.g., finding an app on a tablet, mobile, etc.).
Acknowledgements:Thanks to all our tutorial participants who undertook this
mod-elling exercise and helped us refine the model. Thanks to Diane Kelly & Kathy Brennan for the numerous conversations about clicks and scrolls which led to this model & title.
References
1. Azzopardi, L.: Modelling interaction with economic models of search. In: Proc. of the 37th ACM SIGIR conference. pp. 3–12 (2014)
2. Azzopardi, L., Kelly, D., Brennan, K.: How query cost affects search behavior. In: Proc. of the 36th ACM SIGIR conference. pp. 23–32 (2013)
3. Azzopardi, L., Zuccon, G.: An analysis of theories of search and search behavior. In: Proceedings of the 2015 International Conference on The Theory of Information Retrieval. pp. 81–90 (2015)
4. Baskaya, F., Keskustalo, H., J¨arvelin, K.: Time drives interaction: simulating ses-sions in diverse searching environments. In: Proc. of the 35th ACM SIGIR confer-ence. pp. 105–114 (2012)
5. Baskaya, F., Keskustalo, H., J¨arvelin, K.: Modeling behavioral factors in interactive ir. In: Proc. of the 22nd ACM SIGIR conference. pp. 2297–2302 (2013)
6. Card, S.K., Moran, T.P., Newell, A.: The keystroke-level model for user perfor-mance time with interactive systems. Comm. of the ACM 23(7), 396–410 (1980) 7. Kashyap, A., Hristidis, V., Petropoulos, M.: Facetor: Cost-driven exploration of
faceted query results. In: Proc. of the 19th ACM CIKM. pp. 719–728 (2010) 8. Kelly, D., Azzopardi, L.: How many results per page?: A study of serp size, search
behavior and user experience. In: Proc. of the 38th ACM SIGIR Conference. pp. 183–192. SIGIR ’15 (2015)
9. Pirolli, P., Card, S.: Information foraging. Psych. Review 106, 643–675 (1999) 10. Russell, D.M., Stefik, M.J., Pirolli, P., Card, S.K.: The cost structure of
sensemak-ing. In: Proceedings of the INTERACT/SIGCHI. pp. 269–276 (1993)
11. Smucker, M.D., Clarke, C.L.: Time-based calibration of effectiveness measures. In: Proc. of the 35th ACM SIGIR conference. pp. 95–104 (2012)