Rochester Institute of Technology
RIT Scholar Works
Theses Thesis/Dissertation Collections
2012
The Development of a shop floor control software
module for a new branding and packaging scheme
George DiazFollow this and additional works at:http://scholarworks.rit.edu/theses
This Master's Project is brought to you for free and open access by the Thesis/Dissertation Collections at RIT Scholar Works. It has been accepted for inclusion in Theses by an authorized administrator of RIT Scholar Works. For more information, please [email protected].
Recommended Citation
THE DEVELOPMENT OF A
SHOP FLOOR CONTROL SOFTWARE MODULE FOR
A NEW
BRANDING & PACKAGING SCHEME
BY
GEORGE DIAZ
MASTER’S DEGREE PROJECT
Submitted to the
Department of Packaging Science
College of Applied Science and Technology
in partial fulfillment of the requirements
for the degree of
Master of Science
Rochester Institute of Technology
iii
Department of Packaging Science College of Applied Science and Technology
Rochester Institute of Technology Rochester, New York
CERTIFICATE OF APPROVAL
______________________________
M.S. DEGREE PROJECT
______________________________
The M.S. degree Project of George Diaz has been examined and approved by the Project committee as satisfactory
for the Project requirements for the Master of Science Project
_______________________________
_______________________________
_______________________________
iv
May 14th 2012
COPY RELEASE
THE DEVELOPMENT OF A SHOP FLOOR CONTROL SOFTWARE MODULE FOR THE IMPLEMENTATION OF A NEW
BRANDING & PACKAGING SCHEME AT
DIFFINITY GENOMICS
I, George Diaz, hereby grant permission to the RIT Library of the Rochester Institute of
Technology to reproduce my Project in whole or in part. Any reproduction will not be for commercial use or profit.
Phone:
v
ACKNOWLEDGEMENTS
I would like to thank:
Efrain Rivera, for his support and interest in my educational growth. Your endorsement of my
proposed career plan at Bausch & Lomb enabled the funding of my Executive Master’s
Packaging Program at RIT. Your continued advice throughout the years has enabled me to
succeed in my professional career and personal life.
Jeff Helfer and Robin Hodownes for their continued support at Diffinity Genomics. Your ability
to support my shop floor software solution will enable me to manufacture and package the
newest Rapidtip® products to market.
The faculty in the Packaging Science Department at RIT for providing in-depth academic
instruction with personal commitment. It was a pleasure to participate in class discussions
(virtually and on site). Your contributions always provided real world perspectives on the
subject matter at hand. I want to thank Deanna Jacobs for her continued guidance, support, and
encouragement while at RIT. Many thanks for all the time invested in me as my program
advisor. Finally, I would like to thank Craig Densmore, my thesis advisor, for his wisdom,
support, and encouragement throughout his teachings and the evolution of my thesis project.
vi
DEDICATION
This Project is dedicated to my family: my wife, Mariella, and my two sons, Austin
George and Alex George. Your patience and understanding through our journey was much
vii
THE DEVELOPMENT OF A SHOP FLOOR CONTROL SOFTWARE MODULE FOR THE IMPLEMENTATION OF A NEW
BRANDING & PACKAGING SCHEME AT
DIFFINITY GENOMICS
By
George Diaz
ABSTRACT
In the near future, Diffinity Genomics will launch several new products into the market-
place. Key to Diffinity Genomics’ success will be its ability to coordinate and manufacture
multiple products quickly. The development and successful implementation of a Shop Floor
Control database solution will ensure that Diffinity Genomics’ product launch will be a company
success story. This solution will involve the development of a relational database in the
FileMaker Pro software platform. To achieve this goal, significant efforts will need to be
invested in the development of an all-encompassing process flow diagram. This development
will lead to the development of repository tables in which data will be collected and stored. The
integration of these repository tables into the process flow diagram will lead the developer to the
establishment of a data relationship map; hence a relational database has been proposed as a
potential solution to the management of Diffinity Genomics’ product development growth.
Successful completion of the relational database solution will involve the development of agile
scripting, a software development style in which the developer controls the user’s fate through
clever manipulation of the user’s navigational and transactional options within the database
dashboard.
1
Table of Contents
1 INTRODUCTION: DIFFINITY GENOMICS STORY ...4
1.1 THE MISSION ...5
1.2 PROJECT GOAL ...5
2 THE COMPANY: “DIFFINITY GENOMICS” ...7
2.1 PRODUCT OVERVIEW: DNA AMPLIFICATION AND PURIFICATION ...9
2.1.1 Step 1: DNA Amplification: The science of DNA replication ...9
2.1.2 Step 2: DNA Purification: The science of cleaning up a “dirty” DNA solution ... 12
3 DIFFINITY GENOMICS’ PRODUCT ROADMAP ... 15
3.1 New Product Development ... 15
3.2 New Product Branding ... 16
3.3 Needed capabilities ... 16
4 DIFFINITY GENOMICS’ PRODUCT EXPANSION: TO DIFFINITY AND BEYOND! ... 18
4.1 DIFFINITY GENOMICS’2010INITIAL PRODUCT LAUNCH ... 18
4.2 DIFFINITY GENOMICS 2012: NEW PRODUCTS, NEW LOOK! ... 20
4.2.1 Current Product expansion plan ... 20
4.2.2 Rapidtip® in a Rainin Pipette Format. ... 20
4.2.3 New product development “To Diffinity and Beyond!” ... 21
4.3 THE NEW DIFFINITY GENOMICS ... 22
4.3.1 New Product - New Look ... 22
4.3.2 Proposed Packaging Configurations (tip box) ... 25
4.3.3 Proposed Packaging Configurations (Labeling) ... 27
4.3.4 In search of a new label printer ... 27
4.3.5 Oh my… so much data, so little time! ... 28
2
5.1 THE EVOLUTION OF DATABASE SYSTEMS ... 29
5.2 A BASIC REVIEW OF DATABASE THEORY ... 29
5.3 THE RELATIONSHIP BETWEEN THE DATASET... 30
5.4 THE “ONE-TO-ONE”RELATIONSHIP ... 30
5.5 THE “ONE-TO-MANY” RELATIONSHIP ... 31
5.6 DATABASE DESIGN ... 33
5.6.1 Database tables ... 33
5.6.2 Database fields ... 34
5.6.3 Database relationship... 35
5.6.4 FileMaker Pro: The simple solution ... 36
6 THE SOLUTION ... 37
6.1 DIFFINITY GENOMICS PRODUCT WORKFLOW ... 37
6.1.1 Diffinity Genomics’ Customers... 39
6.1.2 Diffinity Genomics Orders Options ... 39
6.1.3 Diffinity Genomics Manufacturing: Testing and Disposition ... 40
6.1.4 The fine art of packaging product at Diffinity Genomics ... 41
6.1.5 Diffinity Genomics’ subsequent packaging options (secondary) ... 43
6.1.6 Diffinity Genomics Tertiary packaging and shipping ... 43
6.1.7 Summary: Diffinity Genomics’ workflow ... 44
6.2 THE SOLUTION: DIFFINITY GENOMICS’SHOP FLOW CONTROL DATABASE ... 44
6.3 DATABASE FRONT END: MAIN MENU ... 44
6.3.1 Lot number nomenclature ... 48
6.3.2 Lot menu management ... 50
6.4 PRODUCTION LOT MANAGEMENT ... 51
6.5 PRODUCTION LOT TESTING... 53
6.6 PRODUCTION LOT TESTING OUTCOME ... 55
3
6.8 LABEL PRINTING PROCESS ... 61
6.8.1 Label traceability and label control ... 63
6.9 THE FINAL PRODUCT ... 64
7 THE IMPORTANT DETAILS BEHIND THE SOLUTION ... 66
7.1 THE DATABASE TABLE STRUCTURE ... 66
7.2 DATABASE RELATIONSHIPS ... 67
7.3 DATABASE SCRIPTING ... 69
7.4 DATABASE IMPLEMENTATION AND VALIDATION... 69
7.5 LOT TRACEABILITY AND ERROR PROOFING ... 71
8 CONCLUSIONS ... 74
9 REFERENCES ... 78
10 LIST OF TABLES ... 79
11 LIST OF FIGURES ... 81
12 ATTACHMENTS ... 83
4
1
Introduction: Diffinity Genomics Story
Imagine you are the manager of an ice cream shop. Your shop only sells plain vanilla-
flavored ice cream in a plain cone. Your shop has sold plain vanilla ice cream cones for the past
year…
One day you are approached by the owner(s) of the company, and they share the
following information:
George, we have some news to share… Our R&D team has
discovered a new spice, it’s called “chocolate.” We have
completed field testing and feedback is very positive. In the near
future, this shop will sell 3-4 unique ice cream flavors in several
different formats: flavored cones and various dish sizes. With
these new changes, our marketing team wants to roll out a new
product “look,” including several new packaging schemes! Oh
yes, be prepared to sell this product through the store as well as
through regional distributors; they too have unique packaging
requirements. George, are you ready for this mission? How
5
1.1
The Mission
Although Diffinity Genomics does not sell ice cream, the story shared resembles a recent
moment in time within the company’s history. The following section provides an overview of
the project’s goals and objectives and the proposed solutions.
1.2
Project Goal
Over the next six months, Diffinity Genomics will be launching several new products in
several different configurations. This product expansion has provided the opportunity for
Diffinity Genomics to launch several new product packaging configurations that embrace a new
branding look.
The key to Diffinity Genomics’ success will be its ability to coordinate and manufacture
multiple products quickly. The development and successful implementation of a Shop Floor
Control database solution will ensure that Diffinity Genomics’ product launch would be a
company success story. This solution will involve the development of a relational database in
the FileMaker Pro software platform. To achieve this goal, significant efforts will need to be
invested in the development of an all-encompassing process flow diagram. This development
will lead to the development of repository tables in which data will be collected and stored. The
integration of these repository tables into the process flow diagram will lead the developer to the
establishment of a data relationship map; hence a relational database has been proposed as a
potential solution to the management of Diffinity Genomics’ product development growth.
Successful completion of the relational database solution will involve the development of
6
through clever manipulation of the user’s navigational and transactional options within the
database dashboard.
This project is divided into three major areas of discussion:
1) The first portion of the project will provide an insight into Diffinity Genomics and its
core technology. A product roadmap section will provide an insight to the company’s
product expansion
2) The second portion of the project will provide guidance into the fundamental theory
of database technology with specific discussions on relational databases.
3) The third section will elaborate on the project’s solution: a shop floor control
7
2
The Company: “Diffinity Genomics”
The following company information has been referenced from Diffinity Genomics’
company brochure:
“Diffinity Genomics is a closely held New York State 503C Corporation that has
developed proprietary technologies for separating molecules in solution for a large span of
applications. We are currently selling high-volume, high-margin, single-use products to the
rapidly growing $1.2 billion non-regulated life science market for nucleic acid (e.g., DNA)
extraction and purification products. Our products provide dramatic improvements in customer
productivity, ease of use, labor requirements, capital costs, and environmental waste.
Our initial target is the market for nucleic acid extraction and purification tools, one of
the largest and fastest growing segments of the life science industry (13.6% CAGR). Diffinity’s
Rapidtip® is targeting a severe bottleneck in the ubiquitous process for extracting and purifying
nucleic acids for many downstream applications. The Rapidtip® reduces the time required to
purify nucleic acids by more than 10 to 25 fold while reducing labor and capital costs. Its simple
design integrates seamlessly into existing laboratory workflows.
Our high-margin Rapidtip® consumable is a single-use, completely self-contained
“functional” pipette tip that enables very rapid sample purification in a single simple step with no
additional reagents or capital equipment. There are approximately 670 million extraction and
purifications performed each year by approximately 390,000 life science professionals working
in 45,000 labs worldwide.
A box containing 96 Rapidtip® lists at $160. We are currently selling direct in the U.S.,
8
including the leading worldwide supplier to the biological, chemical and laboratory consumable
markets. The Company’s products do not require regulatory approval.
Diffinity Genomics is committed to building jobs in Western New York. The Company
manufactures its consumables at its factory in Rochester, NY. Diffinity uses local vendors for
services, components, and supplies. We currently have 12 employees, with 4 additional product
sales and marketing positions to be filled over the next 12 months.
Having already spent a number of years incubating the technology, product designs and
manufacturing processes, our goal is now to profitably achieve a valuation greater than $40
million within the next 3-4 years and realize a successful exit event for our genomic business,
prior to commercializing non-genomic applications of the Company’s molecular separation
technologies. We are positioned for rapid growth through the introduction of products that offer
a strong value proposition for other unmet nucleic acid extraction/purification needs and other
molecular separation applications, all by leveraging previously developed technologies, product
designs, manufacturing processes and marketing expertise. We now seek additional funding to
introduce portfolio products, grow sales and earnings, and position the Company as a market
leader as a precursor to a successful exit event.
Diffinity’s technology and initial product were awarded a Top 10 Life Science Innovation
Award for 2010 by The Scientist (finishing 4th and ahead of several billion-dollar companies).
The company was also awarded the North American 2011 Entrepreneurial Company of the Year
– Life Science Research Tools, by a leading business research firm and was selected by the
White House Business Council as an example of a technology-based economic development
9
Diffinity’s management team includes multiple, successful serial entrepreneurs
accomplished in R&D, operations, sales and marketing, business development, finance,
mergers/acquisitions, and substantial knowledge of the genomics industry.”1
2.1
Product Overview: DNA amplification and purification
In simple terms, a sample of DNA needs to be amplified (increased in quantity, typically
increased concentration) in order to be analyzed. The process of DNA amplification involves the
cyclic heating and cooling of the sample in a solution of primer and dimer solution. Once the
DNA amplification is completed, the solution (containing the wanted DNA protein and the
unwanted building blocks of primers and dimers) needs to be removed or “purified.”
The following section illustrates the two-step process involved in the amplification and
purification of a typical DNA sample.
2.1.1 Step 1: DNA Amplification: The science of DNA replication
The following section explains, in simple terms, the amplification and purification of a
DNA solution. The images and information shared in section 2.1.1 have been carefully extracted
from the following reference video:
http://www.youtube.com/watch?v=_YgXcJ4n-kQ&feature=g-hist
1 Helfer, Jeffrey, Diffinity Genomics Executive Summary, Diffinity Genomics reference material, 150 Lucius Gordon Drive, West
10
[image:18.612.257.410.321.441.2] [image:18.612.243.425.511.628.2]1) A double stranded DNA sample is prepared for analysis.
Figure 1: Examples of double stranded DNA images.
2) At room temperature, a specific portion of the DNA strand is identified to be amplified (duplicated). This portion of the DNA chain is known to be the target sequence.
Figure 2: DNA target sequence.
3) When the DNA sample is heated to 95ºC, the double stranded DNA sample separates into two single stranded DNA samples.
11
4) When the sample is cooled to 60ºC in a pool of specifically engineered primer and dimer solution, the single stranded DNA samples recombines with the “free” primers and dimers.
Figure 4: DNA Sample recombining at 60ºC.
5) The sample is then heated to a temperature (72ºC), a Taq polymerase reaction takes place, and the remaining single stranded DNA chain is reconstructed.
Figure 5: Taq polymerase reaction completed and DNA is reconstructed.
6) Once the Taq polymerase is completed, the process yields two exact replicates of the starting DNA sample.
12
7) When the stated thermo cycle is repeated, the DNA sample is perfectly duplicated. If a total 30 heat cycles are completed, a single stranded DNA sample yields approximately 1 billion perfectly duplicated double stranded DNA samples.
2.1.2 Step 2: DNA Purification: The science of cleaning up a “dirty” DNA solution
Once the DNA solution has been replicated to a specific concentration, the unwanted
“free” primers and dimer in solution need to be removed.
2.1.2.1 Conventional technology:
The most prevalent solution to this challenge involves the “bind, wash elute” process.
This process initially binds all DNA components (wanted and unwanted) to a specific surface.
This technology selectively removes the unwanted DNA components by leveraging unique
solubility properties of the DNA protein. Once the unwanted DNA components are removed
from the solution, one final step is completed whereby the double stranded DNA sample is eluted
from the surface of the binding material. This process involves the use of multiple liquid
handling pipette tips and sampling trays that are sold as kits and can take as long as 20-40
minutes.
2.1.2.2 Diffinity Genomics Rapidtip® technology:
This proprietary technology leverages the differential affinity of the DNA components
(wanted and unwanted). By design, the Rapidtip® material attracts the unwanted primers in the
DNA solution and repels the wanted double stranded DNA. This disruptive technology enables
the purification of a “dirty” DNA solution quickly and effectively. This process involves the use
13
(dirty) DNA solution. During this process, the DNA solution comes in contact with the
Rapidtip® proprietary particles enabling a dirty solution to be purified (cleaned) in 60 seconds.
The following section describes the Rapidtip® purification process:
1) A Rapidtip® functionalized tip is ready to be used.
Figure 7: Rapidtip® functional pipette tip.
2) Aspiration of DNA “dirty” solution and mixing of solution with Rapidtip® particles.
14
Figure 9: Dispensing of DNA solution.
4) Continued aspiration and dispensing of DNA solution for a total of 60 seconds.
Figure 10: Aspiration and dispensing of DNA solution with Rapidtip®.
5) Final dispensing of solution. After 60 seconds of product mixing, the DNA solution is comprised of the “wanted” double strand DNA, and the unwanted DNA impurities are bonded to the Diffinity Rapidtip® proprietary particles.
15
3
Diffinity Genomics’ Product Roadmap
Diffinity Genomics, a start-up company located in Rochester NY, currently develops and
manufactures functional pipette tips for use during DNA sample preparation. This process
transforms a simple pipette tip (typically used for fluid transfer) into a functional device that
performs and delivers unique value to the user. Using proprietary technology, Diffinity
Genomics’ functional pipette tips encapsulate proprietary active particles within the pipette tip
internal space. As users aspirate solutions into the pipette tip, the solution comes in contact with
these active particles, and during this mixing a chemical reaction takes places. After
approximately 60 seconds of fluidic particle mixing, the Diffinity Genomics’ functional pipette
tip dispenses a purified DNA solution ready for sequencing analysis.
Diffinity Genomics’ ability to manufacture unique proprietary particles enables the
company to produce functional pipette tips for unique DNA applications. The use of the
proprietary particles in distinct pipette designs enables Diffinity Genomics to manufacture
specific products for use in unique pipette configurations.
3.1
New Product Development
Product application: Diffinity Genomics’ core competency resides in the company’s
ability to formulate materials (particles) for unique product applications in the DNA world. For
each product application, a unique material formulation is functionalized into a pipette tip under
a unique product name. Diffinity Genomics has secured the rights to the “Rapidtip®” name;
hence the proposed product development strategy will incorporate the Rapidtip® name for each
16
new product applications under the Rapidtip®1, Rapidtip®2, Rapidtip®3, and so on, trademark
name.
Sample volume use: Diffinity Genomics’ proprietary material technology has the ability
to be scaled for a particular sample volume use; hence each product application will be qualified
for a specific sample volume use.
Product use: Each manufactured pipette tip is intended to interface to a particular
pipetor tip configuration. As a result, the current pipette tip market is segmented by specific
manufacturers that mutually exclude the use of their pipette tips on competitors’ pipetors.
Therefore, Diffinity Genomics’ functional pipette technology is manufactured for a specific
pipette tip design.
3.2 New Product Branding
The proposed product development roadmap provides the opportunity to redefine the way
the Rapidtip® product will look in the future. This initiative will be driven by Diffinity
Genomics’ VP of Marketing; however, the implementation of all these initiatives will be part of
the scope of this project.
3.3 Needed capabilities
The development and implementation of a shop floor control (software) tool will be
particularly important to the successful implementation of Diffinity Genomics’ product
expansion. The primary goal of this tool will be its ability to guide users through Diffinity
Genomic’s new product map ensuring that the finished product conforms to the new packaging
17
members to print final product information onto pre-printed master labels that incorporate new
18
4
Diffinity Genomics’ Product Expansion: To Diffinity and Beyond!
With the development of new proprietary particles, Diffinity Genomics’ future will
embrace the launch of multiple product applications in various pipette tip designs. The
following sections describe the company’s product launch (past and future).
4.1
Diffinity Genomics’ 2010 Initial Product Launch
Diffinity Genomics launched its first product in April 2010. This product intended to
address the nucleic acid extraction / purification needs of a 25ul DNA specimen intended to be
decoded in a Sanger Sequencing reader.
The table below summarizes the company’s initial product configuration:
(Direct Sales or Distribution Channels)
Product
Pipette
tip
Sample
volume
Sample pack 48 Tip Box 96 tip BoxRapidtip® Universal 25 ul For sale For sale For sale
Table 1: Packaging configurations available in 2010
In summary, the Rapidtip® product was initially offered for a 25ul solution in three
packaging configurations: 8 tip sample pack, 48 tip box, and 96 tip box. The following figures
19
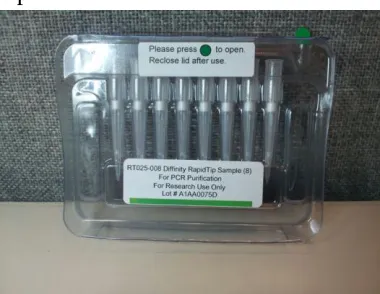
[image:27.612.211.401.83.230.2]1) Rapidtip® sample pack
Figure 12: Rapidtip® sample pack.
2) Rapidtip® 48 tip box
Figure 13: Rapidtip® 48 tip box.
3) Rapidtip® 96 tip box
20
4.2
Diffinity Genomics 2012: New products, new look!
Diffinity Genomics intends to launch a variety of new products. Some of these products
will be product extensions derived from the Rapidtip® product application, while other products
will be derived from new product applications.
4.2.1 Current Product expansion plan
The original Rapidtip® product was configured to interface with a “universal” handheld
pipetor unit. The universal pipetor is by far the manual unit most used across the world.
Although universal pipetor users are a large portion of the market, there are pockets of markets
that specifically use other pipetor handheld units. In the last four months, Rapidtip® pipette
technology has been successfully transferred to a variety of other unique pipette tip designs.
4.2.2 Rapidtip® in a Rainin Pipette Format.
Diffinity Genomics has recently announced the introduction of the Rapidtip® application
in a Rainin Tip format. This (current product) expansion has led to increased sales and the
development of Rainin-compatible products in the following packaging configurations: sample
pack, 48 tip box, and 96 tip box. However, the launch of this product configuration has
triggered increased interest from other pipette manufacturers.
The table below provides an outline of the packaging configurations currently available.
21
Packaging Configurations
Product
Pipette
tip
Sample
Volume
Sample pack 48 tip box 96 tip boxRapidtip®1
Universal 25 ul For Sale For Sale For Sale Rainin LTS 25 ul For Sale For Sale For Sale Tip #3 TBD ul Planned Planned Planned Tip #4 TBD ul Planned Planned Planned Tip #5 TBD ul Planned Planned Planned
Table 2: Diffinity Genomics Rapidtip®1 product growth roadmap
4.2.3 New product development “To Diffinity and Beyond!”
Diffinity Genomics has recently developed a new material platform that is able to address
the removal of the Polymerase agents in a PCR solution. This new product application,
Rapidtip®2, expands the use of Diffinity’s technology to a variety of new applications such as
restriction digest and T-A cloning while still maintaining a presence in the Sanger Sequencing
market. The Rapidtip®2 product is expected to be launched initially in the universal and Rainin
LTS pipette tip designs for a 50ul solution sample. An additional tip design is currently in
development that will address this application in a 10ul sample (tip #5). The table below
22
Packaging Configurations
Product
Pipette
tip
Sample
Volume
Sample pack 48 tip box 96 tip boxRapidtip®2
Universal 50 ul
Product will launch Q2-2012 Rainin LTS 50 ul
Tip #3 TBD Product will launch Q3-2013
Table 3: Diffinity Genomics’ Rapidtip®2 product growth roadmap
4.3
The NEW Diffinity Genomics
The planned product launches expected for the 2012 calendar year offer an opportunity to
implement a new branding look for the company. As a result, Diffinity Genomics’ VP of
Marketing and Sales has developed a new product labeling strategy including the adoption of a
new color scheme for the Rapidtip®2 product application.
The current labeling process at Diffinity Genomics involves the use of sheet label stock
and specific Word document templates. Unfortunately, this process will not meet the proposed
branding strategy, since the new labeling requirements will use pre-printed labels materials.
4.3.1 New Product - New Look
Diffinity Genomics’ product development roadmap will require the commercialization of
several product expansions in the Rapidtip® platform as well as the launch of several new
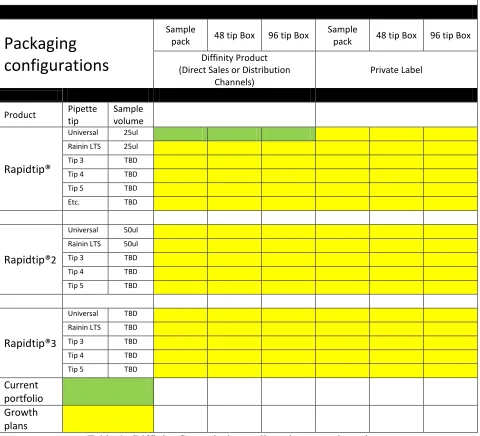
products in the Rapidtip®2 product platform. The table below better describes the product
23
Packaging
configurations
Sample
pack 48 tip Box 96 tip Box
Sample
pack 48 tip Box 96 tip Box
Diffinity Product (Direct Sales or Distribution
Channels)
Private Label
Product Pipette
tip
Sample volume
Rapidtip®
Universal 25ul
Rainin LTS 25ul
Tip 3 TBD
Tip 4 TBD
Tip 5 TBD
Etc. TBD
Rapidtip®2
Universal 50ul
Rainin LTS 50ul
Tip 3 TBD
Tip 4 TBD
Tip 5 TBD
Rapidtip®3
Universal TBD
Rainin LTS TBD
Tip 3 TBD
Tip 4 TBD
Tip 5 TBD
[image:31.612.68.548.81.517.2]Current portfolio Growth plans
Table 4: Diffinity Genomics’ overall product growth roadmap
The product configurations depicted in green represent the current product configurations
commercially available. The product configurations depicted in yellow represent the proposed
product expansion. Besides the obvious growth in the application (Rapidtip®1, Rapidtip®2,
24
the consideration for private labeling scenarios. The overall product expansion will increase the
product sku from 3 to somewhere between 24-48 sku in the year 2012.
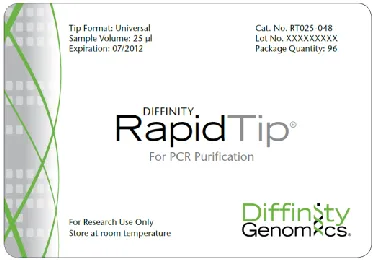
In addition, the product expansion will adopt a new product branding look. The images
[image:32.612.212.400.209.339.2]below provide a sample of the branding proposal:
Figure 15: Rapidtip®1 Branding proposal.
[image:32.612.209.404.394.529.2]25
Figure 17: Rapidtip®3 Branding proposal.
4.3.2 Proposed Packaging Configurations (tip box)
Diffinity Genomics’ packaging strategy was developed on a trial-by-use model. In
essence, customers try a Rapidtip® product via an 8 tip sample pack (typically at a competitive
price). Once customers obtain satisfactory results, they either order the product in 48 or 96 tip
box quantities.
The product expansion will not change the current product configuration (tip quantity);
however, for each of the product applications (Rapidtip®1, Rapidtip®2, etc.), a unique tip box
had to be procured to embrace the proposed branding color scheme.
The scope of this project included coordination and development of the various tip boxes
as follows:
Application
Rapidtip®1 Rapidtip®2
Tip format
Universal Currently available New
Rainin New New
26
The images below provide examples of the current Rapidtip®1 tip box and the final
Rapidtip®2 tip box configurations. For each application, two box types are shown since the
Universal and Rainin tips have unique part geometry it became impossible to identify a particular
box for both tips.
Figure 18: Rapidtip®3 Branding proposal.
27
4.3.3 Proposed Packaging Configurations (Labeling)
Diffinity Genomics’ initial product labeling involved the use of pre-cut feedstock readily
available through Avery Dennison Corp. The printing process involved the use of Word
templates in which the variable printing information (lot number, expiration date, etc.) was typed
as needed. The printing process involved the use of sheet stock manually fed through a laser jet
or ink jet printer.
The new branding strategy required the use of a label size that was not commercially
available in sheet stock. As a result, a new label size (3” x 4”) was identified for the proposed
packaging scheme. This new label format would be manufactured in a roll form; however,
Diffinity Genomics did not have the capability to print labels in a roll format.
4.3.4 In search of a new label printer
It became quite evident that the identification and procurement of a new printer with a
label roll feeding capability would be key to the implementation of Diffinity Genomics’ new
branding plans. An initial search for such printer led to the identification of several elegant
solutions. These solutions involved the purchase of a very capable printer with related custom-
tailored software to meet the company’s needs. These solutions, however, became quickly cost
prohibitive and thus a much more cost effective solution needed to be identified.
Interestingly enough, the painful journey to identify a printer solution highlighted the
need for a much more holistic approach to solving the label printing process. In simple terms,
printing the label would become the easy portion of the project, and the biggest challenge would
28
4.3.5 Oh my… so much data, so little time!
Diffinity Genomics’ product expansion would require the careful management and
tracking of critical product attributes through its manufacturing process. The final product-
labeling exercise would become a critical outcome of the manufacturing process (and not the
beginning as originally envisioned). Nowhere in my packaging engineering classroom teachings
did we discuss (or learn) the use of software tools that could handle the management and
traceability of critical product properties that would eventually be summarized in a simple label.
5
And Then There was Light…
The use of database software always interested the author of this project. On many
occasions, useful applications were defined and written to handle multiple data applications. For
example, during the holiday season I found it interesting that I could address 50-100 envelopes
for our holiday Christmas cards utilizing password management. I wrote a password-protected
routine to handle (and remember) passwords for the critical access of information and websites
on the Internet.
So I asked myself if it would be possible to home grow a software to help me address
Diffinity Genomics’ product explosion, new branding requirements, and related finish-product
labeling. The answer to this question resides in the body of this research project.
So the journey to a (cost effective) manufacturing shop floor control software began with
29
5.1
The Evolution of Database Systems
“Database management systems were first introduced during the 1960s and have
continued to evolve during subsequent decades.
In early 1960, database structure was comprised of traditional flat files. Much of this
effort was driven by the Apollo moon landing project. During this period initial standardization
was initiated by a Data Base Task Group.
In the 1970s, database management became a commercial reality. Hierarchical and
network database management systems were developed largely to cope with increasingly
complex data structures such as manufacturing bills of materials. During this decade the
relational model was first defined by E. F. Codd, an IBM research fellow, in a paper published in
1970.
In the 1980s, computing power allowed code writers to develop the Structured Query
Language (SQL), a valuable tool which enabled the use of fast and efficient data retrieval.
In the 1990s, the appearance of first generation client / server computing and the Internet
drove database structures to increasingly more important roles. To cope with increasingly
complex data (including graphics, sound, images, and video), object-oriented database structure
was developed and refined, and by the year 2000, artificial intelligence became a reality.”2
5.2
A basic review of database theory
A database, in its simplest form, is an “organized collection of logically related data. It is
important to note that raw data on its own cannot be considered a database; however organized
data (i.e., information) is most commonly associated with a database because it leads a user to
2 McFadden, Fred, Hoffer, Jeffrey, Prescott, Mary (1999), Modern Database Management, Massachusetts, Addison-Wesley (pp.
30
increased knowledge.”3 Central to a database is the connection or, better stated, the relationship
between the data.
In a database, a set of data is grouped in a TABLE. Thus a table is a repository of data in
a form of records. The figure below describes the dataset in two unique tables, Table (Husband)
and Table (Wife). For each table there are six unique records.
Record Table (Husband) Record Table (Wife) 1 Jeff 1 Sandy 2 John 2 Marry 3 Jack 3 Beth 4 Rob 4 Sarah 5 Michael 5 Ann 6 Charlie 6 Julie
Table 6: Example of two sets of tables
5.3
The Relationship between the dataset
Records in one table can be related to records in a second table via a common connection:
The Relationship. The relationship between data can be divided into two different groups,
one-to-one relationship and one-to-many relationships.
5.4
The “One-to-One” Relationship
In its simplest form, records in one table can be related to records in a second table in a
“one-to-one” relationship. Using the example below, a set of data in the “Husband” table is
related to a set of data in the “Wife” table as follows:
31
Record
Table
(Husband) Record
Table (Wife) 1 Jeff
is married to
1 Sandy 2 John 2 Marry 3 Jack 3 Beth
4 Rob 4 Sarah
5 Michael 5 Ann 6 Charlie 6 Julie
Table 7: Development of a relationship between two tables
The example above represents a scenario in which two sets of tables are related in a way
that one record in the “Husband” table is related in one way to a record in the “Wife” table.
5.5
The “one-to-many” relationship
This particular relationship can be summarized using two tables; however, in this
particular relationship, the primary table is related to multiple records in the secondary table. For
example, take a dataset comprised of TABLE (Students) and a TABLE (Classes) as follows:
Record Table (Students) Record
Table (Class) 1 Beth 1 Math 2 John 2 English 3 Sarah 3 Music 4 Ann 4 Science 5 Michael 5 Art 6 Charlie 6 Chemistry
32
In this example, each student will be attending a set of classes each day as follows:
Student Attending
Beth Math, Science, Chemistry John Art, Music, English Sarah Math, Chemistry Ann Music, English, Math Michael Science, Art, Music Charlie English
Table 9: List of students’ class attendance
The following diagram provides a description of the relationship between the TABLE
(Student) and the TABLE (Class). For each student record, there exists a unique set of arrows
pointing to specific records in the second table. (For the sake of clarity, the one-to-many
[image:40.612.213.400.98.209.2]relationship is only included for students Beth, John and Sara.)
Table 10: Depiction of related fields between Table (Students) and Table (Class)
In general, database structure relates a record in one table to a record (or records) in a
second table through a specific relationship. This process, the actual connection of records, takes
place using a very specific structure. The table below summarizes the general structure reviewed
33
Name Description
Table A repository of information
Record A set of data within a table
Table 11: Definition of terms
5.6
Database Design
The development of a database requires the management of three database structures: (1)
tables, (2) fields, and (3) relationships. FileMaker Pro, a relational database software, provides a
user friendly “front end” to define the said structures.
5.6.1 Database tables
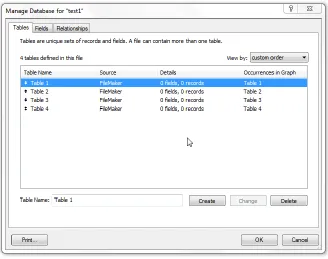
The development of tables in FileMaker Pro is a straightforward process. The image
below provides a screen capture of the database management front end used to establish database
34
Figure 20: Database table list.
This example established four unique tables (table 1, table 2, table 3, and table 4). The
process involved the establishment of a unique name. In this environment, table names can be
changed, added, or deleted in a simple manner.
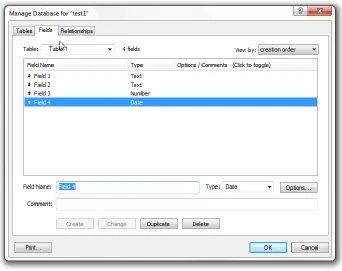
5.6.2 Database fields
For each specific table, a set of specific placeholders (i.e., fields) can be created to house
specific data. The image below provides an example of FileMaker Pro’s field front end. In this
particular example, table 1 has 4 unique fields: field 1 (text), field 2 (text), field 3 (number), field
35
Figure 21: Database field list.
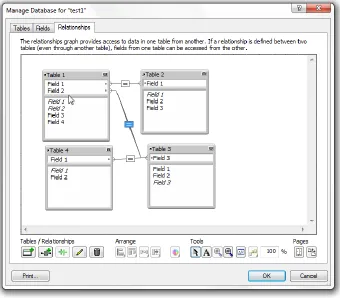
5.6.3 Database relationship
In FileMaker Pro, the relationship front end enables the user to have full visibility to all
tables (including their fields). By graphical manipulation, database relationships can be created
between fields. The example below contains the following relationships:
36
Figure 22: Database relationship map.
5.6.4 FileMaker Pro: The simple solution
FileMaker Pro, a Macintosh-based software, provides a database development tool that is
intuitive, friendly, and easy to learn. Given these benefits, the author of this project has selected
FileMaker Pro as the software of choice in the development of Diffinity Genomics' solution to
address the new product development expansion as well as the introduction of a new branding
37
6
The Solution
The previous sections of this report have elaborated on details related to Diffinity
Genomics’ rapid product expansion and new marketing initiatives. As stated in section 1.2.3,
the development and implementation of a shop floor control (software) tool will be particularly
important to the successful implementation of Diffinity Genomics’ product expansion. The
primary goal of this tool will be its ability to guide users through Diffinity Genomics’ new
product map ensuring that the finished product conforms to the new packaging and marketing
schemes. The proposed shop floor control tool will enable Diffinity Genomics’ members to
print final product information onto pre-printed labels that incorporate the new branding
appearance. So… what does this solution look like?
Before a formal solution can be proposed, it may be necessary to define some additional
requirements that address the interface and role of the proposed shop floor control tool. We will
start defining these requirements by initially defining Diffinity Genomics’ workflow through a
process flow diagram. Once this diagram is defined, each process flow step will be further
detailed and specific input and output requirements will be defined (for each step).
The information developed through the process flow diagram also will drive specific
requirements related to database tables, fields, and relationships. These requirements eventually
will lead to a software workflow environment coded in the FileMaker Pro software database.
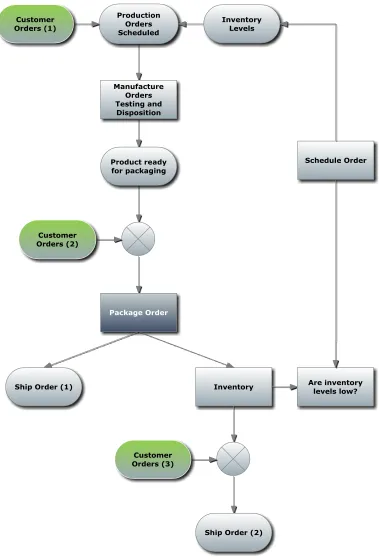
6.1
Diffinity Genomics product workflow
Diffinity Genomics product workflow is described in the figure below. In order to
understand the rationale behind this process flow, it may be important to understand the
38
39
6.1.1 Diffinity Genomics’ Customers
Over the past six months, Diffinity Genomics’ customer base initially followed a direct
sales model approach. Customers visited the company’s website and placed orders directly
through a sales portal. As the product grew in popularity, Diffinity Genomics’ ability to secure
national distributors became possible. Soon the company expanded its distribution capabilities
to international markets. Most recently, Diffinity Genomics secured a global distribution
agreement with a large “laboratory supply catalog” company, and the birth of Diffinity’s private
labeling offering was established.
All in all, Diffinity Genomics strives to fulfill customer orders as quickly as possible. In
order to do so, Diffinity’s process flow incorporates the input of customer orders in three
different locations.
Customer Order #1: These orders are typically high volume orders. Given the relatively
large size, the company’s strategy is to fulfill these orders in a make-to-order modality. Most of
these orders are typically private label orders.
Customer Order #2: These orders are typically large-to-medium volume; however, these
orders are not private label orders placed by smaller distributors.
Customer Order #3: These orders are typically medium-to-small orders placed by
national distributors or direct sales through Diffinity’s point-of-sale website portal.
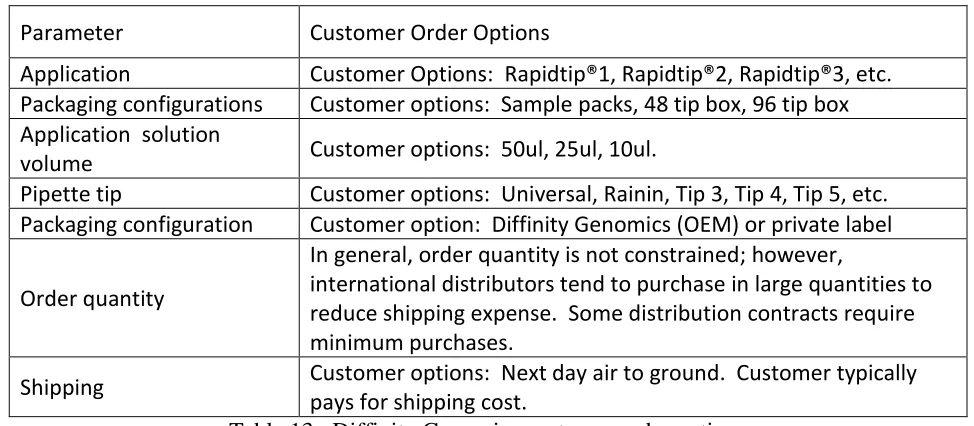
6.1.2 Diffinity Genomics Orders Options
Diffinity Genomics customers can place product orders through a multitude of options.
40
Parameter Customer Order Options
Application Customer Options: Rapidtip®1, Rapidtip®2, Rapidtip®3, etc. Packaging configurations Customer options: Sample packs, 48 tip box, 96 tip box Application solution
volume Customer options: 50ul, 25ul, 10ul.
Pipette tip Customer options: Universal, Rainin, Tip 3, Tip 4, Tip 5, etc. Packaging configuration Customer option: Diffinity Genomics (OEM) or private label
Order quantity
In general, order quantity is not constrained; however,
international distributors tend to purchase in large quantities to reduce shipping expense. Some distribution contracts require minimum purchases.
[image:48.612.62.549.97.310.2]Shipping Customer options: Next day air to ground. Customer typically pays for shipping cost.
Table 13: Diffinity Genomics customer order options
6.1.3 Diffinity Genomics Manufacturing: Testing and Disposition
Diffinity Genomics’ rapid growth has driven the manufacturing capacity to its limits.
The need for additional capacity is evident; however, the delivery of additional equipment cannot
come soon enough. In the meantime, the company leverages overtime opportunities to address
these capacity constraints.
Customer orders are reviewed on a daily basis. Each customer order drives a production
order to be scheduled accordingly. Careful consideration is taken to maximize the combination
of orders to reduce the number of product changeovers. The final output from this process is a
weekly production plan. This plan roughly defines the number of lots to be produced on a daily
basis.
For each lot scheduled, a specific recipe is followed to ensure the raw materials selected
41
manufactured is fully accountable (tip count per lot). The table below provides a summary of the
tip count form that needs to be filled out for each product lot:
Item Term Definition
1 Number of tips Total number of tips manufactured for the specific lot 2 Number of retains Total number of tips saved for product retains
3 Waste Total number of tips lost due to mishandling 4 Testing samples Total number of tips consumed for testing purpose 5 Unaccounted tips Total number of tips that cannot be accounted for
anywhere else 6 Tips ready for
packaging
Item #1 minus items (2, 3, 4, 5)
Table 14: Lot accountability sheet
Manufactured product must meet the highest quality levels possible. Diffinity Genomics
follows a strict quality system that requires production lots to be fully tested prior to shipment.
Careful consideration must be taken when considering customer order fulfillment given the
potential for product retest or product lot failures. Although these events are atypical, the
probability for these occurrences is never zero. As a result, item #4 in the lot accountability
sheet provides an opportunity to account for all product used for testing purposes.
When production lots meet product specifications, these lots are considered acceptable
product (for sale product). Lots released are placed in a work-in-progress inventory called
“Ready for Packaging.”
6.1.4 The fine art of packaging product at Diffinity Genomics
Each “ready-for-packaging” lot contains a specific number of tips. Although the final tip
count per lot was originally predicted by the original production order, the reality is that the final
tip count is typically less than the scheduled order since in most cases product is lost due to
42
Diffinity Genomics’ tips are sold in sample packs of 8 tips and tip boxes of 48 and 96.
Therefore, a delicate but critical process takes places each time a lot is packaged to minimize the
number of tips that are “excess “after packaging. The table below provides several packaging
scenarios for a tip lot with a quantity of 831:
Tips ready for packaging
831 831 831
8 packs 103 1 1
48 tip box 0 17 1
96 tip box 0 0 8
Tips left over 7 7 7
Table 15: Example of various ways to package 831 tips
Based on a lot size of 831, the lot could be packaged as:
a) 103- 8 pack with 7 tips left over b) 17- 48 tip boxes with 7 tips left over
c) 8 -96 tip boxes, 1-48 tip box and 7 tips left over.
The three scenarios above provide interesting outcomes depending on the packaging
configuration for the lot. To make matters more interesting, the sample retained quantity can
sometimes come into play to maximize the tip packaging efficiency. In other words, for all three
scenarios shown, if one tip is removed from the retained pool (and added to the ready-to-package
count), the leftover tip count would be eight tips, and this number would yield another sample
pack. This type of tip manipulation takes place for every lot produced. This process is
sometimes called lot reconciliation.
The likelihood of a lot yielding 100% of the intended tip quantity is low; therefore, the
production order quantity is typically scheduled on the “heavy side.” This conservative approach
43
product yield for a particular lot is unusually good, then excess product has been manufactured
and the remaining package product ends up in the finished product inventory.
The previous example described the scenario in which a production order leads to various
packaging scenarios. In reality, each production order, generally speaking, is manufactured with
the intention of being packaged in a particular packaging option: 8 pack, 48 tip, or 96 tip boxes.
Most customer orders, however, are placed in a way that several packaging options are included
in the order. For example, a customer may order 50 sample packs, 24-48 tip boxes, and 12-96 tip
boxes in one order. Therefore, careful consideration must be taken to ensure that the weekly
production orders consider multiple customer orders all together.
6.1.5 Diffinity Genomics’ subsequent packaging options (secondary)
Given the current customer consumption trends, Diffinity Genomics has adopted a unique
secondary packaging strategy as follows: Each tip count box (48 tip or 96 tip) will be packaged
individually in a corrugated container. This scenario provides a strong message to our
customers: each tip box is packaged individually because its contents are of high value. In the
future, Diffinity should consider secondary packaging scenarios of 6, 12 and 24 tip boxes (48
tips or 96 tips). These options will become more palatable as customer order size increases.
The current secondary packaging scheme for sample packs is typically in quantities of 1
(new customer trial) or multiples of 50 (in support of large distributor campaigns).
6.1.6 Diffinity Genomics Tertiary packaging and shipping
Given the 48 and 96 tip corrugated container, Diffinity Genomics has purchase standard
corrugated containers to ship 12, 24, 36, and 48 tip boxes in a shipper. Fortunately, the
44
in increments of six inches in all three major axes (L x W x H). As stated previously, product
shipping is paid by the customer (most of the time). Diffinity Genomics has accounts with all
major shipping companies worldwide.
6.1.7 Summary: Diffinity Genomics’ workflow
Section 5.1 of this report has provided a detailed overview of Diffinity Genomics current
workflow. This information will provide a foundation for the development of the proposed shop
floor control software module. The next section of the report will elaborate on the details of the
shop floor control software solution.
6.2
The Solution: Diffinity Genomics’ Shop Flow Control Database
The following section will describe in great detail the functionality of the proposed shop
flow control database using the FileMaker Pro database software. The database functionality
will be presented in the same manner as a real user would interface with the database while
processing a production. Once this user interface review is completed, the database functionality
will be reviewed from a technical perspective, highlighting the actual tables, fields, and database
relationships used to compile the data.
6.3
Database Front End: Main Menu
When the database is initially started, the user software opens the user interface to the
main navigational page (Main Menu). The figure below provides a screen capture of the main
45
Figure 23: Program Main menu.
The main menu page contains four navigation buttons. Each button navigates the user to
the corresponding page as noted on the button.
As noted in the process flow diagram in section 5.1, Diffinity Genomics’ manufacturing
process starts with the production order scheduling process driven by customer orders. Each
week this schedule is planned and posted. Based on this information, each morning the
manufacturing team is expected to produce a specific product lot.
This process starts with the creation of a manufacturing lot. The table below provides a
summary of the lot properties and the corresponding product options available. Note that the
menu options available include the proposed product configurations (product expansion)
46
Lot Property Options
Product application Rapidtip®1 Rapidtip®2 Rapidtip®3 Product generation Gen 2
Gen 3
Tip type Universal
Rainin Tip 3 Tip 4 Tip 5
Sample volume 10ul
25ul 50ul
Diffinity proprietary lot WJB1-153-2 WJB1-153-3 WJB1-153-4 Lot number of the day 1
2 3 4
Table 16: Lot property field options
When the user selects the lot creation button, the database takes the user to the lot
creation screen. This screen is divided into two sections.
The top section provides the user with the necessary options to create a new lot. The
creation of a new lot is complete by choosing a selectable option from each field’s pull- down
47
Figure 24: Lot creation screen capture.
For each field, a pull-down menu provides guidance (to the user) for the options available
in each field. The screen below provides a screen shot of the pull-down menu for the application
field:
48
Once the user selects the appropriate options for each of the required fields, a unique lot
number is recorded (stamped) in the database.
6.3.1 Lot number nomenclature
The assignment of a lot number (based on the selectable menu options in the database)
requires significant effort. The final outcome for the lot number is a five-digit, alphanumeric
descriptor (XXXXX), followed by a (second) five-digit, alphanumeric descriptor (YYYYY). In
between the descriptors, a dash was inserted to help user readability. Therefore, Diffinity
Genomics new lot number assignment will have the following format:
X1 X2 X3 X4 X5 - Y1 Y2 Y3 Y4 Y5
The assignment of the lot number in the database is best described when referring to the
49
Lot digit Lot property Options Lot digit reference X1 Product application Rapidtip®1
Rapidtip®2 Rapidtip®3
A B C X2 Product generation Gen 2
Gen 3
2 3
X3 Tip type Universal
Rainin Tip 3 Tip 4 Tip 5 U L TBD TBD TBD X4 X5 Sample volume 10ul
25ul 50ul 10 25 50 Dash
Y1 Y2 Y3 Julian day
Y4 Year 2009
2010 2011 2012 A B C D Y5 Lot number of the day First
Second Third etc. 1 2 3
Table 17: Lot number nomanclature
Based on the table above, a lot number defined as A2U25-133D1 would be decoded as:
Lot digit Lot property Options Lot digit reference X1 Product application Rapidtip®1 A
X2 Product generation Gen 2 2
X3 Tip type Universal U
X4 X5 Sample volume 25ul 25
Dash
Y1 Y2 Y3 Julian day = May 12 (133 day of the year)
Y4 Year 2012 D
50
6.3.2 Lot menu management
Within the lot creation screen, there exists a lower section defined as the lot menu
management. The image below contains a screen caption of this section:
Figure 26: Lot Menu Management screen capture.
The lot menu management section provides the database user the opportunity to define
additional lot options for the pull-down menus. For example, if a new product application was
developed (Rapidtip®3, for example), the user would select the “Add Application” button and
the database would navigate to the following layout:
51
6.4
Production lot management
Once a new production lot is defined, the production team manufactures the intended
product by appropriately selecting the related raw materials. The end product of this process is
the manufacture of Diffinity Genomics’ pipette tips. Once the lot has been completed, the
operator needs to input the product manufactured into the system. To do so, the operator would
navigate through the main database page (Diffinity Genomics’ Main Menu) and select the Lot
Management button.
Figure 28: Main menu highlighting the Lot Creation button.
Once the lot management button is selected, the database navigates to the lot
52
Figure 29: Lot Management screen caption.
Once the user lands at the Lot Management screen, he or she would input the following
information:
Lot Management Field Definition
Number of tips Input: Total number of tips manufactured Number of retains Input: Total number of tips kept for product
retains samples
Waste Input: Total number of tips wasted / lost / damaged
Testing samples This is a calculated field and will be addressed in the following report section Unaccounted tips Input: This field was defined to enable user
to manipulate the final count if the actual
product count does not match the field “Tips
for packaging”
Tips for packaging This is a calculated field (no user input required): Tips for packaging = Number of tips minus (number of retains, waste, testing samples and unaccounted tips).
This is the number of tips that will be packaged as saleable product.
[image:60.612.161.539.378.653.2]53
6.5
Production lot testing
Once it has been accounted for, the production lot must be tested to ensure it meets
minimal product performance specifications. Unfortunately, this process also consumes product
tips, thus affecting the final lot count. In order to account for tested product losses, the database
provides (within the main menu), a menu selection to record the lot testing tip consumption. The
user would select the Lot Testing button from the main menu as follows:
Figure 30: Main menu highlighting the Lot Testing button.
Once the lot testing button is selected, the database will navigate to the lot testing screen
54
Figure 31: Lot Testing screen.
The user would select the required test for the product (i.e., T1, T2……T6) and select the
“Add Test” button. If, for example, for lot A2U25-133D1 testing was completed for T1-T5 (a
total of five tests) and, assuming a sampling plan n=3, a total of 15 tips would be used to
complete the test.
It is important to note that once the testing samples are allocated for the specific lot, the
lot management screen accounts for the tips used. The screen below shows how the 15 tips for
lot A2U25-133D1 were accounted for under the testing sample field:
55
6.6
Production lot testing outcome
Once the testing samples are submitted for testing, test results are generated for each tip.
The tip test results are captured in the Lot Test Results screen. A typical example of this layout
[image:63.612.157.493.264.608.2]is described in the screen capture below:
Figure 33: Screen Capture of Lot Test Results.
For each tested tip, a line item is provided. The test result is incorporated in the result
56
data is inputted, the user would make a decision to pass or fail the lot by pressing the appropriate
button.
6.7
Primary packaging product
Once a manufacturing lot has passed the required internal quality guidelines, the lot can
be fully packaged. The key to this process is the generation (printing) of product labels. The
diagram below provides the logic (decision process) needed to arrive at the proper finish product
label configuration. It is important to note that at this point of the process, the product has been
manufactured and, therefore, inherent product properties such as product application, application
volume, and tip type have been already established when the raw materials were selected to
[image:64.612.242.462.378.626.2]manufacture the lot.
57
For each manufactured lot, a decision on the packaging scheme must be made. This
[image:65.612.162.491.131.464.2]proposed database tool provides a method to complete this process in a simple manner.
Figure 35: Ready to be packaged, example 1.
Lot A2U25-133D1 contains a total of 1956 tips ready to be packaged. The information
included in the layout suggests to the user that with 1956 available tips, one can package 244
sample pack units,40 boxes of 48 tip boxes, or 20 boxes of 96 tips. Also, this process suggests
that the use has a multitude of options to package the lot. The key to the decision process is the
fact that this order was originally scheduled through the production order schedule. Therefore,
58
The final packaging scheme, however, can be changed during this decision process. As a
result, a multitude combination of packaging schemes can be constructed based on the database
logic built into the layout.
Take, for instance, a scenario in which 10 sample packs and 10-48 tip boxes are
desperately needed in an OEM product. If this was the case, the user would input this
information on the layout. The screen capture below provides an example of such inputted
[image:66.612.163.489.265.597.2]information:
Figure 36: Ready to be packaged,. example 2
The result of this input indicates that there are 1396 tips left over (still available to be
59
options. To further illustrate the capabilities of the database, let us suggest that for this lot, we
will package an additional 72 single packs, 5-48 tip boxes, and 6-96 tip boxes, all items for
[image:67.612.165.484.157.491.2]private label (Sigma Aldrich). The screen capture below provides the example suggested:
Figure 37: Ready to be packaged, example 2 (box example).
The suggested packaging scheme res