City, University of London Institutional Repository
Citation:
Ali, R., Dykes, J. and Wood, J. (2013). Framework for Studying Spatially Ordered Treemaps. Paper presented at the 26th International Cartographic Conference: From Pole to Pole, 25 - 30 August 2013, Dresden, Germany.This is the unspecified version of the paper.
This version of the publication may differ from the final published
version.
Permanent repository link:
http://openaccess.city.ac.uk/2609/Link to published version:
Copyright and reuse: City Research Online aims to make research
outputs of City, University of London available to a wider audience.
Copyright and Moral Rights remain with the author(s) and/or copyright
holders. URLs from City Research Online may be freely distributed and
linked to.
City Research Online: http://openaccess.city.ac.uk/ [email protected]
Framework for studying Spatially Ordered
Treemaps
Ali Ramathan, Jason Dykes, Jo Wood
giCentre, School of Informatics, City University London, EC1V 0HB.
Abstract. We propose a comprehensive research framework to empirically
investigate complex visual inference tasks, support mechanisms (animated transition using morphing or vector overlay), and how spatial ability affects people’s learning and knowledge construction process from Spatially Or-dered Treemaps (SOTs) as compared to conventional choropleth maps. This effort is inspired by the call of the new International Cartographic As-sociation commission on Cognitive Visualization (CogVis), which proposes
“developing a sound theoretical framework based upon cognition and per-ception discipline” (Fabrikant, 2011). The framework aims to explore SOTs in the context of both ‘in-vitro’ and ‘in-vivo’ settings. This study is grounded in cartography but also conforms to experimental design standards in per-ception and cognitive sciences.
Keywords: Spatially Ordered Treemaps, Geovisualization, Visual Tasks,
Spatial Ability
1. Introduction
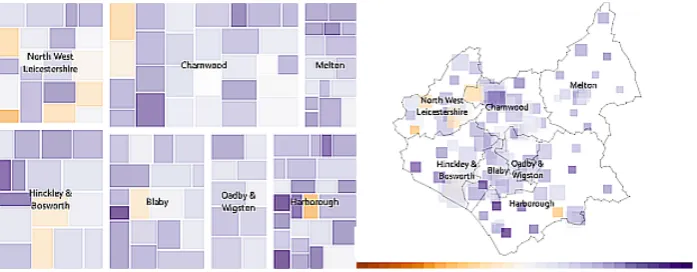
geo-graphical area), SOTs can be sized according to need – for example by po-pulation (number of people living in an area) to result in a space filling hie-rarchical cartogram (Wood & Dykes, 2008a; 2008b). Although, SOTs have been used in various applications e.g. in local government (Figure 1) to ma-nage and allocate resources (LCC, 2010), we lack empirical evidence on how effective the technique is in communicating spatio-temporal data either for educational purposes or for knowledge discovery.
1.1. Theory
Treemaps are space-filling graphics that show hierarchical data in a space efficient way using one rectangle per data item in an iterative manner through the hierarchy (Shneiderman, 1992). Most treemap layout algo-rithms use one-dimensional ordering of rectangles. With SOTs, two-dimensional ordering is used and rectangles corresponding to geographical areas are arranged in an approximate spatial layout to produce “a space filling cartogram” (Wood & Dykes, 2008a; 2008b) that distorts spatial geometry to reflect thematic information. A cartogram is a map that distorts spatial geometry to correspond to a theme (Tobler, 2004). In light of these spatial distortions, support mechanisms such as morphing, overlay vectors and colour have been designed in SOTs to aid the user in understanding the topology after transformation (Wood & Dykes, 2008b).
[image:3.595.114.463.480.616.2]Research efforts on treemaps can be broadly divided into two: development of effective treemap algorithms and evaluation of use of the outputs (Kong et al., 2010). But none of these efforts deal with the kinds of complex spatial tasks for which maps are so effective (MacEachren, 1995).
Figure 1. A SOT (left) and a conventional geographical map (right) of
2. Research Framework
Our framework aims to formally evaluate the effectiveness of treemaps in the geographic context for the first time. Our aim is to increase our under-standing of graphical perception with regards to SOTs. This will in turn inform us on the strengths and limitations of SOTs for communicating and exploring geographic information. Table 1 gives an overview and charac-teristics of the study at different stages. The specific tasks for stages Ia, Ib & Ic are further elaborated in Tables 2, 3 & 4. The tasks for stage II are dis-cussed in section 3.
Context ‘in-vitro’ ‘in-vivo’
Stages Stage Ia Stage Ib Stage Ic Stage II
Tasks Locate Compare Distribution Distribution,
Interaction
Data collection Online Questionnaires Questionnaires, Interview & Observation
Data type Quantitative Qualitative
Participants’ characteristics
Our target population are numerate information seekers with experience of using data and graphics
Experts
Sample size Many Few
Study design Between- subject Case study
Table 1.An overview of the proposed study
2.1. Stage I: Identifying suitable tasks for SOT
Under the ‘in-vitro’ setting, the key question under consideration is: “to what extent are people able to interpret data and geography in a SOT as they would in choropleth maps”. This will be evaluated through spatial graphical perception tasks that require regional comparison and the inter-pretation of general spatial distributions. Our independent experimental factors are map type and task.
2.1.1. Map type
enumerati-on units and spatial characteristics of the mapped distributienumerati-on will be vari-ed systematically. Spatial characteristics of the distribution (data) will be varied according to established spatial statistics.
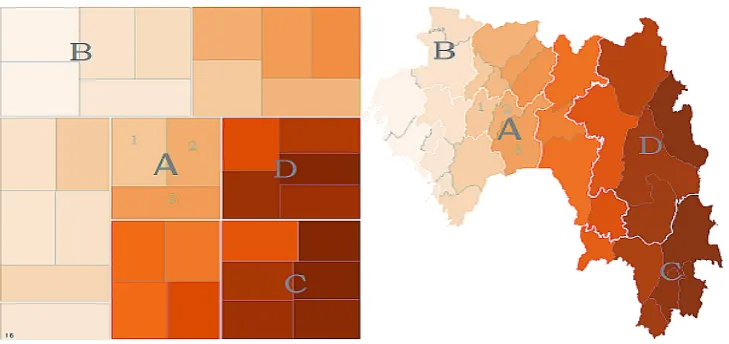
Figure 2. A SOT and equivalent Choropleth map showing the geographic
hierarchy: the whole area, regions (A,B,C,D) and districts (1,2,3) .
2.1.2. Tasks
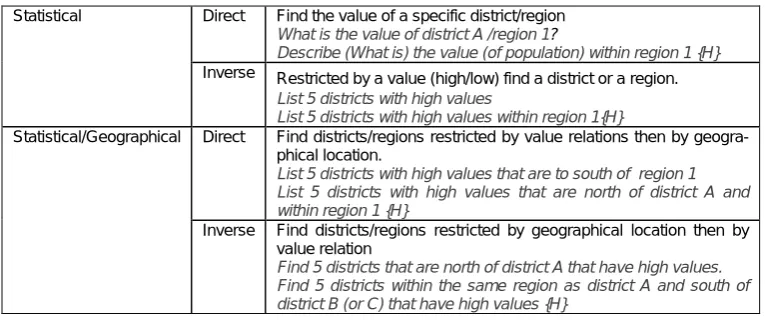
[image:5.595.114.479.184.356.2]Statistical Direct Find the value of a specific district/region
What is the value of district A /region 1?
Describe (What is) the value (of population) within region 1 {H}
Inverse Restricted by a value (high/low) find a district or a region.
List 5 districts with high values
List 5 districts with high values within region 1{H}
Statistical/Geographical Direct Find districts/regions restricted by value relations then by geogra-phical location.
List 5 districts with high values that are to south of region 1 List 5 districts with high values that are north of district A and within region 1 {H}
Inverse Find districts/regions restricted by geographical location then by value relation
[image:6.595.107.490.139.299.2]Find 5 districts that are north of district A that have high values. Find 5 districts within the same region as district A and south of district B (or C) that have high values {H}
Table 2. Locate tasks: requiring value estimation for individual spatial units or
regions.
Statistical Direct Find and compare value of a specific district with others.
Between districts A, B, C & D, which one has the lowest value Between regions 1, 2, 3 & 4, which one has the highest value? {H}
Inverse Restricted by value (high to low) districts should be ordered in this sequence.
From high to low, arrange districts A, B, C & D in order of overall population
From high to low, arrange regions 1,2,3 & 4 in order of overall population {H}
Geographical Direct Judge distance and find the location between districts/regions
Between districts A, B and C, which district is closer to district D? Between districts A, B and C, which district is [either within region 1 | within the same region as district D | within a different region to district D]?{H}
Inverse A district is restricted by location, then judging by distance to a specific district/region
Between districts A, B, C & D, which district is closest to both regions 1 and 2?
Between districts A, B, C & D, which district are in the same region as district 1 and 2?{H}
Statistical/Geographical Direct Find districts restricted by value relations then by geographical locations.
Are the districts with high values closer to A or B?
Are the districts with higher values within region 1 or 2?{H} or
In which direction are the districts with high values from A?
Are the districts with high values within the same region as district 1 or 2? {H}
Inverse Find districts restricted by geographical location then by value relations
Are more districts with values like C closer to A or B?
Are more districts with higher values than C within region A or B?{H}
Table 3. Comparison tasks: requiring geographical (distance) or value
Flat : Identify similarity between maps (SOTs or Choropleth) by looking at spatial distribution.
For example, participants are presented with a SOT, next to it there are 5 choropleths.
Which map looks most similar to the one presented?
Table 4. Distribution tasks: requiring overall area assessment of the map.
3. Stage II: Identifying support mechanisms and
met-aphors for supporting data exploration when using
SOTs.
The ‘in-vivo’ setting in which we will be working involves epidemiologists who use maps frequently. The key question under consideration is: “to what extent are support mechanisms useful during data exploration and interpretation of general spatial distributions?” Cartograms have been found to be difficult to interpret without some kind of support (Tobler, 2004). Similarly, since SOTs distort locations and result in new layouts that are sensitive to aspect ratio, somewhat arbitrary and non-linear in their transformation of space. We intend to evaluate how various support me-chanisms may help establish their geography. Firstly, we are considering animated transitions (e.g. morphing) for comparing one layout to another so that geographic and SOT locations can be compared (Heer & Robertson, 2007). This is because there is some evidence animated transition aids in understanding statistical graphics. Secondly we are considering linked views with displacement vectors (Wood & Dykes, 2008b) that visually indi-cate the topologic distortion: the length of the vector indiindi-cates distance whi-le curvature indicates the direction of distortion from the ewhi-lement’s original location.
4. Investigating the effects of spatial ability on tasks
visualiza-tion tasks and can be used to identify individual differences (Hegarty & Waller, 2006). Identifying individual differences is key because once a group is known, tools or educational training can be customized towards their needs (Slocum et al., 2001). However, very few studies in cartography and geovisualization have studied individual spatial ability differences (Wilkening & Fabrikant, 2011). Two forms of spatial ability test, paper fol-ding and mental rotation will investigate how subjects’ task performance (with respect to SOTs) is modulated by their spatial ability to give us in-sights into why and for whom this spatial transformation may be effective (Fabrikant, 2011).
5. Work plan
In the coming months we intend to run several experiments using the tasks identified in section 2.1.2. The target sample is numerate information see-kers with experience of using data and graphics who are also potential users of SOTs. We are currently recruiting participants having received ethical approval to undertake the tests from our institution.
6. Conclusion
We propose a research framework for empirically assessing the effectiven-ess of SOTs for communicating and exploring geographic information through relative complex tasks involving geography, statistics and hie-rarchy. The proposed study is grounded in cartography and it is informed by experimental design standards from perceptual and cognitive discipli-nes. We first approached this research by systematically identifying and designing complex perception tasks for which SOTs are designed. We spe-cifically focused on tasks that require regional comparison and the interpre-tation of general distributions. We will also measure subjects’ cognitive abi-lities using spatial abiabi-lities test such as mental rotation and paper folding
7. Acknowledgements
The authors wish to thank colleagues at the giCentre for their thoughts and ideas during the design process of the visual tasks.
References
Andrienko, G., Andrienko, N., Jankowski, P., Kraak, M.-J., Keim, D. & MacEachren, A., (2007). Geovisual Analytics for Spatial Decision Support: Setting the Research Agenda. International Journal of Geographical Information Science, v.21 (8), pp 839-857.
Andrienko, N. & Andrienko, G. (2006). Exploratory Analysis of Spatial and Temporal Data: A Systematic Approach. Berlin: Springer.
Bertin, J. (1967). Semiology of Graphics. Translated by William J. Berg., 2011 New York: Esri Press.
Fabrikant, S. (2011). Evidence of geovis(ual analytics) utility and usefulness. Paper presented at: Persistent problems in geographic visualization:, ICC 2011 Workshop, 2 July Organized by the ICA Commission on Geovisualization Retrieved 09/11/2012 from http://geoanalytics.net/ica/icc2011workshop.htm
Few, S. (2011). Visual Business Intelligence for enlightening analysis and communication. Retrieved 09/11/2012 from Perceptual Edge http://www.perceptualedge.com/
Heer, J & Robertson, G. (2007). Animated Transitions in Statistical Data Graphics. IEEE Transactions on Visualization and Computer Graphics 13, no. 6 (Nov):pp 1240–1247.
Hegarty, M. & Waller, D. (2006). Individual differences in spatial abilities. In Shah, P. & Mikaye, A. (Eds). Handbook of visuospatial thinking (pp. 121–169). Cambridge: Cambridge University Press.
Kong, N. Heer, J. & Agrawala, M. (2010). Perceptual Guidelines for Creating Rectangular Treemaps in IEEE Transactions on Visualization and Computer Graphics 16, no. 6 , pp 990–998.
Leicestershire County Council (LCC). (2010). Delivering a Sustainable Transport in Leicestershire. Retrieved from http://bit.ly/9r98dQ
MacEachren, A.M. (1995). How Maps Work: Representation, Visualization and Design. New York. The Guilford press.
Slocum, T. A., Blok, C., Jiang, B., Koussoulakou, A., Montello, D. R., Fuhrmann, S., et al. (2001). Cognitive and Usability Issues in Geovisualization. Cartography and Geographic Information Science 28, no. 1 ,pp 61-75.
Tobler, W. (2004). Thirty Five Years of Computer Cartograms. Annals of the Association of American Geographers, 94, pp 58–73.
Wilkening, J., & Fabrikant, S. I. (2011). The Effect of Gender and Spatial Abilities on Map Use Preferences and Performance in Road Selection Tasks. 25th International Cartographic Conference. Paris: International Cartographic Association.
Wood, J., & Dykes, J. (2008a). From Slice and Dice to Hierarchical Cartograms: Spatial Referencing of Treemaps. "Proceedings of the GIS Research UK 16th An-nual Conference GISRUK 2008." , (Lambrick, D. Eds.), pp. 1-8, Manchester Metro-politan University, Manchester.
Wood, J., & Dykes, J. (2008b). Spatially ordered treemaps. IEEE Transactions