EFFECTIVENESS OF RURAL OBESITY REDUCTION PROGRAM
(BEHAVIOURAL INTERVENTIONS) ON KNOWLEDGE,
ATTITUDE, PRACTICE TOWARDS OBESITY AND OBESITY
REDUCTION AMONG THE OBESE ADULT POPULATION AT
SELECTED RURAL COMMUNITIES OF OMAYAL ACHI
COMMUNITY HEALTH CENTRE
THESIS
Submitted to
THE TAMIL NADU DR. M.G.R MEDICAL UNIVERSITY,
CHENNAI
for the award of the degree of
DOCTOR OF PHILOSOPHY
IN
NURSING
By
R. PADMAVATHI
Under the Guidance ofDr. REVATHY VIJAYALAKSHMI, M.D., Ph.D.,
RESEARCH GUIDE
OMAYAL ACHI COLLEGE OF NURSING
CHENNAI – 600 066
EFFECTIVENESS OF RURAL OBESITY REDUCTION PROGRAM
(BEHAVIOURAL INTERVENTIONS) ON KNOWLEDGE,
ATTITUDE, PRACTICE TOWARDS OBESITY AND OBESITY
REDUCTION AMONG THE OBESE ADULT POPULATION AT
SELECTED RURAL COMMUNITIES OF OMAYAL ACHI
COMMUNITY HEALTH CENTRE
THESIS
Submitted toTHE TAMIL NADU DR. M.G.R MEDICAL UNIVERSITY,
CHENNAI
for the award of the degree of
DOCTOR OF PHILOSOPHY
IN
NURSING
By
R. PADMAVATHI
Guided byDr. REVATHY VIJAYALAKSHMI, M.D., Ph.D.,
RESEARCH GUIDE
OMAYAL ACHI COLLEGE OF NURSING
CHENNAI – 600 066
CERTIFICATE
This is to certify that the thesis entitled “A TRUE EXPERIMENTAL STUDY TO ASSESS THE EFFECTIVENESS OF RURAL OBESITY REDUCTION
PROGRAM (BEHAVIOURAL INTERVENTIONS) ON KNOWLEDGE,
ATTITUDE, PRACTICE TOWARDS OBESITY AND OBESITY REDUCTION AMONG THE OBESE ADULT POPULATION AT SELECTED RURAL COMMUNITIES OF OMAYAL ACHI COMMUNITY HEALTH CENTRE” submitted by Mrs.R.PADMAVATHI for the award of the Degree of Doctor of Philosophy in Nursing, is a bonafide record of research done by her during the period of study, under my supervision and guidance and that it has not formed the basis for the award of any other Degree, Diploma, Associate ship, Fellowship or other similar title. I also certify that this thesis is her original independent work. I recommend that this thesis should be placed before the examiners for their consideration for the award of Ph.D. Degree in Nursing.
Research Guide
Dr. REVATHY VIJAYALAKSHMI, M.D., Ph.D., Ph.D., Guide,
Omayal Achi College of Nursing, 45, Ambattur Road,
Puzhal, Chennai – 66
This is to certify that the thesis entitled “A TRUE EXPERIMENTAL STUDY TO ASSESS THE EFFECTIVENESS OF RURAL OBESITY REDUCTION
PROGRAM (BEHAVIOURAL INTERVENTIONS) ON KNOWLEDGE,
ATTITUDE, PRACTICE TOWARDS OBESITY AND OBESITY REDUCTION AMONG THE OBESE ADULT POPULATION AT SELECTED RURAL COMMUNITIES OF OMAYAL ACHI COMMUNITY HEALTH CENTRE” submitted by Mrs.R.PADMAVATHI for the award of the Degree of Doctor of Philosophy in Nursing, is a bonafide record of research done by her during the period of study, under my supervision and guidance and that it has not formed the basis for the award of any other Degree, Diploma, Associate ship, Fellowship or other similar title. I also certify that this thesis is her original independent work. I recommend that this thesis should be placed before the examiners for their consideration for the award of Ph.D. Degree in Nursing.
Research Co-Guide
Dr. S. KANCHANA, M.Sc (N)., Ph.D., PRINCIPAL,
Omayal Achi College of Nursing, 45 Ambattur Road,
Puzhal, Chennai – 66
I hereby declare that this thesis entitled “A TRUE EXPERIMENTAL STUDY TO ASSESS THE EFFECTIVENESS OF RURAL OBESITY REDUCTION
PROGRAM (BEHAVIOURAL INTERVENTIONS) ON KNOWLEDGE,
ATTITUDE, PRACTICE TOWARDS OBESITY AND OBESITY REDUCTION AMONG THE OBESE ADULT POPULATION AT SELECTED RURAL COMMUNITIES OF OMAYAL ACHI COMMUNITY HEALTH CENTRE” is my own work carried out under the guide ship of Dr. REVATHY VIJAYALAKSHMI, M.D., Ph.D., Research Guide, Omayal Achi College of Nursing which was approved by the Research Committee, The Tamil Nadu Dr.M.G.R Medical University, Guindy, Chennai.
I further declare that to the best of my knowledge the thesis does not contain any part of any work which has been submitted for the award of any degree either in this University or in any other University / Deemed University without proper citation.
Mrs. R. PADMAVATHI Research Scholar
First and foremost with all veneration and composure I thank the Lord Radha Giridhari for his divine blessings and mercy which surrounded me throughout my study for executing this into reality. I earnestly wish that he would continue to do the same in all the things I execute in the future ahead.
I intensely value Mrs. Valli Alagappan, Managing Trustee & Chairperson Governing Council, for selecting me to do my PhD at Omayal Achi College of Nursing and also for extending their idealistic guidance which made my aspiration of completing the Ph D(N) into actuality.
I am grateful to Dr.D.Shantharam M.D, (Diab),Vice Chancellor and Research Department of the Tamil Nadu Dr.M.G.R.Medical University, Guindy, Chennai, for giving me the privilege to undertake my PhD in Nursing at this esteemed University.
I take this opportunity to place on in testimony my deep sense of gratitude to Dr.Revathy Vijayalakshmi, M.D., Ph.D. Guide of Omayal Achi College of Nursing, for her indepth interest, constant support and encouragement, deliberate ideas and valuable guidance. Her kindness in approach guided me in implementing the thesis.
manuscript and for revolutionizing it into a thesis.
This thesis has been accomplished under the meticulous supervision and assistance of the subject expert Dr.K.R.Rajanarayanan, MBBS., FRSH.(Lond.), Research Co-ordinator, ICCR, and Governing Council Member, Omayal Achi College of Nursing, for providing ethical approval, unvarying and persistent support for the study.
I am immensely indebted to the Advisory Committee Members Dr. A. Judie, M.Sc(N), Ph.D., and Dr.Susila, M.Sc(N), Ph.D., for their proficient guidance, thought provoking ideas and persistent spirit which persuaded me to accomplish this study.
I also express my gratitude and immense thanks to Dr.D. Celina M.Sc.(N), Ph.D., Vice principal and Dr. Ciby Jose M.Sc.(N)., Ph.D, HOD of Psychiatric Nursing, Omayal Achi College of Nursing, for their timely help, encouragement and moral support.
I would like to place on record my deep sense of gratitude to Dr.Esther Lydia Asst.Professor, Loyola college for her scholastic brilliance and efficient guidance in constructing my research tool.
suggested the necessary amendments to refine the data collection instrument.
My deepest gratitude to Mr.K.Arunachalam MA, B.Ed., Manager of Krishnaswamy Engineering College Cuddallore, for editing the tool and teaching package in Tamil. My deepest gratitude to Mr.Sridhar Soft Skill Trainer of MMM College of Nursing and Mr.A.Saravanan P.G Assistant in English, Govt. Boys Hr. Sec. School Govt. of Tamil Nadu, for editing the thesis in English.
A special thanks to Prof. Rosaline Rachel, M.Sc.(N)., PhD, Principal MMM College of Nursing for her moral support, sincere prayers and timely guidance in completing the manuscript.
I am immensely grateful to Ms.P.Nandhini, Nurse researcher, Ms.Sheeba Suvitha, Incharge of Community Health Centre Arakambakam, Ms.S.Florence, Ms.K.Manonmani, Ms.D.Thilagam. Ms.M.Jayalakshmi and Staffs of OACHC for their kind help during the data collection period and all their aid towards my study.
Mr.G.K.Venkataraman elite computers for his dedication and steady determination in renovating this manuscript into a thesis.
I express my profound gratitude and heartfelt thanks to my friends Ms.A.Lakshmi, Mr.S.Dinesh and Ms.Sathyalatha and Ms.M.Sumathi for their creative minds, helping hearts and mighty hands in successful conduct of this thesis.
I am grateful to all the obese clients and their family members who had participated in my study. I am extremely thankful to the Village Presidents , Ward members for permitting me to carry out my study in their locality. I also extend my deep sense of gratitude to all the members of the Women Self Help Group and the Village Health Empowerment Trained volunteers for their untiring and sincere help throughout the period of data collection and for executing the interventions and helping the clients to carry it out.
I would like to express my sincere gratitude to Ms.Ashwini, Ms.Ajitha Ms.Divya and Ms.Kanaga Staff Nurses Madras Medical Mission for extending their dedicated, sincere and timely support in preparation of the manuscript.
philosopher and guide Dr. Vijayalakshmi.S Principal of Vignesh College of Nursing who is the main source of inspiration and motivation towards the research. Her constant guidance, continuous support, timely assistance and moral support which made me to keep moving towards the achievement of targets in my personal, professional and spiritual life and particularly to complete this manuscript.
I render my affectionate and sincere gratitude to my Parents Mr. Rathina Achari and Mrs.Saroja for their commitment, guidance and lifetime support beyond their threshold throughout my personal and professional carrier without whom my present position in my personal and professional career would not have been possible.
I extend my sincere gratitude to my Soulmate Mr.Kamaraj, for being my medium and source of support to pursue my Ph.D. and to my children K.Sahishnudha and K.Mukundhan, for their technical support and bearing seclusion for the benefit of their mother throughout the study period.
I am privileged to offer my humble gratitude to Shree. Sevagabathi Das my Spiritual Master who leads us to the lotus feet of supreme personality of god head and craft and construct peace in our life by making us to realise the hurdles of this materialistic world. His guidance helps us to sense the presence of godliness in each and every endeavour of our personal and professional life.
NCDs - Non Communicable Diseases
DR-NCDs - Diet Related Non Communicable Diseases DALYs - Disability Adjusted Life Years
WHO - World Health Organisation GSR - Global Status Report
IHPS - International Heart Protection Summit
OECD - Organisation for Economic Cooperation and Developments NHNES - National Health and Nutrition Examination Survey
NCHS - National Centre for Health Statistics GHO - Global Health Observatory
NFHS - National Family Health Survey GBD - Global Burden of Disease report
AFR - African Region
AMR - Region of the Americas EMR - Eastern Mediterranean Region
EUR - European Region
SEAR - South East Asia Region WPR - Western Pacific Region SSA - Sub Saharan Africa SAI - South Asian Indians
GDM - Gestational Diabetes Mellitus CVD - Cardio Vascular Diseases
HTN - Hypertension
CHD - Coronary Heart Disease LDL - Low Density Lipoprotein HDL - High Density Lipoprotein SFA - Saturated Fatty Acids TFA - Trans Fatty Acids
MUFA - Mono Unsaturated Fatty Acids PUFA - Poly Unsaturated Fatty Acids ICMR - Indian Council of Medical Research OACHC - Omayal Achi Community Health Centre SES - Socio Economic Status
HDI - Human Development Index
NCD’s - Non Communicable Diseases CKD - Chronic Kidney Disease
HD - Hemo dialysis
DM - Diabetes Mellitus
BPH - Benign Prostatic Hyperplacia NASH - Non Alcoholic Steato Hepatitis OA - Osteo Arthritis
APMBSS - Asia Pacific Metabolic and Bariatric Surgery Society LAGB - Laparoscopic Adjustable Gastric Banding
LMGB - Laparoscopic Mini Gastric Bypass KBW - Knowledge Based Work
MDGs - Millennium Development Goals TLC - Therapeutic Lifestyle Changes METs - Metabolic Equivalents of Task PA - Physical Activity
BMI - Body Mass Index WC - Waist Circumference PBF - Percent Body Fat
FFQ - Food Frequency Questionnaire RORP - Rural Obesity Reduction Programe
IEC - Information Education and Communication OACHC - Omayal Achi Community Health Centre VHET - Village Health Empowerment Training
NS - Not Significant
SD - Standard Deviation
CHAPTER
NO. TITLE
PAGE NO.
1 INTRODUCTION
1.1 Background of the study 7
1.2 Significance and need for the study 26
1.3 Conceptual Framework 36
1.3.1 Conceptual Framework- General Concepts 36
1.3.2 Application of Conceptual Framework 42
2 AIMS AND OBJECTIVES
2.1 Title 46
2.2 Statement of the problem 46
2.3 Objectives of the study 46
2.4 Null hypotheses 47
2.5 Operational definitions 47
2.6 Assumptions 50
2.7 Delimitation 50
3 REVIEW OF LITERATURE
3.1 Part -1 General concepts of obesity 52
3.2 Part -2 Research studies related to 67
3.2.1 Reviews related to prevalence of obesity among adults 67
3.2.2 Reviews related to general aspects of Obesity 72
3.2.3
Reviews related to weight reducing strategies of obesity among obese adults.
NO. NO.
4 MATERIALS AND METHODS
4.1 Research Approach 102
4.2 Research Design 102
4.3 Variables of Study 103
4.4 Research Setting 104
4.5 Population 104
4.6 Sample and Sample size 105
4.7 Sample selection criteria 107
4.8 Sampling Technique 107
4.9 Data Collection Instrument 109
4.10 Interventions 114
4.11 Content validity 116
4.12 Reliability of the tool 116
4.13 Ethical considerations 117
4.14 Pilot study 118
4.15 Data Collection procedure 120
4.16 Data Analysis Procedure 126
5 RESULTS AND ANALYSIS
5.1
Description of background variables of obese adults in experimental and control group.
134
5.2
Assessment and comparison of knowledge, attitude, practices towards obesity and obesity reduction among the obese adults in experimental and control group.
NO. NO.
5.3
Effectiveness of Rural Obesity Reduction Programe on knowledge, attitude, practices towards obesity and obesity reduction among obese adults within and between the experimental and control group.
164
5.4
Assessment of relationship among the knowledge, attitude, practice and obesity reduction in pre and post test of the experimental and control group.
208
5.5
Association of mean differed knowledge, attitude, practice and obesity reduction with selected demographic variables of obese adults in the experimental group.
210
6 DISCUSSION 214
7
SUMMARY, CONCLUSION, IMPLICATIONS,
RECOMMENDATIONS AND LIMITATION
233
REFERENCES 248
SL. NO. TITLE PAGE NO.
1.1.1 Indian states ranked in order of percentage of people with
overweight or obese 22
5.1.1 Frequency and percentage distribution of general demographic
variables of obese adults in experimental and control group. 134
5.1.2
Frequency and percentage distribution of family history of Non Communicable Diseases of obese adults in experimental and control group.
137
5.1.3
Frequency and percentage distribution of obesity related factors -personal history of Non Communicable Diseases and sleep pattern of obese adults in experimental and control group.
140
5.1.4
Frequency and percentage distribution of obesity related factors – smoking and use of smokeless tobacco of obese adults in experimental and control group.
142
5.1.5
Frequency and percentage distribution of obesity related factors – use of alcohol and habit of exercise of obese adults in experimental and control group.
144
5.1.6
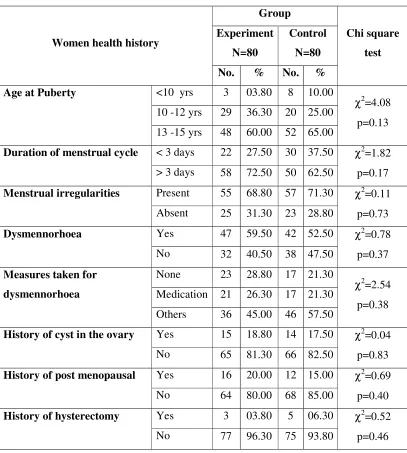
Frequency and percentage distribution of obesity related factors – women health history of obese women clients in experimental and control group.
146
5.2.1 Assessment of pre test mean, SD and percentage of knowledge
components score in experimental and control 148
5.2.2 Assessment of post test mean, SD and percentage of knowledge
components score in experimental and control group 149
5.2.3 Frequency, percentage and comparison of level of knowledge of
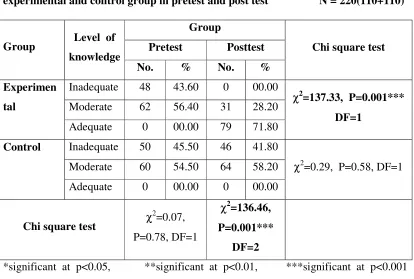
experimental and control group in the pre test and post test 150
5.2.4 Frequency, percentage and comparison of level of attitude of
experimental and control group in the pre test and post test 152
5.2.5 Assessment of pre test mean, SD and percentage of practice
NO.
5.2.6 Assessment of post test mean, SD and percentage of practice
components score in experimental and control group. 155
5.2.7 Frequency, percentage and comparison of level of practice of
experimental and control group in the pre test and post test 156
5.2.8 Frequency, percentage and comparison of obesity reduction - BMI
of experimental and control group in the pre test and post test 158
5.2.9 Frequency, percentage and comparison of obesity reduction - WC of
experimental and control group in the pre test and post test 160
5.2.10 Frequency, percentage and comparison of obesity reduction - PBF
of experimental and control group in the pre test and post test 162
5.3.1 Comparison of pretest and post test mean knowledge components
score in the experimental group 164
5.3.2 Comparison of pretest and post test mean knowledge components
score in the control group 166
5.3.3. Comparison of pretest mean knowledge components score between
the experimental and control group 168
5.3.4 Comparison of post test mean knowledge components score
between the experimental and control group. 170
5.3.5 Comparison of overall pre and post test mean knowledge score in
the experimental and control group. 172
5.3.6 Comparison of overall pre and post test mean attitude score in the
experimental and control group. 173
5.3.7 Comparison of pre test and post test mean practice components
score in experimental group. 174
5.3.8 Comparison of pre test and post test mean practice components
score in control group 176
5.3.9 Comparison of pre test mean practice components score between
experimental group and control group 177
5.3.10 Comparison of post test mean practice components score between
NO.
5.3.11 Comparison of overall pre and post test mean practice score in the
experimental and control group. 180
5.3.12 Comparison of calories and nutrients consumption within the
experimental and control group in the pretest and post test. 181
5.3.13 Comparison of calories and nutrients consumption between the
experimental and control group in the pretest and post test. 183
5.3.14 Comparison of pre test and post test food frequency in the
experimental group 185
5.3.15 Comparison of pre test and post test food frequency in the
experimental group 188
5.3.16 Comparison of pre test and post test food frequency in the control
group 190
5.3.17 Comparison of pre test and post test food frequency in the control
group 192
5.3.18
Comparison of food frequency between the experimental and
control group in the pre test. 194
5.3.19
Comparison of food frequency between the experimental and
control group in the pre test. 196
5.3.20 Comparison of food frequency between the experimental and
control group in the post test. 198
5.3.21 Comparison of food frequency between the experimental and
control group in the post test. 201
5.3.22 Comparison of overall pre and post test mean obesity reduction
(BMI) in the experimental and control group. 203
5.3.23 Comparison of overall pre and post test mean obesity reduction
(WC) in the experimental and control group. 204
5.3.24 Comparison of overall pre and post test mean obesity reduction
NO.
5.3.25
Overall effectiveness of Rural Obesity Reduction Program on knowledge, attitude, practices towards obesity and Obesity reduction among the Obese adults within experimental and control group in the pre and post test.
206
5.4.1
Assessment of relationship among the knowledge, attitude, practice and obesity reduction in the pre and post test of the experimental group.
208
5.4.2 Assessment of relationship among the knowledge, attitude, practice
and obesity reduction in the pre and post test of the control group. 209
5.5.1 Association of mean differed knowledge with selected
demographic variables of obese adults in the experimental group 210
5.5.2 Association of mean differed attitude with selected demographic
variables of obese adults in the experimental group 211
5.5.3 Association of mean differed practice with selected demographic
variables of obese adults in the experimental group 212
5.5.4 Association of mean differed obesity reduction with selected
SL. NO. TITLE
1.1 Percentage of actual and projected total deaths attributed to NCDs in developing countries
1.1.1 Probablity of death from NCD between ages 30 and 70, 2008 1.1.2 Global death by cause and by income group 2008
1.1.3 Death by cause and by income group at WHO region 2008 1.1.4 Shifting disease burden – from communicable diseases to NCDs 1.1.5 India’s disease profile
1.1.6 Causes of death in India by 2008.
1.1.7 percentage of obesity among the countries based on their income level
1.1.8 percentage of population affected by overweight and obesity in the OECD countries
1.1.9 prevalence of obesity among the adults in US 2009-2010 in the OECD countries
1.1.10 Estimated percentage of deaths, by cause, in member countries of the South-East Asia Region, 2008
1.1.11 Trends in estimated percentage of deaths, by cause, in South-East Asia Region, 2004 and 2030
1.1.12 Estimated percentage of premature deaths (under 60 years of age), by cause, South-East Asia Region vs rest of the world, 2008
1.1.13 Age-standardized death rates due to non-communicable diseases (NCDs) per 100 000 population in member countries of SEAR, 2008
1.1.14 Proportion of adults overweight in 1980 and 2008 among the developing and developed world countries.
1.1.15 Prevalence of obesity among the women in the south India
1.1.16
Temporal changes in prevalence (%) of obesity (≥25 kg/m2) among urban and rural Asian Indians. (a) The data for urban population; (b) the data for rural population
1.3.2 Omaha system model of problem solving process
1.3.3
Integrated conceptual framework based on Integrated Theory of Health Behaviour Change (ITHBC, 2009) and Omaha system model of problem solving (2005).
4.15.1 Schematic representation of data collection procedure
5.1.1(a) Percentage distribution of age of obese adults in experimental and control group.
5.1.1(b) Percentage distribution of gender of obese adults in experimental and control group.
5.1.1(c) Percentage distribution of educational status of obese adults in experimental and control group.
5.1.1(d) Percentage distribution of occupational status of obese adults in experimental and control group.
5.1.1(e) Percentage distribution of monthly family income of obese adults in experimental and control group
5.1.1(f) Percentage distribution of marital status of obese adults in experimental and control group.
5.1.1(g) Percentage distribution of type of family of obese adults in experimental and control group.
5.1.1(h) Percentage distribution of family size of obese adults in experimental and control group.
5.1.2 Percentage distribution of family history of NCDs of obese adults in experimental and control group.
5.1.3 Percentage distribution of personal history of NCDs of obese adults in experimental and control group.
5.1.4 Percentage distribution of history of smoking of obese adults in experimental and control group.
5.1.5(a) Percentage distribution of use of alcohol of obese adults in experimental and control group.
5.1.6 Percentage distribution of age at menarche of obese women adults in experimental and control group.
5.2.3 Comparison of level of knowledge in the pre and post test for experimental and control group
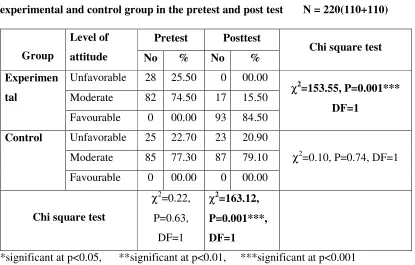
5.2.4 Comparison of level of attitude in the pre and post test for experimental and control group
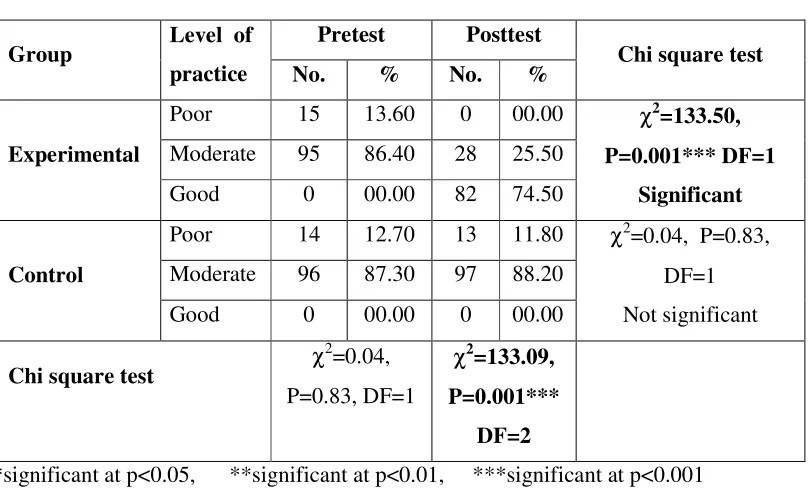
5.2.7 Comparison of level of practice in the pre and post test for experimental and control group
5.2.8 Comparison of level of BMI in the pre and post test for experimental and control group
5.2.9 Comparison of level of WC in the pre and post test for experimental and control group
5.2.10 Comparison of level of PBF in the pre and post test for experimental and control group
5.3.5 Box-plot compares the pretest and posttest knowledge score among the obese adults in the experimental and control group
5.3.6 Box-plot compares the pretest and posttest attitude score among the obese adults in the experimental and control group
5.3.11 Box-plot compares the pretest and posttest practice score among the obese adults in the experimental and control group
5.4.1 Correlation matrix shows the correlation between knowledge, attitude, practice and obesity among the obese adults of experiment group
5.5.1(a) Association of demographic variable age with the mean differed knowledge of obese adults in the experimental group
5.5.1(b) Association of demographic variable gender with the mean differed knowledge of obese adults in the experimental group
5.5.1(c) Association of demographic variable family history of NCDs with the mean differed knowledge of obese adults in the experimental group
5.5.2(b) Association of demographic variable educational status with the mean differed attitude of obese adults in the experimental group
5.5.2(c) Association of demographic variable personal history of NCDs with the mean differed attitude of obese adults in the experimental group
5.5.3(a) Association of demographic variable age with the mean differed practice of obese adults in the experimental group
5.5.3(b) Association of demographic variable family history of NCDs with the mean differed practice of obese adults in the experimental group
5.5.3(c) Association of demographic variable personal history of NCDs with the mean differed practice of obese adults in the experimental group
5.5.4(a) Association of demographic variable gender with the mean differed obesity reduction of obese adults in the experimental group
5.5.4(b) Association of demographic variable family history of NCDs with the mean differed obesity reduction of obese adults in the experimental group
Sl.No. Title A Provisional registration for Full time Ph. D Degree B Full time Ph.D Research Programme Proforma C Ph.D Research Execution Plan
D Ethical Clearance Certificate, IEC Approval Certificate
E Permission for conduction of the study in the Data Collection Setting F Related research work executed
G List of experts for content validity H Bio-physiological tool validity certificate
I English and Tamil editing certificate J Tool in English and Tamil
K Intervention Tool - English & Tamil L Ph.D Synopsis submission application form M Ph.D Thesis submission application form N Photos
Non communicable diseases (NCDs), also referred to as chronic diseases, are the leading causes of death worldwide responsible for 63% of the 57 million deaths that occurred in 2008. The majority of these deaths -36 million - were attributed to cardiovascular diseases and diabetes, cancers and chronic respiratory diseases, and also 80 percent of NCD deaths were in developing countries, up from 40 percent in 1990.
NCDs will steadily increase the number of healthy years lost (or disability-adjusted life
years—DALYs) in middle-income countries, but the loss will increase very quickly in
low-income countries. By 2030, low-income countries will have eight times more deaths
attributed to NCDs than high-income countries1.
According to WHO Metabolic/physiological risk factors like raised blood pressure, overweight/obesity, hyperglycemia (high blood glucose levels) and hyperlipidemia (high levels of fat in the blood) causes key metabolic/physiological changes that increase the risk of NCDs. In terms of attributable deaths, the leading NCD risk factor globally is elevated blood pressure (to which 16.5% of global deaths are attributed) followed by tobacco use (9%), raised blood glucose (6%), physical inactivity (6%) and overweight and obesity (5%). Low- and middle-income countries are witnessing the fastest rise in overweight among young children5.
intake of calories have resulted in rising rates of obesity in several developing countries7.
Obesity level in India is on the rise. If rising trends are to be halted and reversed, current approaches to addressing obesity needs to be changed. The following are the suggested strategies to control the obesity. (i) to educate the obese clients and promote the healthy lifestyle (ii) early detection of persons with risk factors and (iii) cost– effective interventions for reducing risk.
A true experimental study to assess the effectiveness of Rural Obesity Reduction Program (Behavioural intervention) on Knowledge, Attitude, Practice towards Obesity and Obesity reduction among the obese adult population at selected rural communities of Omayal Achi Community Health Centre. The abstract was presented as introduction, method, results, analysis and discussion (IMRAD) format of writing.
The objectives of the study were
1. To assess and compare the pretest and post test level of knowledge, attitude, practice and obesity among the obese adults of experimental and control groups. 2. To determine the effectiveness of Rural Obesity Reduction Program on
knowledge, attitude, practice and obesity reduction of obese adults.
3. To identify the relationship among the knowledge, attitude, practice and obesity reduction in the pre and post test of experimental and control group.
NH1: There is no significant difference in the pre and post test level of knowledge, attitude, practice and obesity reduction among the obese adults within and between the experimental and control group at p<0.05.
NH2: There is no significant relationship among the knowledge, attitude, practice and obesity reduction in the pre and post test of the experimental and control group at p<0.05.
NH3: There is no significant association of mean differed knowledge, attitude, practice and obesity reduction of obese adults of the experimental group with their selected demographic variables at p<0.05.
The research process for this study was guided by the conceptual framework based on the integrated Omaha System model of problem solving process and Integrated Theory of Health Behaviour Change (ITHBC).
A true experimental research design was adopted for the study. The independent variable for the study was Rural Obesity Reduction Programme and the dependent variable for the study was knowledge, attitude, practice towards obesity and obesity reduction. The study was conducted in 6 adopted villages of Omayal Achi Community Health Centre. The samples of the study were all obese adults between the age group of 20-50 years. Probability multi stage sampling technique was used to select the villages and sample for the study.
activity and lifestyle practices check list to assess the practice towards obesity and bio physiological measurements of BMI, WC and PBF to assess the level of obesity. The data collection was preceded with the obesity screening and the adults identified as obese were allocated to experimental and control group.
In the first week, pre test assessment was done. After completing the three day dietary recall in the pre test Rural Obesity Reduction Programme (RORP) was administered on the same day. RORP consisted of IEC on general aspects of obesity using flash card, low calorie diet prescription for dietary modification and recommendation on walking exercise for physical activity modification and personalised individual counselling to bring behavioural changes. Intervention was given for a period of 12 weeks. The post test 1 assessment was carried out after six weeks. Post test 2 assessment was done at 12th week to assess the obesity level. Totally 12 weeks were allotted to complete the data collection process with each individual. The obtained data was analysed using descriptive and inferential statistics.
The major findings of the study were
• The analysis revealed that in the experimental group, the overall mean knowledge
score in the post test was 19.81 with S.D of 2.31 whereas in control group, it was 11.19 with S.D of 2.18. The unpaired ‘t’ test value was t = 28.47 which was greater than the table value at p=0.001 and revealed that there was a high significant difference between the experimental and control group at p<0.001 level.
table value at p=0.001 and revealed that there was a high significant difference between the experimental and control group at p<0.001 level.
• The analysis also revealed that in the experimental group, the overall mean practice
score in the post test was 129.17 with S.D of 7.49 whereas in control group, it was 84.95 with S.D of 15.51. The unpaired ‘t’ test value was t = 26.91 which was greater than the table value at p=0.001 and revealed that there was a high significant difference between the experimental and control group at p<0.001 level.
• The analysis found that in the experimental group, the overall mean kilo calories,
carbohydrates and fat consumption in the post test was 1403.47 with S.D of 183.92, 248.03 with SD of 39.26 and 28.10 with the SD of 13.95 respectively whereas in control group, it remained the same with mild increase and decrease as 2663.28 with S.D of 330.36, 428.53 with S.D of 89.44, 69.15 with S.D of 31.77. The unpaired ‘t’ test value was t = 33.76, t=19.38 and t=5.71 which was greater than the table value at p=0.001 for all three components and revealed that there was a high significant difference between the experimental and control group at p<0.001 level.
• Analysis of food frequency revealed that there was statistically significant difference
was found in the pre and post test of experimental and also between experimental and control group in the consumption of cereals, refined cereals, pulses, salty foods, yellow vegetables, green leafy vegetables, fruits, milk and milk products, fish meat and chicken, egg, sweets and chocolates, instant foods, coffee and tea and use of palm oil between the experimental and control group in the post test.
• Regarding the Obesity reduction the analysis revealed that in the post test of
S.D of 3.11, 90.85 with S.D of 6.84 and 34.69 with S.D of 5.44. The unpaired ‘t’ test value was t = 6.12, t=2.52 and t=2.14 which was greater than the table value at p=0.001, p=0.01 and p=0.03 for all three components and revealed that there was a high significant difference between the experimental and control group.
• Chi-square test revealed that there was statistically significant association was found
between the study variables knowledge, attitude, practice and obesity reduction and the selected demographic variables of age, gender, education, family history of NCDs, personal history of NCDs and habit of exercise.
• The evidence generated from the study revealed that for the experimental group the
Rural Obesity Reduction Programme had significant impact in improving the knowledge, attitude, practice and level of obesity reduction at p=0.001 level. The calorie, carbohydrate and fat consumption also was reduced and there was statistically significant difference at p=0.001 level. There was also fair correlation among the knowledge, attitude, practice and level of obesity reduction. Hence there was statistically significant difference between the experimental and control group.
CONCLUSION
CHAPTER - 1
INTRODUCTION
When God created the earth he created man, animals, plants and even
microorganisms in it so that everyone in his creation would live in harmony with the
other. Several human activities such as destruction of forests, changes in agriculture,
encroachment on wildlife habits and uncontrolled industrialization have led to the
emergence of viruses, bacteria, protozoa and spread of diseases like plague, small pox,
tuberculosis, typhoid, cholera, etc., When these communicable diseases were at its peak;
the advent of death or illness due to accidents caused due to the carelessness of our co-
human beings. Then came in an era where the poor and unhealthy daily activities of
individual themselves posed a great threat to their own life and survival resulting in non
communicable diseases. There has been a big shift in the health burden of the world with
a change from communicable to non-communicable diseases. The situation has come
now that the scientists, researchers and policy makers who work on NCD’s have to
formulate health care policies and prevention programs urgently.
Noncommunicable diseases (NCDs), also referred to as chronic diseases, are the
leading causes of death worldwide responsible for 63% of the 57 million deaths that
occurred in 2008. The majority of these deaths almost 36 million were due to
cardiovascular diseases, diabetes, cancers and chronic respiratory diseases. Majority 80
percent of NCD deaths were in developing countries, up from 40 percent in 1990. NCDs
will steadily increase the number of healthy years lost (or disability-adjusted life years—
DALYs) in middle-income countries and the loss will be very rapid in low-income
countries. By 2030, low-income countries will have eight times more deaths due to
Alarmingly, NCD-related mortality occurs at earlier ages in developing countries:
29 percent of NCD-related deaths in developing countries occur before the age of 60,
when compared with 13 percent in developed countries. For example, the average age of
the first-time heart attack sufferer in South Asia is 53, six years younger than the world
average. NCDs are now affecting more people who are in their prime economically
productive years, and these deaths are frequently preceded by years of disability as
reported by world population data sheet 20122.
Non communicable diseases (NCDs) do not spread from person to person. They
are of long duration and generally slow in progression. The four main types of non
communicable diseases are cardiovascular diseases (like heart attacks and stroke),
cancers, chronic respiratory diseases (such as chronic obstructive pulmonary disease and
asthma) and diabetes. NCDs already disproportionately affect low- and middle-income
countries where nearly 80% of NCD deaths – 29 million – occur5.
Figure: 1.1 Percentage of actual and projected total deaths attributed to NCDs in developing countries
NCDs are the leading causes of death in all regions except Africa, but current
projections indicate that by 2020 the largest increases in NCD deaths will occur in
Africa. In African nation deaths due to NCDs are projected to exceed the combined
deaths of communicable, nutritional diseases and maternal and perinatal deaths as the
most common causes of death by 20302.
Modifiable behavioural risk factors like tobacco use, physical inactivity,
unhealthy diet and the harmful use of alcohol increase the risk of or cause most NCDs.
Tobacco accounts for almost 6 million deaths every year (including over 600 000 deaths
from exposure to second-hand smoke), and is expected to increase to 8 million by 2030.
About 3.2 million deaths annually can be attributed to insufficient physical activity.
Approximately 1.7 million deaths are attributable to low fruit and vegetable
consumption. Half of the 2.3 million annual deaths from harmful drinking were due to
NCDs. These main behavioral risk factors, tobacco use, harmful use of alcohol,
insufficient physical activity, and unhealthy diet/obesity all of which will likely to
escalate in developing countries5.
According to WHO Metabolic/physiological risk factors like raised blood
pressure, overweight/obesity, hyperglycemia (high blood glucose levels) and
hyperlipidemia (high levels of fat in the blood) causes key metabolic/physiological
changes that increase the risk of NCDs. In terms of attributable deaths, the leading NCD
risk factor globally is elevated blood pressure (to which 16.5% of global deaths are
attributed) followed by tobacco use (9%), raised blood glucose (6%), physical inactivity
(6%) and overweight and obesity (5%). Low- and middle-income countries are
According to the World Bank, more than half of the NCD burden could be avoided
through health promotion and prevention initiatives. Relying solely on treatment options
to combat NCDs is very costly, particularly in developing countries where governments
and health infrastructures are unprepared to respond to this growing problem. A focus on
strengthening protective factors and earlier investment in prevention of NCDs among
young people is therefore essential2.
Report on Causes of Death: 2001-03, Office of Registrar General, India reported that
non communicable diseases are the leading causes of death in the country, constituting
42% of all deaths. Communicable, Maternal, Perinatal and Nutritional conditions
constitute another 38% of deaths. Injuries and ill-defined causes constitute 10% of deaths
each. However, majority of ill-defined causes are at older ages (70 or higher years) and
most of ill-defined deaths are likely to be from non-communicable diseases. Overall, the
leading cause of death is cardiovascular disease (19%), followed by respiratory diseases
(namely chronic obstructive pulmonary disease or COPD8.
As of 2004, NCDs contributed half of the total mortality and were the major causes
of death10.Among the NCDs, cardiovascular diseases are number one cause of mortality
(52%). NCDs account for more than two-fifth (43%) of the DALYs and among this
group, cardiovascular diseases, diabetes, cancers together account for 40% of the
NCD-related DALYs in India. Regional studies have reported that even in rural India the
leading cause of death (32%) is NCDs followed by injuries and external cause of deaths
(12%)11.Projection estimates from the WHO have shown that by the year 2030, CVDs
premature, there is a substantial loss of lives during the productive years as compared to
other countries.
Global Status Report on NCDs 2010 reported that In India, 52,41,400 people
(29,67,600 men and 22,73,800 women) died in 2008 due to NCDs4.
RK Srivastava, D Bachani (2011) reported that Non communicable diseases and
injuries account for 52% of deaths in India. Burden of non communicable diseases and
resultant mortality is expected to increase unless massive efforts are made to prevent and
control NCDs and their risk factors. Based on available evidence it is visible that cancer,
diabetes, hypertension, cardiovascular diseases, stroke, chronic obstructive pulmonary
disease, chronic kidney disease, mental disorders and trauma are the leading causes of
morbidity, disability and mortality in India.9
Government of India had supported the States in prevention and control of NCDs
through several vertical programs since 1980s. However, during the 11th plan, there was
considerable upsurge to prevent and control NCDs. New programs were started on a low
scale in limited number of districts. However, there has not been any considerable
change in the burden of NCDs. Based on experiences in the past, there is a need to
emphasize on health promotion and preventive measures to reduce the exposure to risk
factors. Facilities and capacity for screening, early diagnosis and effective management
are essential within the public health care system. Public awareness program, integrated
management and strong monitoring system would be required for successful
implementation of the program and making services universally accessible in the
Overweight and obesity are the fifth leading risk for global deaths. At least 2.8
million adults die each year as a result of being overweight or obese. In addition, 44% of
the diabetes burden, 23% of the ischaemic heart disease burden and between 7% and
41% of certain cancer burdens are attributable to overweight and obesity. WHO global
estimates of 2008 reported that more than 1.4 billion adults, 20 and older, were
overweight and of these overweight adults, over 200 million men and nearly 300 million
women were obese. Overall, more than 10% of the world’s adult population was obese.
35% of adults aged 20 and over were overweight in 2008, and 11% of them were obese3.
In 2011, more than 40 million children under the age of five were overweight.
Once considered as a high-income country problem, overweight and obesity are now on
the rise in low- and middle-income countries, particularly in urban settings. More than 30
million overweight children are living in developing countries and 10 million in
developed countries. Overweight and obesity are linked to more deaths worldwide than
underweight. For example, 65% of the world's population live in countries where
overweight and obesity kill more people than underweight (this includes all high-income
and most middle-income countries)3.
Overweight and obesity are strongly associated with diseases such as diabetes,
hypertension (HTN), cardiovascular disease (CVD) and the metabolic syndrome. Rising
rates of obesity is an epidemic in most of the developed countries and is becoming a
major health hazard in many developing nations as well. Rapid urbanization,
modernization, adoption of a lifestyle with reduced physical activity and increasing
intake of calories have resulted in rising rates of obesity in several developing countries7.
Obesity level in India is on the rise. If rising trends are to be halted and reversed,
current approaches to address the obesity need to be changed. The following are the
suggested strategies to control the obesity. (i) to educate the obese clients and promote
the healthy lifestyle (ii) early detection of persons with risk factors and (iii) cost–
effective interventions for reducing risk.7
1.1 BACKGROUND OF THE STUDY
Non communicable diseases (NCDs), mainly cardiovascular diseases, cancers,
chronic respiratory diseases and diabetes represent a leading threat to human health and
development. These four diseases are the world’s biggest killers, causing 36 million
deaths which constitute 63% of global death (57 million) in 2008 according to WHO
statistics 2012. It is also projected that annual NCD mortality may increase up to 55
million by the year 20301.
Figure: 1.1.1 Probablity of death from NCD between ages 30 and 70, 2008
Source : World Health Statistics 2012
The global burden of non communicable diseases continues to grow; tackling it
constitutes one of the major challenges for development in the twenty-first century.
Majority (80%) of all NCD deaths (29 million) occur in low and middle-income group
age of 70, compared with an estimated 26% in high income countries and a global
average of 44%. Such premature death rates from NCDs are a major consideration in
determining their impact1.
Figure : 1.1.2 Global death by cause and by income group 2008
Source : World Health Organisation
The figure highlights that the NCDs contribute to the major percentage of death
and lower middle income countries contribute to higher prevalence of NCDs. Total
deaths from non communicable diseases are projected to increase by a further 17% over
the next 10 years. The rapidly increasing burden of these diseases is affecting poor and
disadvantaged populations disproportionately, contributing to widening health gaps
between and within countries. As non communicable diseases are largely preventable,
Figure : 1.1.3. Death by cause and by income group at WHO region 2008
Source : World Health Organisation, Global Status Report on NCDs 2010
The figure denotes that with the exception of the African Region, NCD mortality
exceeds that of communicable, maternal, perinatal and nutritional conditions combined.
For men in the European Region, deaths from NCDs are estimated to be 13 times higher
than these other causes combined, and for men in the Western Pacific Region they are
estimated to be eight times higher. In 2008, the overall NCD age-standardized death rates
in low- and middle-income countries were 756 per 100 000 for males and 565 per 100
000 for females – respectively 65% and 85% higher than for men and women in
high-income countries. Age-standardized NCD mortality rates for all ages were highest in the
African Region for males (844 per 100 000) and for females (724 per 100 000). The
leading causes of NCD deaths in 2008 were: cardiovascular diseases (17 million deaths,
or 48% of NCD deaths); cancers (7.6 million, or 21% of NCD deaths); and respiratory
diseases, including asthma and chronic obstructive pulmonary disease (COPD),
cardiovascular and diabetes deaths, and almost 90% of deaths from COPD, occurred in
low- and middle-income countries. Behavioural risk factors, including tobacco use,
physical inactivity, and unhealthy diet, are responsible for about 80% of coronary heart
disease and cerebro vascular disease4.
Figure: 1.1.4 Shifting disease burden – from communicable diseases to NCDs
Source: International Heart Protection Summit (2011)
The figure projects the disease burden reported by International Heart Protection
Summit (IHPS) and revealed that 39% had communicable diseases and 36% were
affected by NCDs in the year 1970. The communicable diseases accounted for 27% of
disease burden, in contrast, 63% disease burden was due to NCDs in the year 2008,
Figure: 1.1.5 India’s disease profile
Source: WHO, Non Communicable diseases country profiles 2011
Figure denotes that NCDs contribute to 53% of total death in India and CVDs
contribute to 24% of the total NCD mortality13.
Figure: 1.1.6 Causes of death in India by 2008
Source: International health protection summit (2010)
It clearly denotes that 53% of the death was due to NCD out of which
is estimated to be responsible for 1.5 million deaths annually. It is the largest cause of
mortality, accounting for around half of all deaths resulting from NCDs, which accounts
for more than two fifth (43%) of the Disability Adjusted Lost Years (DALYS)12.
Overweight and obesity are strongly associated with diseases such as diabetes,
hypertension (HTN), cardiovascular disease (CVD) and the metabolic syndrome. Rising
rates of obesity is an epidemic in most of the developed countries and is becoming a
major health hazard in many developing nations as well. Rapid urbanization,
modernization, and adoption of a lifestyle with reduced physical activity and increasing
intake of calories have resulted in rising rates of obesity in several developing countries.
A global estimate showed that in 2005 there were nearly 1.06 billion overweight
persons of age 15 years and above. Among them at least 400 million adults were obese.
It is also predicted that by 2015 approximately 2–3 billion adults will be overweight and
more than 700 million will be obese. Asian countries, particularly China and India are
highly populous. In comparison with the developed countries such as the USA, Asian
countries have considerably lower rates of overweight and obesity7.
Obesity can be seen as the first wave of a defined cluster of non communicable
diseases called "New World Syndrome," creating an enormous socioeconomic and
public health burden in poorer countries. The World Health Organization has described
obesity as one of today's most neglected public health problems, affecting every region
WHO fact sheet on Obesity (2013) reported that in 2008 more than 1.4 billion
adults, 20 and older, were overweight. Of these overweight adults, over 200 million men
and nearly 300 million women were obese. Overall, 35% of adults aged 20 and over
were overweight and 11% were obese. More than 40 million children under the age of
five were overweight in 20113.
In 2008, 35% of adults aged 20+ were overweight (BMI ≥ 25 kg/m2) (34% men
and 35% of women). The worldwide prevalence of obesity has nearly doubled between
1980 and 2008. In 2008, 10% of men and 14% of women in the world were obese (BMI
≥30 kg/m2), compared with 5% for men and 8% for women in 1980. An estimated 205 million men and 297 million women over the age of 20 were obese – a total of more than
half a billion adults worldwide15.
The prevalence of overweight and obesity were highest in the WHO Regions of
the Americas (62% overweight in both sexes, and 26% for obesity) and lowest in the
WHO Region for South East Asia (14% overweight in both sexes and 3% for obesity). In
the WHO Region for Europe and the WHO Region for the Eastern Mediterranean and
the WHO Region for the Americas over 50% of women were overweight. For all three of
these regions, roughly half of overweight women are obese (23% in Europe, 24% in the
Eastern Mediterranean, 29% in the Americas). In all WHO regions women were more
likely to be obese than men. In the WHO regions for Africa, Eastern Mediterranean and
AFR- African Region, AMR- American Region, EMR- Eastern Mediterranean Region, EUR-European Region ,SEAR- South East Asian Region ,WPR- Region
Figure: 1.1.7 percentage of obesity among the countries based on their income level
Source: World Health Organization, Global health observatory obesity situation
and trends
The prevalence of raised body mass index increases with income level of
countries up to upper middle income levels. The prevalence of overweight in high
income and upper middle income countries was more than double that of low and lower
middle income countries. For obesity, the difference more than triples from 7% obesity
in both sexes in lower middle income countries to 24% in upper middle income
countries. Women's obesity was significantly higher than men's, with the exception of
high income countries where it was similar. In low and lower middle income countries,
obesity among women was approximately double that among men15
Overweight and obesity are linked to more deaths worldwide than underweight.
For example, 65% of the world's population live in countries where overweight and
obesity kill more people than underweight (this includes all high-income and most
were overweight. Once considered a high-income country problem, overweight and
obesity are now on the rise in low- and middle-income countries, particularly in urban
settings. More than 30 million overweight children are living in developing countries and
10 million in developed countries3.
Figure: 1.1.8 percentage of population affected by overweight and obesity in the
OECD countries
Source: OECD Health Data 2011
OECD (Organization for Economic Cooperation and Development) update 2012
doubled or tripled in 19 of 34 OECD countries and the majority of the population is now
overweight or obese. OECD projections suggest that more than two out of three people
will be overweight or obese in some OECD countries by 202014.
The data provide strong evidence that the progression of the epidemic has
effectively come to a halt for the past ten years in countries such as Korea (where obesity
rates have stabilised at (3-4%), Switzerland (7-8%), Italy (8-9%), Hungary (17-18%) and
England (22-23%). There is, however, no sign of retrenchment of the epidemic, in any
country. Rates remain very high in most of the countries of OECD and they continue to
experience a large burden from chronic diseases associated with obesity. The prevalence
of obesity today varies nearly tenfold among OECD countries, from a low of 4% in
Japan and Korea, to 30% or more in the United States and Mexico14.
The latest data show modest increases in obesity over the past decade in countries
like Spain and France, in the order of 2-3%, and larger increases in Ireland, Canada and
the United States (4-5%), although an even larger increase had been expected in the
United States, based on previous OECD projections. These findings would seem to
contradict the argument that economic recession might fuel obesity by making people’s
diets less healthy14.
The OECD report also highlighted that severely obese people die 8-10 years
sooner than those of normal-weight, similar to smokers, with every 15 extra kilograms
increasing risk of early death by approximately 30%. Obesity is estimated to be
responsible for 1% to 3% of total health expenditure in most countries (5% to 10% in the
Data from the National Health and Nutrition Examination Survey, 2009–2010 of
US (United States-NCHS) reported that more than one-third of adults which is 37.5% of
adult population (41 million women and 37 million men) and almost 17% of youth were
obese in 2009–2010. Adults aged 60 and over were more likely to be obese than younger
adults. Obesity increases the risk of a number of health conditions including
hypertension, adverse lipid concentrations, and type 2 diabetes16.
Figure: 1.1.9 prevalence of obesity among the adults in US 2009-2010 in the OECD countries
Source: National Health and Nutrition Examination Survey, 2009-2010.National Centre for Health Statistics
Figure: 1.1.10 Estimated percentage of deaths, by cause, in member countries of the South-East Asia Region, 2008
The figure depicts that NCDs accounts for more than half of all death in most
SEAR(South East Asian Region countries)15.
Figure: 1.1.11 Trends in estimated percentage of deaths, by cause, in
South-East Asia Region, 2004 and 2030
Source : World Health Organisation, Global Health Observatory 2011
The figure explains that as per 2004 projection, NCDs deaths may increase up to
70% by 2030.15
Figure: 1.1.12 Estimated percentage of premature deaths (under 60 years of age),
by cause, South-East Asia Region vs rest of the world, 2008
The figure shows that SEAR countries have highest percentage of deaths in all
types as well as overall NCDs deaths under 60 yrs of age when compared with the rest of
the world15.
Figure: 1.1.13 Age-standardized death rates due to non-communicable diseases
(NCDs) per 100 000 population in member countries of SEAR, 2008
Source: World Health Organisation, Global Health Observatory 2011
The figure explains that among the SEAR countries bhutan and bangladesh has
highest death rates and India takes third place with 684.6 deaths15.
Figure: 1.1.14 Proportion of adults overweight in 1980 and 2008 among the
developing and developed world countries
The above figure shows that in the developing world, the number of obese and
overweight adults has quadrupled from 250 million in 1980 to 904 million in 2008. By
contrast, the number of people who were overweight or obese in high-income countries
increased by 1.7 times over the same period47.
India is the second most populous country in the world that comprises 17% of the
world's population and contributes to 16% of the world's deaths. Totally 5% of the Indian
population has been affected by obesity. Nutritional status of the Indian population varies
across the regions, certain regions are associated with extremely high rates of childhood
under nutrition (range from 20% to 80%), whereas others have a high prevalence of adult
under nutrition (>50%), and some have both. However, Indian states are currently facing
the double burden of under nutrition as well as over nutrition17.
Asian countries have the highest burden of diabetes including India and have 33
million cases19. Higher BMI and especially increased abdominal fat clearly is an
important determinant of blood glucose levels, insulin resistance, and the development of
diabetes 20. Intra-abdominal fat accumulation has been implicated as an independent risk
factor for type-2 diabetes mellitus and in some studies it has been shown to be an even
stronger predictor of type-2 diabetes mellitus than overall fatness21. India has diverse
lifestyle pattern and ethnic variations, thus epidemiological profile of diabetes mellitus
may be different in different geographical areas.
Obesity is being recognized as one of the most important risk factors for the
development of hypertension. Several epidemiological studies show that the age-adjusted
so common in Indians is much more clearly related to cardiovascular (C.V.) and
metabolic risk factors than lower body obesity. In our country also many hypertensive
are either overweight or obese
Earlier, developing countries, including India, had focused scarce public health
resources primarily on the high prevalence of under nutrition. However, these nations are
currently facing the double burden of under nutrition as well as over nutrition. Data
regarding the nutritional status of adults, as determined by body mass index (BMI),
indicate that 50% of Indian adults suffer from different types of chronic energy
deficiency, in that they have a BMI<18.5 kg/m 2 . In the same survey, it was observed
that the BMI values were similar in men and women; however, there were more
overweight/obese (BMI≥25 kg/m2) women (6.6%) than men (3.5%). In certain regions, obesity and consequent diseases are posing an enormous public health problem17.
According to the National Family Health Survey (NFHS), the percentage of
ever-married women aged 15-49 years who are overweight or obese increased from 11% in
NFHS- 2 to 15% in NFHS-3. Undernutrition is more prevalent in rural areas, whereas
overweight and obesity are more than three times higher in urban areas. The percentage
of women who are overweight or obese is highest in Punjab (37.5%), followed by Kerala
(34%), Goa (27%), and Tamil Nadu (24.4%) which are relatively richer states18.
In south India the percentage of women who are overweight or obese is highest
in Kerala (34%), followed by Tamil Nadu (24.4%), Andhra Pradesh (22.7%) and
Karnataka (17.3%). List of the states of south India in order of percentage of people who
are associated with an increased burden of diabetes, hypertension, cardiovascular
diseases, some types of cancers and premature mortality but also with the social and
psychological effects of excess weight23.
List of states of India ranked in order of % of people with overweight or obese
States Male (%) Male Rank Female (%) Female Rank
Punjab 30.3 1 37.5 1
Kerala 24.3 2 34.0 2
Goa 20.8 3 27.0 3
Tamil Nadu 19.8 4 24.4 4
Andhra Pradesh 17.6 5 22.7 10
Sikkim 17.3 6 21.0 8
Mizoram 16.9 7 20.3 17
Himachal Pradesh 16.0 8 19.5 12
Maharashtra 15.9 9 18.1 13
Gujarat 15.4 10 17.7 7
Haryana 14.4 11 17.6 6
Karnataka 14.0 12 17.3 9
Manipur 13.4 13 17.1 11
Uttarakhand 11.4 14 14.8 14
Arunachal Pradesh 10.6 15 12.5 19 Uttar Pradesh 9.9 16 12.0 18 Jammu and Kashmir 8.7 17 11.1 5
Bihar 8.5 18 10.5 29
Nagaland 8.4 19 10.2 22
Rajasthan 8.4 20 9.0 20
Meghalaya 8.2 21 8.9 26
Or