0
A
Dissertation
on
“Prevalence of Subclinical Hypothyroidism in patients with
Chronic kidney disease”
Submitted to the
THE TAMILNADU DR. M.G.R. MEDICAL UNIVERSITY
In partial fulfilment of the requirements
For the award of degree of
M.D. (Branch
-XIII)
BIOCHEMISTRY
GOVERNMENT STANLEY MEDICAL
COLLEGE & HOSPITAL
THE TAMILNADU DR. M.G.R. MEDICAL UNIVERSITY,
CHENNAI, TAMILNADU
1
CERTIFICATE
This is to certify that the dissertation titled,
“Prevalence of
Subclinical Hypothyroidism in patients with Chronic kidney
disease”
is a genuine work done by
Dr. J. Siva Somana
,
for the
partial fulfillment of the requirements for M.D. (Biochemistry)
Branch XIII Examination of The Tamil Nadu Dr. M.G.R.
Medical University to be held in April 2016, under the
supervision and the guidance of
Dr. R. MAHALAKSHMI,
M.D, D.C.H, during the academic period 2013-2016.
Dean Professor & HOD
Stanley Medical College & Hospital, Dept. of Biochemistry
Chennai – 1. Stanley Medical College & Hospital,
2
DECLARATION
I,
Dr. J. Siva Somana,
solemnly declare that the
dissertation titled
“Prevalence of Subclinical Hypothyroidism in
patients with Chronic kidney disease”
is a bonafide work done
by me during the period of NOVEMBER 2014 to MAY 2015 at
Government Stanley Medical College and Hospital, Chennai
under the expert guidance of
Dr. R.MAHALAKSHMI, M.D,D.C.H,
Professor and Head, Department Of Biochemistry,
Government Stanley Medical College and Hospital, Chennai.
This thesis is submitted to The Tamil
Nadu Dr. M.G.R. Medical University in partial fulfillment of the
rules and regulations for the M.D. degree examinations in
Biochemistry to be held in April 2016.
Chennai-1
Date: Dr. J. Siva Somana
3
ACKNOWLEDGEMENTS
First and foremost I thank the Almighty. Without Him
nothing would have been possible. With God’s Grace, everything
is possible.
I wish to express my sincere thanks to
Prof. Dr. ISAAC
CHRISTIAN MOSES M.D.,
Dean, Government Stanley
Medical College and Hospital for having permitted me to utilize
the facilities of the hospital for the conduct of the study.
My heartfelt gratitude to
Prof. Dr. R.MAHALAKSHMI,
M.D,D.C.H., Professor and Head, Department of Biochemistry,
Government Stanley Medical College and Hospital for her
motivation, kindness, valuable suggestions, expert supervision,
guidance and constant encouragement which enabled me to
complete this study.
I sincerely thank our Prof. Dr. R. LALITHA M.D., D.A.,
for her inspiration from the beginning of the course with valuable
suggestions and psychological support.
I thank Prof. Dr.M.P.SARAVANAN, M.D.,
for his
valuable guidance and support right from my presentation in
ethical committee.
I thank Associate Prof. Dr.R.SHANTHI M.D., D.C.P., for
her constant encouragement and support.
4
I thank Prof. Dr. Edwin Fernando, M.D., D.M., Professor
and Head of the Department of Nephrology, for permitting me to
conduct the study in Nephrology OPD and also for giving
valuable suggestions regarding my study protocol and corrective
comments.
I wish to thank all Assistant Professors especially for their
aid, keen interest, encouragement and corrective comments
during the research period.
Special thanks are due to my postgraduate colleagues for
never hesitating to lend a helping hand for me throughout the
Study.
I thank all the staffs and technicians, Government Stanley
Medical College and Hospital for their cooperation and
assistance.
I owe my gratitude to all the patients included in the study
and their relatives, for their whole hearted co-operation and
consent.
5
INDEX
S.No Contents
Page. No
1.
Introduction
8
2.
Aims and Objectives
11
3.
Review of Literature
Kidneys – Physiological anatomy
13
Chronic kidney disease
20
Thyroid gland – An overview
22
Kidney in relation with thyroid
26
Subclinical hypothyroidism
27
Review of articles
30
4.
Materials and Methods
39
5.
Statistical Analysis & Results
60
6.
Discussion
83
7.
Summary
88
8.
Conclusion
90
9.
Annexures
i.
Bibliography
92
ii.
Proforma
102
iii.
Consent form
104
iv.
Master chart
107
6
ABBREVIATIONS
CKD - Chronic kidney disease
ESRD - End-stage renal disease
ESRF - End-stage renal failure
TSH - Thyroid stimulating hormone
eGFR - Estimated glomerular filtration rate
MDRD - Modification of the diet in renal disease
PCT - Proximal convoluted tubule
DCT - Distal convoluted tubule
RRT - Renal replacement therapy
TRH - Thyroid releasing hormone
TR - Thyroid receptor
ADH - Anti-diuretic hormone
GLDH - Glutamate dehydrogenase
MW - Molecular weight
IDMS - Isotopic dilution mass spectrophotometry
TPO - Thyroid peroxidase
TPOAbs - Thyroid peroxidase antibodies
EDTA - Ethylene diamine tetraacetic acid
K/DOQI - Kidney Dialysis Outcomes Quality Initiative
TRT - Thyroxine replacement therapy
8
INTRODUCTION
Chronic kidney disease is a worldwide public health problem. CKD is the
12th cause of death and the 17th cause of disability globally. India has witnessed a
sharp rise in the incidence of chronic diseases and mortality during the past few
decades.
1Poor recognition of risk factors and early stages of CKD contributes to
significant morbidity and mortality.
1The data about incidence or prevalence of
ESRF not treated with renal replacement therapy is unknown for lesser degrees of
chronic renal failure. Many patients are undiagnosed or not yet referred. About 30%
of new patients meet a nephrologist for the first time less than 3 months before
dialysis.
2About 6% of the adult population in the United States was found to have
CKD at stages1 and 2 and the proportion of this group progressing to advanced
stages of CKD is not known. About 4.5% of the U.S. population is estimated to
have stages 3 and 4 CKD.
3The estimated prevalence rates of chronic kidney disease and ESRD in India
are 800 and 200 per million inhabitants, respectively.
4In South India, the main
causes of CKD are diabetic nephropathy (29.6%), chronic interstitial nephritis
(20.4%), chronic glomerulonephritis(17.4% ) and hypertensive nephropathy(11%).
5Studies have clearly demonstrated an association between CKD and increased
9
20 fold higher in ESRD patients than the general population after the RRT is
begun.
6Subclinical hypothyroidism, a concept recently developed with the advent of
sensitive TSH assays, is found to be 4 to 10% prevalent in the general population
and the prevalence increases with age and also in females more than 45yrs of age.
7SCH is more common in females, whites and also among people reported to have
increased iodine intake. Patients with overt or subclinical hypothyroidism are also
found to have reduction in renal function.
8,9In the
Third National Health and Nutrition Examination Survey participants,
CKD was found to be associated with a higher prevalence of clinical and subclinical
primary hypothyroidism.
5At present, there is scarcity of Indian data about the
prevalence and the factors associated with subclinical primary hypothyroidism in
persons with CKD on conservative treatment without dialysis.
10Coronary heart disease accompanies both p
rimary overt and subclinical
hypothyroidism because of abnormalities in lipid profile and endothelial
dysfunction. Hence SCH need to be screened to prevent morbidity and
mortality.
11,12According to previous studies, a higher prevalence of thyroid abnormalities in
persons with end-stage renal disease has been demonstrated without much
11
AIM:
To evaluate the prevalence of Subclinical Hypothyroidism in patients with chronic kidney disease.
OBJECTIVES:
1. To estimate TSH and Free T4 levels in Chronic kidney disease patients.
2. To estimate the serum urea and creatinine levels for the patients.
3. To calculate the eGFR and classify the patients with CKD into 5 stages using MDRD Formula.
4. To Study the prevalence of Subclinical Hypothyroidism in patients with Chronic kidney disease.
13
KIDNEYS - PHYSIOLOGICAL ANATOMY:
ANATOMY
Kidneys develop and differentiate from the metanephros and ureteric bud from
mesonephric duct. Kidneys are paired organs located in the retroperitoneal region
opposite to T12 to L3.Each kidney is a bean-shaped structure measuring
approximately 11cm x 6 cm x 3 cm and 120-170 grams in an adult. The kidney is
enclosed in a fibrous capsule. The hilum of the kidney contains renal artery, vein,
lymphatics and pelvis of the ureter. The right kidney is slightly lower than the left as
liver pushes it down. The upper end of ureter expands to form renal pelvis, which in
turns passes through sinus of kidney and becomes continuous with some short,
funnel-like tubes called calyces.
The kidney parenchyma is divided into
an outer cortex (1cm thick) and
an inner medulla.
The medulla contains 10-15 pyramids, which terminates
into renal papilla medially. Renal papilla opens into calyces and then into renal
pelvis.
14STRUCTURE OF A NEPHRON
:
Nephron is the structural and functional unit of kidney. The parts of a
Nephron are
i.
Glomerulus
14
iii.
Proximal convoluted tubule
iv.
Henle’s loop
v.
Distal convoluted tubule
vi.
Collecting tubule.
Bowman’s capsule encloses a tuft of capillaries with fenestrated (
70 to 90nm
in diameter)
endothelial wall called Glomerulus measuring about 200µm in
diameter.
The endothelium of the glomerular capillaries is completely surrounded
by the glomerular basement membrane along with specialized cells called podocytes
with numerous pseudopodia that interdigitate to form filtration slits of 25 nm width
along the capillary wall.
From the glomerulus comes out the PCT and directs into
Henle’s loop, which in turn into distal convoluted tubule. DCT opens into collecting
tubule common for many nephrons. DCT coming close to afferent arteriole gets
15
secreting juxtaglomerular cells constitute the Juxtaglomerular apparatus. Kidneys
are supplied by renal arteries and veins.
14PHYSIOLOGY
Two important functions of the kidneys are
i.
To rid the body of waste materials ingested or produced by metabolism.
ii.
To control the volume and composition of the body fluids.
The balance between intake and output of water and virtually all electrolytes
in the body is largely regulated by the kidneys to maintain the stable internal
environment necessary for the performance of various activities by the cells. The
kidneys filter the plasma and remove substances from the filtrate at different rates,
depending on the needs of the body. Finally the kidneys excrete unwanted
substances in urine and reabsorb needed substances back to blood.
15Glomerular filtration:
Renal blood flow is approximately 20% of the Cardiac Output or
1000ml/min. Glomerular filtration is driven by the hydrostatic pressure gradient
across the glomerular capillary wall in opposition with the Oncotic pressure within
the capillary lumen determined by the concentration of unfiltered plasma proteins.
About 20% of the renal plasma flow is filtered into Bowman’s space. Several
hemodynamic factors contribute to the regulation of filtration under physiologic
conditions. Glomerular filtration is maintained by auto-regulation as a result of three
major factors that modulate afferent or efferent arteriolar tone:
afferent arteriolar constriction mediated by autonomous
16
tubulo-glomerular feedback and
vasoconstriction of the efferent arteriole mediated by angiotensin
II.
4Tubular Function:
In Proximal Convoluted Tubule (PCT), about 65% of H
2O, Na
+, K
+and Cl
-are reabsorbed , 90% of filtered bicarbonate HCO
3-
and also active reabsorption of
glucose & amino acids from the Glomerular filtrate. Secretion of weak acids
(carboxylate anions) and weak bases (mostly primary amine cations) occurs at the
distal part of PCT. In the Loop of Henle, as it is impermeable to H
2O,15- 25% of
filtered NaCl is reabsorbed in the ascending limb selectively leaving the fluid
hypotonic to plasma. Urine is concentrated in this segment by a hypertonic
medullary interstitium, produced by Counter-current multiplication,that promotes
water reabsorption by the collecting duct.
Distal convoluted tubule is impermeable to water and is relatively not
sensitive to aldosterone or ADH. It reabsorbs ~5% of the filtered NaCl and also
calcium.
The cortical part of the collecting duct has the following functions:
Aldosterone dependent Na+ reabsorption (~4–5% of Filtered Na)
K
+and H
+excretion.
ADH dependent reabsorption of water.
Also the kidneys serve many important homeostatic functions:
1.
Excretion of metabolic waste products which include urea, creatinine, uric
17
various hormones and foreign chemicals that are ingested like pesticides,
drugs, and food additives.
2.
Regulation of fluid, electrolyte and acid-base balances.
3.
Regulation of blood pressure.
4.
Regulation of erythropoiesis by Erythropoietin.
5.
Regulation of calcitriol Production.
6.
Secretion, metabolism, and excretion of hormones.
7.
Gluconeogenesis during prolonged fasting competing with that of the liver.
16Renal Function tests
(17,18)I.
Indirect tests-
Serum
Urea,
Creatinine,
Electrolytes,
Total proteins.
Urine
pH,
Osmolality, etc.
II.
Direct tests:
To assess
a.
Glomerular filtration:
GFR
18
i.
Radioisotopic Markers
51Cr-EDTA
99mTc- DTPA scan
Iothalamate
ii.
Nonradioactive compounds
Inulin
Iohexol
2.
Endogenous Markers
Creatinine
Cystatin C
GFR is calculated using the following formulas
i.
Cock-graft and Gault formula,
ii.
MDRD formula using creatinine &
iii.
CKD-EPI formula using cystatin / creatinine.
Clearance studies
b.
Renal Plasma Flow (RPF):
Para-amino hippurate test (PAH).
Filtration fraction
c.
Tubular function – concentration, dilution and excretion function of kidneys
studied.
E.g. PSP excretion test,
Water elimination test, etc.
19
CHRONIC KIDNEY DISEASE
Chronic renal failure is defined as a spectrum of different pathophysiologic processes associated with abnormal kidney function and a permanent (and usually progressive) decline in glomerular filtration rate (GFR).(4,17)
The National Kidney Federation-Kidney Dialysis Outcomes Quality Initiative (K/DOQI) defines CKD as
"Glomerular Filtration Rate (GFR) less than ≤ 60ml/min/1.73m2 that is present for ≥ 3months with or without evidence of kidney damage or evidence of kidney damage with or without decreased GFR that is present for ≥3months as evidenced by microalbuminuria, proteinuria, glomerular hematuria, pathological abnormalities, anatomical abnormalities".1
`
According to American Kidney Foundation, Chronic Kidney Disease is classified into 5 stages based on their eGFR values.
Causes of Chronic Kidney Disease
(4, 16):1.
Diabetic glomerular disease2.
Glomerulonephritis3.
Hypertensive nephropathy4.
Primary glomerulopathy with hypertension5.
Vascular and ischemic renal disease6.
Autosomal dominant polycystic kidney disease7.
Other cystic and tubulo-interstitial nephropathy.20
9.
Obstructive uropathy10.
Dysproteinemias11.
Pregnancy.Pathophysiology:
The pathophysiology of CKD involves two sets of mechanisms of damage: (1) Initiating mechanisms specific to the Underlying etiology and
(2) Progressive mechanisms involving rest of intact nephrons irrespective of underlying etiology.
Endocrine-metabolic disturbances:
16 Elevated Hormone concentrations because of decreased degradation or inappropriate secretion.
21
Disturbances of activation through altered prohormones.
Protein loss leading to altered protein binding in hormones.
Fluid and electrolyte disturbance:
4 Volume expansion & Hyponatremia - glomerulotubular imbalance in sodium homeostasis i.e. dietary sodium >> urinary excretion resulting in sodium retention and consequent expansion of extracellular fluid volume leading to edema, hypertension and congestive heart failure.
Fluid depletion in prerenal fluid losses like gastrointestinal loss because of inability of the kidneys to conserve water.
Hyperkalemia is common due to defective secretion of potassium in the distal nephron leading to fatal arrhythmias.
Hypokalemia due to reduced intake, gastrointestinal losses and overuse of diuretics is very rare.
Other features are
Neuromuscular, Cardiovascular, Pulmonary, Dermatologic, Gastrointestinal, Hematologic and immunological disturbances.
Clinical presentation:
May be
Asymptomatic - high creatinine levels in routine screening as an incidental finding -
Association with diabetes, hypertension.
Symptomatic – non-specific features of CRF - anorexia, lethargy, dyspnea and 5%
of cases landing up in uremia requiring emergency dialysis.
L
22
THYROID GLAND – An overview
ANATOMY
WHARTON was one who named the organ as thyroid ie. oblong shield.19
Thyroid, a butterfly-shaped gland located in the front of the neck just above the trachea, develops from the lower end of the thyroglossal duct as a diverticulum from the pharyngeal floor. The fully developed thyroid gland is composed of two lobes connected by a thin band of tissue, the isthmus, which gives the gland the appearance of a butterfly. Each lobe measures 4 × 2 × 2 cm. The isthmus measures 2 × 2 × 0.5 cm.
The secretory units of the thyroid gland are follicles that contain an outer layer of epithelial cells. The follicular cells rest on a basement membrane and enclose an amorphous material called Colloid, composed mainly of thyroglobulin (an iodinated glycoprotein) and small quantities of iodinated thyro-albumin. Para follicular or C cells located in the interfollicular spaces produce calcitonin, a calcium lowering hormone. Thyroid gland is supplied by Superior and inferior thyroid arteries and veins.14
PHYSIOLOGY
Hypothalamic TRH stimulates pituitary production of TSH from thyrotrophs, which in turn stimulates thyroid hormone synthesis and secretion from the thyrocytes in thyroid gland. A tightly controlled feedback system exists between these glands.
23
form iodinated mono- and di-iodothyronines (MIT, DIT). On coupling, tetra iodothyronines /thyroxine (T4) and triiodothyronines (T3) are formed.4
T3 is formed mainly (more than 80%) from conversion of T4 to T3 by deiodinase
24
The rest is protein bound - mostly bound to thyroxine-binding globulin and a little to transthyretin and albumin. Any change in the concentration of the proteins will cause changes only in the total thyroid hormones. The half-lives of T4 and T3 are 7 days and 24hrs respectively. Deiodinases are of three types and they have a seleno-cysteine moiety at their active site. Type 1 DI is present in liver, kidney, thyroid, and brain.
Circulating thyroid hormones enter target cells by passive diffusion and via specific transporters such as the monocarboxylate 8 (MCT8) transporters. Thyroid hormones bind with high affinity to nuclear thyroid hormone receptors (TRs) α and β. The TRs contain a central DNA-binding domain and a C-terminal ligand-binding domain.
25
Thyroid function tests
i. Assay of thyroid hormones –
Total T3,
Total T4,
Free T4
Free T3
Reverse T3 TSH levels
ii. Radioiodine 131I uptake studies iii. Perchlorate discharge test iv. Thyroid antibodies –
TPO antibodies,
Antithyroglobulin antibodies,
Thyroid microsomal antibodies,
TSH receptor antibodies,
Thyroid stimulating immunoglobulins.
v. Thyroid Ultrasound
vi. Fine needle aspiration cytology of thyroid (FNAC) vii. Indirect tests based on their metabolic functions
Serum cholesterol level
Serum creatine level
Serum uric acid
26
Kidney in relation with thyroid:
Functions of Kidney and thyroid are interrelated through several mechanisms.
Kidneys are responsible for the metabolism of thyroid hormones. They play an
important role in the diurnal rhythm, glycosylation of TSH and the clearance rates of
TSH and TRH.(20,21)
Thyroid hormones are necessary for the maintenance of electrolyte and water
homeostasis -
directly by affecting the glomerular filtration rate, tubular secretory and
reabsorptive processes, as well as the hormonal influences on renal tubular
physiology due to β1receptors in JG cells in kidney.
indirectly by affecting the cardiovascular system and the renal blood flow
(Chronotropic & Inotropic effect on heart due to β1-adrenergic receptors and
27
SUBCLINICAL HYPOTHYROIDISM
With the advent of newer generation TSH assays, patients with even very
little symptoms of abnormal thyroid function were biochemically defined as
subclinical primary hypothyroidism based on their elevated serum thyrotropin
(TSH) levels but normal free thyroxine (FT
4) levels.
(13,23,24)Definition:
Subclinical hypothyroidism (SCH) is diagnosed when the serum thyroid
stimulating hormone (TSH) level is high but less than 10mIU/ml but the
corresponding serum free thyroxine (fT
4) level are within normal limits.
5Etiology:
Subclinical primary hypothyroidism is suspected to be mostly due to chronic
autoimmune thyroiditis, characterized by a mild asymptomatic goiter and high titer
of serum thyroid autoantibodies.
(10,25)Other less common causes of include
drug-induced hypothyroidism, subacute thyroiditis, radiation thyroiditis, and postpartum
thyroiditis.
(10,26)Pathophysiology of SCH in CKD patients:
Chronic renal failure affects thyroid function in multiple ways, including low
thyroid hormone levels, altered peripheral hormone metabolism, reduction in serum
total proteins and albumin and thereby decreased binding and transport.
(27,28)There
is reduction in iodide excretion resulting in increased serum inorganic iodide level
and the iodine content of thyroid gland thereby leading to goiter because of
28
CKD patients have low T
3and normal or reduced T
4levels, and
consequently elevated TSH leading to an increase in thyroid gland volume due to
the physiological adaptation of the body to reduce the protein nitrogen turnover,
reduce the protein catabolism and nitrogenous waste.
(31-33)
Thyroid hormone metabolism is affected as a result of retention of urine,
decreased degradation resulting in abnormal regulation. Fasting, chronic metabolic
acidosis and chronic protein malnutrition affect de-iodination, protein binding and
also peripheral conversion of thyroid hormones.
29 CKD Hypothalamo-pituitary axis Normal TRH Uraemia causes a blunted and delayed response of TSH receptors Normal TSH with altered circadian rhythm and glcosylationNormal or low T4
Monodeiodinase reaction occurs
on the inner benzene ring of
T4 leading to formation of reverse T3, rT4 serum levels will
remain norrmal as it moves into intracellular and extracellular spaces Decreased GFR decreased clearance of inflammatory cytokines like TNF α and
IL-1 Inhibited expression of type 1 5'deiodinase Decreased peripheral conversion of T4
29
Clinical significance:
Subclinical primary hypothyroidism is also found to be associated with
cardiovascular impairment. Even small variations in serum TSH levels produce
adverse effects on cardiovascular performance by altering the diastolic and systolic
cardiac function and accelerating atherosclerosis in the general population.
(34-36Subclinical primary hypothyroidism has been found to predict mortality in
chronic dialysis and also nephropathy in diabetic patients.
(12, 37, 38)Subclinical
primary hypothyroidism will land up in clinically
overt hypothyroidism with time
and thereby leading to hemodynamic and vascular changes in the kidney worsening
CKD into ESRD earlier.
34Evidence regarding the prevalence of subclinical primary hypothyroidism at
30
REVIEW OF ARTICLES
1.
Connie M Rhee et al
Nephrol Dial Transplant 2015
Feb21; 30(2):282-7. Sep
2014
The authors examined the association between kidney function and
hypothyroidism among CKD patients between stages 3 and 5 between October 2004
and September 2006 by eGFR using the CKD-EPI formula and serum TSH levels. For
every 10 mL/min/1.73m
2lower eGFR, they observed an 18% higher risk of
hypothyroidism and a 0.11 mIU/L higher serum TSH levels.
In patients with moderate
to severe CKD, the authors found an inverse association between eGFR and the risk of
hypothyroidism.
402.
Rucsandra Danciulescu Miulescu
et al Rom J Diabetes Nutr Metab Dis 2014.
21(1):3-42
The authors conducted a study in patients with diabetes mellitus and CKD in
the pre-dialysis phase to know the associations between thyroid dysfunction and
chronic kidney disease by measuring serum T
3, freeT
4, TSH and TPO antibodies.
There is higher prevalence of abnormalities in morphology and function of thyroid
gland in the diabetic patients with CKD.
413.
Yuji Hataya et al
Clinical and Experimental Nephrology
August 2013, Volume
17, Issue 4, pp 525-531
The authors conducted a retrospective study on 51 Japanese patients with
31
primary hypothyroidism. There was a rapid increase in the eGFR during the
first
6 months after THRT in CKD patents more so in the lower initial eGFR group with
mild to moderate hypothyroidism compared to that in non-CKD patients.
They
concluded that hypothyroidism has contribution to the reduction in eGFR and
appropriate THRT should be started if needed.
424.
Bamini Gopinath et al Maturitas 75 (2013) 159– 164
The authors studied
the
relationship between thyroid dysfunction and chronic
kidney disease in adults more than 60yrs.Even very low level of thyroid deficiency
with serum Thyrotropin levels in the upper limit of the normal range could be
associated with higher grades of renal dysfunction and CKD without the influence
of age, diabetes and hypertension. Subclinical and overt hypothyroidism have a
CKD prevalence of 33.9% and 27.8% respectively suggesting an increased
likelihood of impaired renal function
435.
Shin DH et al PMID:23281965 Thyroid.2013 Jan 2
The authors compared clinical and biochemical parameters at various time
points for 113 CKD patients with SCH who were treated with L-thyroxine and
eGFR calculated for at least 24 months before and after THRT between January
2005 and December 2011.
TSH levels were significantly reduced without any
significant changes in T3 and fT4 concentrations after THRT.
They concluded that
THRT attenuated the rate of decline in eGFR and it may even delay the progression
32
6.
Jaime E Villena et al (2013)
The authors conducted a study to investigate the prevalence of thyroid
dysfunction in Peruvian patients with CKD not undergoing dialysis and those
without any known previous thyroid disease. Their serum TSH (IRMA), free T
4(RIA), total T
3(RIA), TPO antibodies (RIA) and iodine urinary excretion were
measured. High TSH value leads to low fT4 and increased goiter independent of
age, sex, TPO antibodies, BMI, T
3, fT
4. They concluded that 53.5% had thyroid
hormone abnormalities. Of these, 32.5% have increased TSH, 16.5% have Low
thyroid hormones with normal TSH and 15.9% were with Thyroid autoimmunity.
457.
Gopal Basu et al Indian Journal of Endocrinology and Metabolism 2012 | Vol
16 | Page: 204—213
A search for articles using PubMed done by the authors and they compiled
the data to represent information from the best available form of evidence in the
field of Interactions between thyroid disorders and kidney disease. Chronic kidney
disease (CKD) is characterized by a low T
3syndrome and also have an increased
incidence of primary hypothyroidism and subclinical hypothyroidism. The
physiological benefits of a hypothyroid state in CKD and the risk of CKD
progression with hyperthyroidism emphasize on a conservative approach in the
33
8.
Arif S Malik et al Iraqi J Med SCI, 2011
The author evaluated the thyroid function in patients with Chronic Kidney
Disease by conducting a study including 3 groups namely: Group I - end stage renal
disease patients undergoing regular hemodialysis, Group II - chronic renal failure
patients treated conservatively and Group III - 21 healthy volunteers in
AL-Kadhimiya Teaching Hospital in Baghdad. He didn’t find any significant alterations
in TSH levels between the uremic patients and the control group and also they were
within the normal range. This normal TSH values in clinically euthyroid patients
with chronic renal failure may indicate functional euthyroid status.
479.
Ghanshyam Palamaner Subash et al Cardiorenal Med 2011
The authors conducted a cross sectional study of Prevalence of Subclinical
Hypothyroidism in Patients with End-Stage Renal Disease in tertiary-care centers
in Chennai, India, comprising 137 patients with ESRD undergoing regular
maintenance hemodialysis over 3-years. Free thyroxine (fT4) and
thyroid-stimulating hormone (TSH) were measured using ECLIA. They observed high
prevalence of Subclinical hypothyroidism in ESRD patients.
4810.
Selma Jusufovic et al Mat Soc Med, 2011
The authors conducted a prospective study for 12 months including 80
participants - 40 stable patients on chronic hemodialysis program divided into
34
40 healthy controls. Patients on Chronic Hemodialysis more commonly have
Functional Thyroid Disorders Compared with the General Population.
4911.
Ali A. Allawi et al (2010-11)
The author conducted a cross sectional study on the prevalence of
hypothyroidism and abnormalities of thyroid gland in patients with chronic kidney
disease at different levels of estimated glomerular filtration rate (eGFR) and their
association with age, sex and duration of chronic renal failure among Iraqi Patients
in October 2010 to March 2011.Reduced GFR was associated with an increased
prevalence of hypothyroidism with more subclinical cases.
5012.
P Iglesias et al European Journal of Endocrinology (2009)
The authors studied about Thyroid dysfunction and kidney disease.
Hypothyroidism is accompanied by a low GFR, hyponatremia, and an alteration in
water excretion. Increased levels of Thyroid hormones generate an increase in GFR
and RPF. Also there are significant changes in thyroid function in renal disease.
1313.
Michel Chonchol et al Clin J Am Soc Nephrol. Sep 2008
The authors performed a cross-sectional analysis on the database of the LIS
of the Clinical Chemistry Laboratory at the Verona University Hospital to retrieve
thyroid function and other tests, which have been performed on 3233 outpatient
adults ≥18 years of age for routine blood testing from 2005 to 2007. Subclinical
35
chronic dialysis when compared with persons having normal kidney function
attending OP.
3314.
Amato et al
Current Opinion in Endocrinology, Diabetes and Obesity October
2008
The authors briefly discussed about the effects of uremia on thyroid hormone
metabolism. Thyroid hormone resistance is due to Uremic toxins interfering at
various levels like hormone transport, receptor activity, etc. The pathogenesis of
thyroid axis abnormalities due to uremia and its clinical significance remains
unclear.
5115.
Jan G. Den Hollander et al wiley online library April 2005
The authors conducted a study to determine the relationship between renal
function and thyroid status before and after regaining euthyroidism in 37
hypothyroid and 14 hyperthyroid patients. A strong correlation exists between the
change in thyroid status and the renal function expressed as serum creatinine
followed by treatment. Renal function improved significantly during treatment of
hypothyroidism and hyperthyroidism.
5216.
Lo JC et al Kidney International, Vol. 67 (2005)
The authors used data from a Health Survey to examine the prevalence of
hypothyroidism at different levels of eGFR. Prevalence of hypothyroidism was
36
<
60mL/min/ 1.73m
2. 70% of CKD patients with hypothyroidism were aged
>70years suggesting a strong association among older age, hypothyroidism and
CKD. Reduced GFR had an increased risk of hypothyroidism after making
adjustments for age, gender & race.
2417.
Dong Ho Shin et al (2012)
The authors conducted a study to investigate the effect of thyroid hormone
therapy on the changes in eGFR in patients with CKD stage 2–4 with subclinical
hypothyroidism by comparing between patients on and without THRT. They
included 309 patients in their study. Of these 180 (58.3%) belong to thyroid
hormone treatment group and 129 (41.7%) belong to non-treatment group. The rate
of fall in eGFR was higher among the non-treatment group. They found that THRT
was an independent predictor of renal outcome in chronic kidney disease patients
with subclinical hypothyroidism.
5318.
Kaptein EM et al Endocr Rev. 1996
The author studied thyroid hormone metabolism and thyroid diseases in
chronic renal failure. Without any concurrent thyroid disease, multiple alterations of
thyroid hormone metabolism including elevated basal TSH values greater than
10mIU/liter, altered TSH response to TRH, alterations in diurnal rhythm & TSH
37
19.
Mehta HJ et al J Postgrad Med 1991
The authors in their study included 127 varying grades of CRF patients with
no previous history of thyroid dysfunction and categorized them as those on
conservative treatment and those who had severe renal failure undergoing regular
hemodialysis awaiting a live related donor renal transplantation to compare with
normal people. Low TT
3, FT
3and TT
4values reported in clinically euthyroid CRF
patients. FT
4would fall with rise in TSH and hence these values can be used in CRF
patients for diagnosing hypothyroidism.
5520.
Kapstein et al Kidney Int Suppl, 1983 Dec;16;S180-6
The authors studied the variation in serum rT3 and thyroxine kinetics
because of nutritional status, uremia, duration of illness, etc. in end stage CRF
patients receiving dialysis and compared with patients having non-thyroid illness
without renal pathology. They showed normal rT3, total and free T
4levels in CKD
patients. They found that the T
4kinetics was similar in both CRF and non-renal
patients.
5621.
David A. Spector et al Ann Intern Med. 1976
The author conducted studies of thyroid function and metabolic status in
patients with chronic renal insufficiency undergoing dialysis. All patients were
euthyroid. Metabolic testing was similar in patients with low and normal serum T
338
metabolic status in CKD, whereas serum free T
4and TSH concentrations were
reliable indicators of thyroid state.
5722.
Ramirez et al Ann Intern Med. June,1976
The authors conducted a study on thyroid dysfunction in uremia among CKD
patients on and not on dialysis and compared them with normal control groups.
They found that both groups of renal failure patients have decreased T
4and TSH
40
MATERIALS AND METHODS
Study Centre:
Nephrology clinic, Govt. Stanley Hospital, Chennai-1.
Duration of the study:
6 months (Dec 2014 to May 2015)
Study Design:
Analytical study
Study Population: Controls:
50 apparently normal healthy persons aged more than 20 years, who came for regular Master Health checkup are included as controls in this study.
Cases:
50 patients diagnosed to have CKD are enrolled in this study.
Case definition:
The K/DOQI defines CKD as patients with GFR less than ≤60ml/min/1.73m2 of ≥3months duration with or without evidence of kidney damage like
microalbuminuria, proteinuria, glomerular hematuria, pathological abnormalities, anatomical abnormalities
Inclusion criteria:
Diagnosed cases of CKD.
aged more than 20 years
Duration of illness more than 6 months
41
Predialysis phase
Patients giving consent for the study.
Exclusion criteria:
Patients declining the consent
Patients undergoing dialysis.
With visible goiter,
Patients with known thyroid disorders and on treatment,
Patients taking drugs like estrogen, steroids, sulphonyl ureas, β-blockers,
Patients exposed to contrast dyes,
pregnancy
children
Sample Collection and Preparation:
After getting informed consent from the patients, fasting morning blood sample was collected under strict aseptic precautions in red topped clot-activator venipuncture tubes. Blood was allowed to clot. After centrifugation at 2000-2500 rpm for I5 minutes, Serum samples were separated immediately from the cells and stored at -20ºC in deep freezer.
Study population was examined and the following tests were done in the serum,
i. Urea ii. Creatinine iii. Total protein iv. TSH
42
vi. eGFR calculated using MDRD formula and patients were classified into 5 stages.
According to American Kidney Foundation, Staging of Chronic Kidney Disease is done as follows: 4
Stages
GFR ml/min
0
> 90
aI
≥ 90
bII
60-89
III
30-59
IV
15-29
V
< 15
a - With risk factors for CKD.
b - With demonstrated kidney damage.
ESTIMATION OF BLOOD UREA:
Method: Urease coupled with glutamate dehydrogenase method.
Test principle
Urea is hydrolyzed by Urease to form ammonium and carbonate ions. Urea + 2 H2O urease 2 NH4+ + CO3
In the second reaction 2-oxoglutarate reacts with ammonium ion in the presence of glutamate dehydrogenase (GLDH) and the coenzyme NADH to produce L-glutamate.
In this reaction two moles of NADH are oxidized to NAD+ for each mole of urea hydrolyzed.
43
The rate of decrease in the NADH concentration is directly proportional to the urea concentration in the specimen and is measured photometrically at 340 nm.
REAGENTS COMPOSITION:
R1 TRIS buffer: 50mmol/L, pH 8.0; 2-oxoglutarate: 15mmol/L; Urease (jack bean): ≥1000 IU/L
GLDH (bovine liver): ≥ 6000 IU/L
R2 NADH 0.18mmol/L
SYSTEM PARAMETERS
Mode of reaction Fixed time kinetic
Slope of reaction Decreasing
Wavelength I 340nm
Temperature 37ºC
Standard concentration 50mg/dl
Linearity 300mg/dl
Blank Absorbance >0.8
Delay/lag Time 30 seconds
Interval time 60 seconds
No. of readings 1
Sample volume 10µl
Reagent volume 1000µl
cuvette 1cm light path
Low normal at 37ºC 15mg/dl
44
LABORATORY PROCEDURE:
Standard Sample
Standard 10 µl -
Sample - 10 µl
Reagent 1000 µl 1000 µl
Mix well and read after 30secs (initial absorbance of sample A1s and standard A1std) and read again after 60secs (A2s and A2std).
Tests are assayed on Beckman Coulter AU 480 autoanalyser after calibration. CALCULATION:
𝑈𝑟𝑒𝑎 𝑚𝑔/𝑑𝐿 = 𝐴2𝑠𝑡𝑑 − 𝐴1𝑠𝑡𝑑𝐴2𝑠 – 𝐴1𝑠 × 50𝑚𝑔/𝑑𝐿
Reference intervals
18:
Plasma or serum
Healthy adults - 6 to 20mgIdL Adults > 60 years of age - 8 to 23mgldL Untreated ESRD -108 to 135mgldL Urine, 24hrs -12–20 g/day
ESTIMATION OF SERUM CREATININE: Method: Creatininase method
PRINCIPLE
Steps catalyzed by
45
Creatinine + H2O Creatine
Creatine + H2OSarcosine + Urea
ii. Sarcosine oxidase
Sarcosine + H2O + O2 Glycine + HCHO + H2O2 iii. Peroxidase
2H2O2 +4-aminoantipyrine+TOPS* QuinoneimineDye+4H2O
* TOPS: N-Ethyl-N-sulfopropyl-m-toluidine
REAGENT COMPOSITION Reagent 1
Creatininase 1,75,000 IU/L Sarcosine oxidase 15,000 IU/L TOPS 1.13mM
Reagent 2
Creatininase 75,000 IU/L Peroxidase 4,500 IU/L 4-Aminoantipyrine 0.75mM
SYSTEM PARAMETERS
Mode of reaction End point
Slope of reaction Increasing
cuvette 1cm light path
Wavelength I 546nm
Wavelength II 630 nm
46
Standard concentration 2mg/dl
Reagent 1volume 450µl
Reagent 2 volume 150µl
Incubation time 10min
Linearity 200mg/dl
LABORATORY PROCEDURE:
Blank Calibrator Sample
Reagent 1 450 µl 450 µl 450 µl
Calibrator - 10 µl -
Sample - - 10 µl
Mix and incubate at 37ºC
Reagent 2 150 µl 150 µl 150 µl
Mix and incubate at 37ºC .Measure the absorbance of sample and the standard against the reagent blank
Tests are assayed on Beckman Coulter AU480 auto analyzer after calibration using IDMS reference calibrator.
CALCULATION:
47
Reference intervals:
Adults Plasma or serum
Male 0.9 -1.3 mg/dl
Female 0.6 - 1.1 mg/dl
Child 0.3 - 0.7 mg/dl Adults Urine 24hrs
Male 800 - 2,000 mg/day
Female 600 - 1,800 mg/day
48
Standardization of creatinine with enzymatic kit:
CALCULATION OF eGFR
Kidney function was calculated by using the formula: Modification of Diet in Renal Disease Formula (MDRD)
ESTIMATED GFR
eGFR (mL/min per 1.73 m
2)=1.86×(PCr)
-1.154×(age)
-0.203Multiply by 0.742 for women
-0.05 0 0.05 0.1 0.15 0.2 0.25
0 2 4 6 8 10 12
A
b
sor
b
an
ce
Creatinine Concentration mg/dl
49
ESTIMATION OF SERUM TOTAL PROTEIN:
Method: Biuret method
Principle:
Proteins react with cuprous ions in alkaline medium to form purple colored complex due to the presence of peptide bonds. The intensity of the color is directly proportional to the amount of total proteins present in the serum sample.
REAGENT COMPOSITION:
Biuret reagent:
Copper sulphate: 3g/L
Sodium potassium tartrate: 9 g/L
Potassium iodide: 5g/L
Sodium hydroxide: 100ml of 6mol/L NaOH per liter.
SYSTEM PARAMETERS:
Mode of reaction End point
Slope of the reaction Increasing
cuvette 1cm light path
Wavelength 540nm
Temperature 37ºC
Standard concentration 6g/dl
Blank Absorbance >0.8
50
Reagent volume 1000µl
Incubation time 10 min
Low normal at 37ºC 6.6g/dl
High normal at 37ºC 8.3g/dl
Linearity 10g/dl
LABORATORY PROCEDURE:
Blank Calibrator Sample
Reagent 1000 µl 1000 µl 1000 µl
Standard - 20 µl -
Sample - - 20 µl
Mix and incubate at 37ºC .Measure the absorbance of sample and the standard against the reagent blank at 540nm.
CALCULATION:
Protein g/dL =
Absorbance of sampleAbsorbance of standard
× std conc.
g/dL
DETERMINATION OF SERUM TSH:
- Sandwich type of Immunoenzymometric Assay
PRINCIPLE:
Microplate Immunoenzymometric assay:
51
reaction takes place between the antibodies and the native antigen to form a sandwich complex attached to the wells of microtitre plate because of streptavidin-biotin interaction on the surface of the wells. Antibody bound fraction is separated from unbound antigen by decantation, after equilibrium is attained. The enzyme activity in the antibody bound fraction is directly proportional to native antigen concentration.
EnzAb+ AgTSH+ BtnAbEnzAb-AgTSH- BtnAb
Where,
Btn
Ab - biotinylated monoclonal antibody AgTSH- native antigen (TSH)
EnzAb– Enzyme polyclonal antibody
EnzAb-AgTSH- BtnAb - Sandwich complex
REAGENTS:
1. Human serum based Thyrotropin calibrators of concentrations- 0.0, 0.5, 2.5, 5, 10, 20, 40 mIU/ ml of Icons A to G 1ml/vial.
2. TSH enzyme conjugate Reagent: 13ml/vial. Enzyme labelled affinity purified polyclonal goat antibody, biotinylated mouse antibody in buffer, dye and in preservative.
3. Streptavidin coated plate – 96 well microtitre plate coated with Streptavidin
4. Wash concentrate solution (20ml/vial): surfactant in buffered saline with a preservative. Wash buffer is prepared by mixing wash concentrate with distilled water in the ratio 1:50.
52
6. Substrate B (7ml/vial) –Hydrogen peroxide in buffer. Working substrate solution is prepared by mixing equal volumes of both substrates.
7. Stop solution (8ml/vial) – containing strong acid (1N HCl)
TEST PROCEDURE:
1.
All the reagents are brought to room temperature (20-27ºC)2.
Each microplate’s well is formatted to serum reference, control and patient’s specimen to be assayed in duplicate.3.
50µl of the appropriate serum reference, control specimens are pipetted into the assigned well.4.
100 µl of TSH Enzyme reagent is added to each well.5.
The microtitre plate swirled gently for 20-30 seconds to mix and the plate is covered.6.
The plate is incubated for 60min at room temperature.7.
The microtitre plate is washed with wash buffer prepared by 1 in 50 dilution with distilled water using ELISA washer set for 3washes with 350 µl buffer per well each time.8.
Plate is tapped and blotted and any persistent air bubble is aspirated with micropipette.9.
100 µl of working substrate solution is added to all wells.10.
Plate is left undisturbed for incubation for 15min without shaking.11.
50 µl of stop solution is added to all wells and mixed well for 20-30seconds.53
ELISA Washer
ELISA microplate Reader
CALCULATION OF RESULTS:
A dose response curve is used to find the concentration of TSH in unknown specimens.
54
2.Absorbance for the serum reference versus the TSH concentration in mIU/ml is plotted in a linear graph paper
3.A best fitting curve is drawn connecting the points.
4.The concentration for an unknown is determined by locating the average absorbance of the duplicates for each unknown on the vertical axis of the graph, finding the intersecting point on the curve and thereby reading the concentration in mIU/ml from the horizontal axis of the graph.
QC PARAMETERS:
The criteria for the assay to be valid are
1. The absorbance of the calibrator 40mIU/ml is >1.3.
2. Quality control pool values are within the established ranges.
REFERENCE RANGE:
Child
Birth to 4 days: 1 - 39 mIU/ml
Adults : 0.4 - 4.2 mIU/ml
Pregnancy
55
TSH CALIBRATORS AND THEIR ABSORBANCE:
DETERMINATION OF SERUM FREE T4:
56
PRINCIPLE:
Upon mixing immobilized antibody, competition results between the enzyme-antigen conjugate and the native free enzyme-antigen for a limited number of insolubilized binding sites. The reaction is as follows:
EnzAg+ Ag + Abc.wAgAbc.w+ EnzAgAbc.w Where,
Abc.w - monospecific immobilized antibody (Constant quantity)
Ag - Native antigen
EnzAg - Enzyme-antigen conjugate
AgAbc.w - Antigen-Antibody conjugate
EnzAgAbc.w - Enzyme-Antigen conjugate-Antibody complex.
After equilibrium is attained, the antibody bound fraction is separated from unbound fraction by decantation or aspiration. The enzyme activity in the antibody-bound fraction is inversely proportional to the native free antigen concentration.
REAGENTS:
1.
Human serum based fT4 calibrators of concentrations- 0.0, 0.3, 0.8, 1.9, 3.4, 7.9 ng/dL ofIcons A to F 1ml/vial.
2.
fT4 enzyme conjugate Reagent: 13ml/vial. Thyroxine-horseradish peroxidase conjugatein a protein stabilized matrix.
3.
fT4 antibody coated plate – 96 well microtitre plate coated with anti-thyroxine serum.4.
Wash concentrate solution (20ml/vial): surfactant in buffered saline with apreservative.Wash buffer is prepared by mixing wash concentrate with distilled water in the ratio 1:50.
57
6.
Substrate B (7ml/vial) –Hydrogen peroxide in buffer.Working substrate solution isprepared by mixing equal volumes of both substrates.
7.
Stop solution (8ml/vial) – containing strong acid (1N HCL)TEST PROCEDURE:
1.
All the reagents are brought to room temperature (20-27ºC)2.
Each microplate’s well is formatted to serum reference, control and patient’s specimen to be assayed in duplicate.3.
50µl of the appropriate serum reference, control specimens are pipetted into the assigned well.4.
100 µl of fT4 Enzyme conjugate reagent is added to each well.5.
The microtitre plate swirled gently for 20-30 seconds to mix and the plate is covered.6.
The plate is incubated for 60min at room temperature.7.
The microtitre plate is washed with wash buffer prepared by 1 in 50 dilution with distilled water using ELISA washer set for 3washes with 350 µl buffer per well each time.8.
Plate is tapped and blotted and any persistent air bubble is aspirated with micropipette.9.
100 µl of working substrate solution is added to all wells.10.
Plate is left undisturbed for incubation for 15min without shaking.11.
50 µl of stop solution is added to all wells and mixed well for 20-30seconds.58
CALCULATION OF RESULTS:
A dose response curve is used to find the concentration of TSH in unknown specimens.
1.Absorbance obtained from the microplate reader is recorded.
2.Absorbance for the serum reference versus the free T4 concentration in ng/dL is plotted in a linear graph paper
3.A best fitting curve is drawn connecting the points.
4.The concentration for an unknown is determined by locating the average absorbance of the duplicates for each unknown on the vertical axis of the graph, finding the intersecting point on the curve and thereby reading the concentration in ng/dL from the horizontal axis of the graph.
5.The concentration for an unknown is determined by locating the average absorbance of the duplicates for each unknown on the vertical axis of the graph, finding the intersecting point on the curve and thereby reading the concentration in mIU/ml from the horizontal axis of the graph.
REFERENCE RANGE: Free T4:
Newborn 2.2 - 5.3 ng/dL
Children 0.8 – 2 ng/dL
Adult 0.8 - 1.8 ng/dL
Pregnancy I trimester 0.7 - 2 ng/dL
59
61
STATISTICAL ANALYSIS AND RESULTS
Results of clinical and hormonal assessment of thyroid
dysfunction obtained in patients with chronic kidney disease were compared with
those of the control group by statistical analysis using Excel software. Students
unpaired ‘t’ test is used to compare the means between two independent groups.
F
test is applied between the study variables to know whether ‘t’ test can be applied to
study the parameters and also which type of ‘t’ test –either equal variance or
separate variance unpaired ‘t’ test can be applied in this study.
Pearson coefficient
of correlation is used to estimate the degree of association between two quantitative
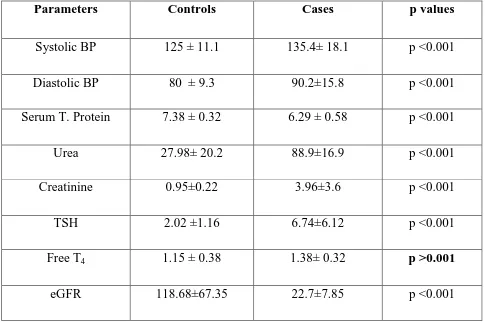
[image:62.595.60.545.433.755.2]variables. A p-value of <0.001 will be considered as statistically significant.
TABLE.1 BASELINE CHARACTERISTICS OF THE STUDY POPULATION:
Parameters Controls Cases p values
Systolic BP 125 ± 11.1 135.4± 18.1 p <0.001
Diastolic BP 80 ± 9.3 90.2±15.8 p <0.001
Serum T. Protein 7.38 ± 0.32 6.29 ± 0.58 p <0.001
Urea 27.98± 20.2 88.9±16.9 p <0.001
Creatinine 0.95±0.22 3.96±3.6 p <0.001
TSH 2.02 ±1.16 6.74±6.12 p <0.001
Free T4 1.15 ± 0.38 1.38± 0.32 p >0.001
62
Graph.1 Comparison of urea, BP and eGFR values between cases and controls:
Graph.2 Comparison of Creatinine, TSH, fT4 and total protein values between
cases and controls:
0 20 40 60 80 100 120 140 e GFR (ml/min)
Urea (mg/dl) Systolic BP (mmHg)
Diastolic BP(mmHg)
Comparison of urea,blood pressure
and eGFR values between cases and
controls
controls cases 0 1 2 3 4 5 6 7 8 creatinine (mg/dl)TSH (mIU/ml) fT4(ng/dl) Serum T. Protein(g/dl)
Comparison of Creatinine, TSH,
fT4
and total protein values between
cases and controls
63
TABLE:1 & Graph.1 & 2
shows the Comparison of study variables between
cases and controls. The data suggests that there exists significant difference in TSH,
[image:64.595.67.540.205.461.2]Urea, Creatinine, SBP, DBP, total protein and eGFR values except free T
4.
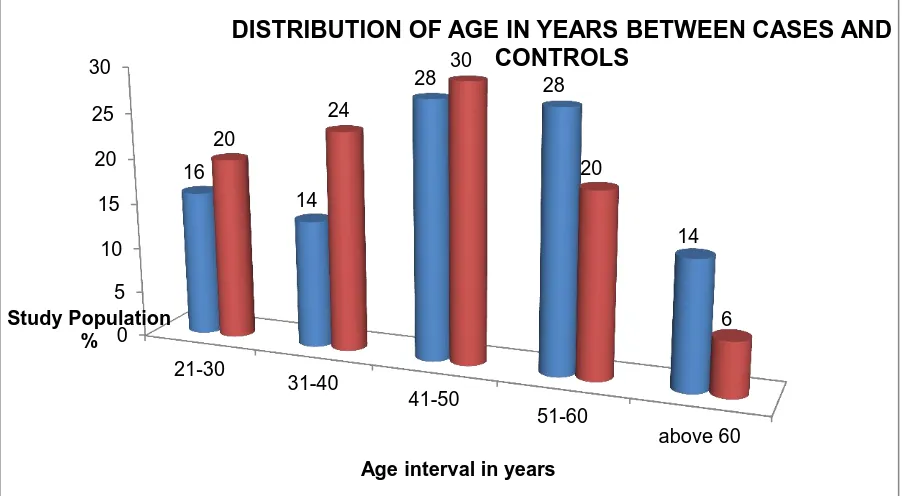
Table.2 Distribution of age in years between cases and controls:
Age interval (years)
Cases Controls
No. % No. %
21-30 8 16 10 20
31-40 7 14 12 24
41-50 14 28 15 30
51-60 14 28 10 20
Above 60 7 14 3 6
Total 50 100 50 100
Graph.3 Distribution of age in years between cases and controls
0 5 10 15 20 25 30 21-30 31-40 41-50 51-60 above 60 16 14
28 28
14 20 24 30 20 6 Study Population %
Age interval in years
[image:64.595.72.523.533.781.2]64
[image:65.595.66.537.173.582.2]Table.2& Graph.3 shows the age distribution between cases and controls selected for the study. More or less equal number of cases and controls are selected from each age group.
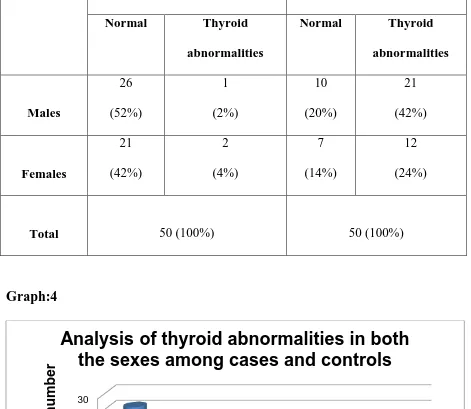
Table.3 Analysis of thyroid abnormalities in both the sexes
Controls Cases
Normal Thyroid abnormalities
Normal Thyroid abnormalities Males 26 (52%) 1 (2%) 10 (20%) 21 (42%) Females 21 (42%) 2 (4%) 7 (14%) 12 (24%)
Total 50 (100%) 50 (100%)
Graph:4
Table.3 & Graph:4 explains the distribution of thyroid abnormalities in both the sexes among cases and controls. Thyroid abnormalities are 42% in males and 24% in females .
0 5 10 15 20 25 30 Normal Thyroid abnormalities Normal Thyroid abnormalities Males Females
Controls 26 1 21 2
Cases 10 21 7 12
Stu
d
y
p
o
p
u
lati
o
n
n
u
mb
er
[image:65.595.77.534.499.743.2]65
Table.4 Correlation of thyroid abnormalities with the Duration of illness in the CKD patients:
Duration of CKD No. of Patients
Normal thyroid function
Thyroid abnormalities
< 1yr
7
2 (4%)
5 (10%)
1-2yr
21
11 (22%)
10 (20%)
2-3 yr
6
1 (2%)
5 (10%)
3-4 yr
6
1 (2%)
5 (10%)
4- 5 yr
4
1 (2%)
3 (6%)
>5 yr
6
1 (2%)
5 (10%)
Total
50
17(34%)
33(66%)
Graph.5 0 2 4 6 8 10 12
< 1yr 1-2yr 2-3 yr 3-4 yr 4- 5 yr >5 yr
Stu
d
y
p
o
p
u
lati
o
n
i
n
n
u
mb
er
s
Duration of CKD in years
Correlation of Thyroid abnormalities with
the duration of CKD
66
Table.4& Graph.5
categorizes the patients based on the duration of illness in
the CKD patients. Most of the patients selected for study have their duration
of illness between 1-2years. Prevalence of thyroid abnormalities increases as
the duration of CKD increases.
Graph.6
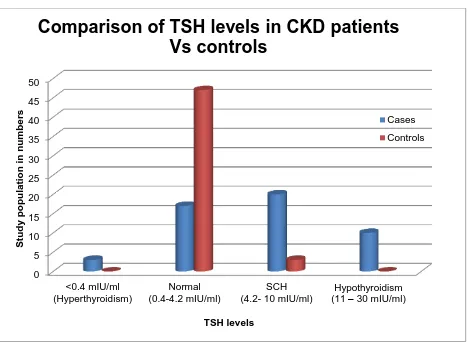
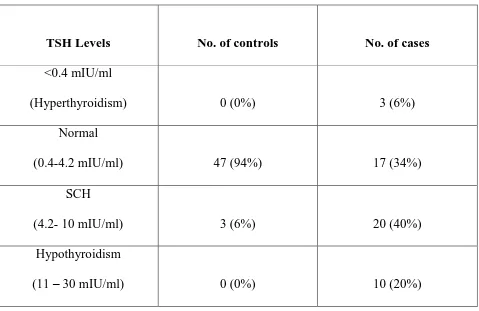
0 5 10 15 20 25 30 35 40 45 50 <0.4 mIU/ml (Hyperthyroidism) Normal (0.4-4.2 mIU/ml) SCH (4.2- 10 mIU/ml)Hypothyroidism (11 – 30 mIU/ml)
S tu d y p o p u latio n in n u mb er s TSH levels
Comparison of TSH levels in CKD patients
Vs controls
[image:67.595.74.544.264.606.2]67
Table:5 Comparison of TSH levels in CKD patients Vs controls:
TSH Levels No. of controls No. of cases
<0.4 mIU/ml
(Hyperthyroidism) 0 (0%) 3 (6%)
Normal
(0.4-4.2 mIU/ml) 47 (94%) 17 (34%)
SCH
(4.2- 10 mIU/ml) 3 (6%) 20 (40%)
Hypothyroidism
(11 – 30 mIU/ml) 0 (0%) 10 (20%)
[image:68.595.68.545.537.790.2]Table. 5 & Graph:6 explains the comparison of TSH levels in cases and controls. SCH was found in 6% of controls and 40% of cases. Thyroid abnormalities are found in 66% of CKD patients.
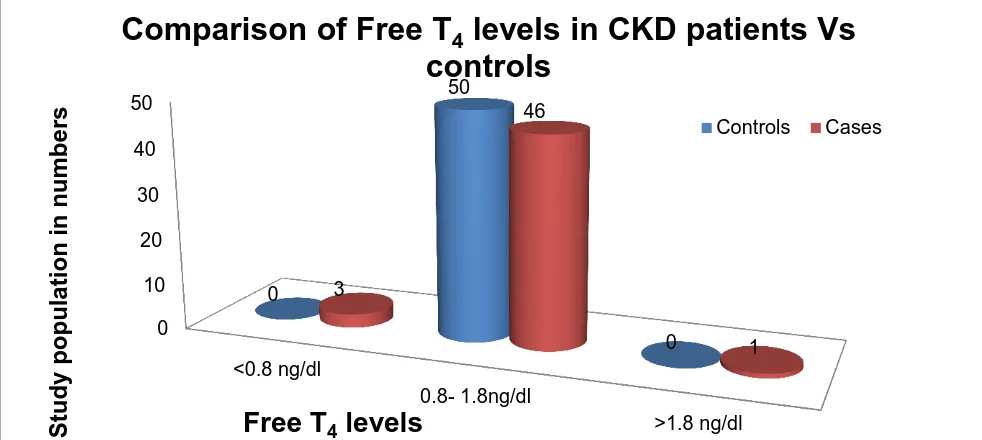
Table:6 Comparison of Free T4 levels in CKD patients Vs controls:
Free T4 levels No. of controls No. of cases
<0.8 ng/dl 0 (0%) 3(6%)
0.8- 1.8ng/dl 50 (100%) 46(92%)
68
Graph.7
Table. 6 & Graph.7
explains the comparison of free T
4levels in cases and
controls. 92% of cases and all controls have their free T
4levels within the normal
range. 6% of cases have lower free T
4values and 2% of cases have higher free T
4 [image:69.595.72.563.101.321.2]levels.
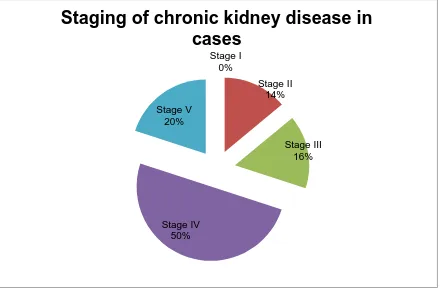
Table.7
Staging of chronic kidney disease in cases:
STAGES eGFR(ml/min) No. of cases
Stage I >90 0
Stage II 60-89 7
Stage III 30-59 8
Stage IV 15-29 25
Stage V <15 10
0 10 20 30 40 50 <0.8 ng/dl 0.8- 1.8ng/dl >1.8 ng/dl 0 50 0 3 46 1 S tu dy popu la tion in numbe rs
Free T
4levels
Comparison of Free T
4levels in CKD patients Vs
controls
[image:69.595.67.543.556.778.2]69
Graph.8
Table.7 & Graph.8
explains the classification of chronic kidney disease patients
into 5 stages based on their estimated GFR. 50% patients are in stage IV and no
[image:70.595.76.516.100.389.2]patients in stage 1. Stages II,III & V have 14%,16% and 20% patients respectively.