Structural controls on Zn-Pb-Ag mineralisation determined by scale integrated analysis at Mount Isa, Queensland, Australia
137
0
0
Full text
(2) Structural Controls on Zn-Pb-Ag Mineralisation Determined by Scale Integrated Analysis at Mount Isa, Queensland, Australia. Thesis submitted by Toby Patrick Davis BSc (Hons) University of New South Wales June 2004. for the degree of Doctor of Philosophy in the School of Earth Sciences James Cook University.
(3) STATEMENT OF ACCESS. I, the undersigned, author of this work, understand that James Cook University will make this thesis available for use within the University Library and, via the Australian Digital Theses network, for use elsewhere.. I understand that, as an unpublished work, a thesis has significant protection under the Copyright Act and I wish the following restrictions to be placed on this work; all users consulting this thesis will have to sign the following statement:. “In consulting this thesis I agree not to copy or closely paraphrase it in whole or in part without the written consent of the Author; and to make proper written acknowledgement for any assistance obtained from it.”. _________________________ ______________ Toby Patrick Davis June 2004.
(4) STATEMENT OF SOURCES. DECLARATION. I declare that this thesis is my own work and has not been submitted in any form for another degree or diploma at any university or other institution of tertiary education. Information derived from the published or unpublished work of others has been acknowledged in the text and a list of references is given.. Signature. Date.
(5) Acknowledgements. Firstly I’d thank my supervisor Tim Bell for his enthusiastic supervision of this project and for introducing me to the exciting side of structural geology. I especially appreciate Tim allowing me to take this project in the directions that I wanted. It was a great to have the opportunity to work with you. The SAMRI den was the site of numerous lively and stimulating discussions on many subjects that sometimes included structural and metamorphic geology and I thank the other members of SAMRI for their company and ideas, most notably during the SAMRI “discussions”, especially Chris Bell, Nikki Adshead-Bell, Mustafa Cihan, Andrew Ham, Ken Hickey, Cameron H2, Nick Timms, Muhammad Sayab, Mike Rubenach and Peter Welch. I’d also like to thank the other staff and students in the School for their willing assistance at all times. Thanks in particular to Andrew Allibone and Lucy Chapman who were willing sparring partners on the controversial topic of the genesis of the Mount Isa orebody. This project was supported and funded, including stipend, by MIM Ltd, Mount Isa Business Unit. It was initially proposed by Steve Law and Alice Clarke and they are thanked for creating this opportunity and for showing me the ropes around the mine when I first arrived, including a stern warning about having preconceived ideas on the genesis of this deposit, which I had no idea about. On site I was given abundant logistical assistance by many staff in the geology department at the mine, who also took the time the discuss aspects of the deposit that they thought would be of use. I greatly appreciated your suggestions, insights and help. I hope the geologists among you find this work useful in understanding the formation this deposit or at least it gives you something to discuss or argue about for a while. Thanks to the many people, especially at the beginning of this project who offered their ideas on which was the best way forward. Thanks to Chris Bell for stimulating discussions on all aspects of geology and other deep and meaningful aspects of life such as climbing. Thanks for introducing me to rock climbing, I will especially remember the morning and afternoon climbs and bouldering sessions at Kissing Point as these were some of my favourite moments in Townsville, besides microstructure sessions with Tim, of course. During this project I was reintroduced to piscatorial pleasures and introduced to the excitement of barramundi fishing in the Houghton River by Roger Mustard and Adam Webb. Thanks for your excellent company on numerous fishing trips and although these were not always successful in terms of catching big fish, they were in terms of rest and relaxation as well as being the highlight of living in Townsville..
(6) Thank you Mum and Dad for your support during this PhD and for teaching me the value of persistence not to mention your many other gifts over the years. Thanks to my brothers and sisters for putting up with my PhD ramblings. I have always been appreciative for your support. Advice and encouragement from Richard Crookes and Denis Clarke gave me the nudge needed to leave my job as a mine geologist and do this PhD, and it is greatly appreciated. Finally I’d like to thank Cathy. Above all she experienced this more than anyone else and going through another PhD so soon after your own can’t have been a thrilling prospect. Thank you for convincing that it was a good thing to do in the first place, and for all your encouragement and companionship, which kept me sane along the way. It’s out of my system now..
(7) Preface. T. P. Davis, PhD 2004.
(8) Preface. Preface. This study analyses the structural geology of the Mount Isa Zn-Pb-Ag orebody to determine the role of structure in its evolution. A comparison with the nearby copper orebodies is included because the two ore types are potentially related. The Mount Isa Zn-Pb-Cu-Ag deposit is one of the largest and most enigmatic base metal accumulations on Earth. It is located on the western margin of the Leichhardt River Fault Trough in the Western Fold Belt of the Mount Isa Inlier, northwestern Queensland, Australia. The deposit lies east of and adjacent to the Mount Isa and Paroo faults and is traversed by folds that formed during the Isan Orogeny (1610-1500 Ma). It is hosted by the Urquhart Shale, a dolomitic sedimentary sequence in the Upper Mount Isa Group. Prior to mining the base metal deposit contained in excess of 405 million tonnes of ore including 150 Mt at 7 % Zn, 6% Pb and 150 g/t Ag and 255 Mt at 3.3 % Cu (Forrestal 1990, McGoldrick and Large 1998, Waring et al. 1998) in spatially separate copper and Zn-Pb-Ag orebodies that show contrasting features when examined at similar scales. The Zn-Pb-Ag orebody contains a series of conformable lenses that consist of centimetre scale bedding parallel sulphide bands and breccias and belongs to the stratiform sediment hosted ZnPb-Ag class of deposits (Large et al., 2002). Other deposits in this class include Red Dog (Alaska), Sullivan (Canada), HYC (Northern Territory), Century (Queensland), and George Fisher-Hilton (Queensland). In contrast to the Zn-Pb-Ag orebody the copper orebodies at Mount Isa are discordant at the mine scale and consist of cross-cutting breccias. The genesis of the Mount Isa base metal deposit is controversial because of apparently conflicting features between and within the copper and Zn-Pb-Ag orebodies. Blanchard and Hall (1937) and Grondijs and Schouten (1937) considered the deposits to be epigenetic because of the proximity of ores to folds and high strain zones. However, this early deposit model was replaced by ones involving predeformation mineralisation, including exhalative and diagenetic depositional styles, in order to explain the conformable nature of sulphide bands within the ZnPb-Ag ores (Murray, 1961; Neudert, 1986; McGoldrick and Large, 1998; Large et al, 1998). In these models, various discordant features documented by the earliest workers were attributed to remobilisation (McDonald, 1970; McClay, 1979). The copper ores were initially considered to be related to the Zn-Pb-Ag ores and were likewise regarded as having a predeformation origin, but establishment of a tectono-metamorphic origin for copper (Perkins, 1984; Swager, 1985; Bell et al, 1988) led to the notion that the different ore styles are spatially coincidental but not temporally related. Evidence of syntectonic sulphide deposition presented by Perkins (1997) has largely been dismissed as an effect of remobilisation because of the ambiguous representivity of. T. P. Davis, PhD 2004. i.
(9) Preface. these features (Betts and Lister, 2002; Large et al., 2002). However, remobilisation has never been documented at Mount Isa. Tectonic structures can be involved in either syn-tectonic mineralisation or modification of orebodies, or a combination of these processes. The ambiguity surrounding the genesis of the Mount Isa Zn-Pb-Ag orebody arises because it is not known which of these scenarios is the case. The focus of this study is to determine the relationship between the structural geology and the metal distribution throughout the Zn-Pb-Ag orebody at a range of scales. The scale integrated approach taken has made it possible to establish the representivity of features and to determine the role of tectonic structures in the evolution of the ores. The thesis contains four papers (Parts A-D) that were written to be submitted for publication in international journals. Part A deals with the mine scale metal distribution and structural geology. It was published in 2004 in Economic Geology, volume 99. The results of this study have significant implications for the timing of mineralisation. Part B examines the formation of folds that were shown in Part A to have controlled the distribution of metal in the deposit. The results may have implications for other types of ore deposits that are associated with folding and lie proximal to high strain zones. This paper will also be submitted to Economic Geology. Part C is an examination of two potential and topical kinematic indicators that are present in the deposit. These are flanking structures and asymmetric boudins. This paper will be submitted the Journal of Structural Geology. Part D is an in depth analysis of the ore textures in the Zn-Pb-Ag orebody. It defines their large scale distribution, and the kinematics involved in their formation based on microstructural analysis. This paper will be submitted to either Economic Geology or Ore Geology Reviews. The four sections are summarised below:. Part A This section examines the mine scale distribution of metals within in the Zn-Pb-Ag orebody and its relationship to the structural framework and the nearby copper orebodies. The metal distribution was defined by modelling grade control data and the structural framework was determined by mapping the underground workings and from historical mapping. There is a ubiquitous relationship between folds and the metal distribution with disharmonic NNWplunging asymmetric folds hosting ore shoots as well as controlling the low grade distribution. Comparison of the geometries of the Zn-Pb-Ag and copper orebodies show that they are virtually the same. Several remobilisation and syntectonic mineralisation scenarios are presented to explain the large scale features defined in this study.. T. P. Davis, PhD 2004. ii.
(10) Preface. Part B Folds identified in Part A as controlling the distribution of metals in the Zn-Pb-Ag orebody are examined to determine how they formed and why they were centres of mineralisation. The formation of these folds was determined using large scale and microstructural features. Folds controlling the metal distribution formed over several deformations. Spatial partitioning of deformation within and along competency domains in the rock was important during folding and was also responsible for the size, continuity and location of the folds. The fold model presented accounts for the switch of shear sense along axial planar foliations either side of the fold hinge and the preservation of older generations of folds, which are important to the localisation of the ores.. Part C Flanking structures and asymmetric boudins have been the subject of recent publications because of their potential as kinematic indicators. Flanking structures are located around both veins that formed early during mineralisation as well as asymmetric boudins. They are common components of the ores. This section examines flanking structures and asymmetric boudins in the Mount Isa Zn-Pb-Ag orebody and presents new mechanisms for their formation based on meso and microstructural analysis. The formation of various components of structures is linked to separate deformations. Consequently, recently devised classification schemes were found to be overly simple and cannot be applied in this case. The use of these structures as simple kinematic indicators can be misleading. However, detailed examination of such structures reveals important information about the deformation history. Part D This study examined the range of ore textural styles in the Zn-Pb-Ag orebody. The petrographical, textural and microstructural features of each ore textural style were examined to determine the kinematic processes involved in mineralisation. The range and distribution of ore textural styles was determined by detailed logging of diamond drill core across the orebody. The microstructural study utilised oriented samples collected from underground workings. By showing the distribution of ore textures of a large area this study was able to clearly demonstrate the extent of structurally controlled mineralisation.. Terminology •. The Mount Isa deposit refers to the entire Mount Isa base metal accumulation.. •. There are two sources of Zn-Pb-Ag ore in the Mount Isa deposit. The first is the Lead mine. The second is the Rio Grande orebody which is a minor source of ore to the south. T. P. Davis, PhD 2004. iii.
(11) Preface. of the Lead mine. Zn-Pb-Ag deposits are actually present around all margins of the silica-dolomite body above the Paroo fault. The deposits in the Lead mine are the main subject of this study, though the Rio Grande orebody and Zn-Pb-Ag deposits at the south end of the Mount Isa deposits were examined. The latter were studied in drill core only. Both contain the same features as the Zn-Pb-Ag deposits in the Lead mine. Several samples (4078 and 4079) from the aforementioned drilling are presented in the study. •. Orebody refers to either the copper or Zn-Pb-Ag part of the base metal accumulation. The copper orebody contains several large copper bodies that are referred to with individual orebody names in mining operation, such as the 650 or 3000 copper orebodies. Because these are large and easily separable in nature this convention is also used here.. •. The Zn-Pb-Ag orebody contains ten broadly conformable bodies of peak grade termed Zn-Pb-Ag lenses. These lenses are the smallest recognisable ore units in the plans of modelled metal distribution that cover the entire orebody.. •. Zn-Pb-Ag packages are collections of individual centimetre scale conformable sulphide bands or breccias. These packages are usually separated by more than a metre of barren siltstones or mudstones and correspond to ‘lead orebodies’ defined at the mine. A single Zn-Pb-Ag lens may contain numerous Zn-Pb-Ag packages.. •. The orientation of photomicrographs and photographs is shown in the top right corner. A single barbed arrow over a numeral denotes a vertical section with the number indicating the strike. Horizontal sections contain north arrows. Sample numbers or locations of exposures are given in the lower left corner and a list of samples and their locations is presented in Appendix C. Where possible all images are presented looking to the north. In some cases this means mirror images of photographs of exposures taken looking south were used.. •. A complete collection of longitudinal sections showing the metal distribution for the Zn-Pb-Ag orebody are provided in a compact disc in Appendix A in Portable Document Format (PDF).. T. P. Davis, PhD 2004. iv.
(12) Contents. T. P. Davis, PhD 2004.
(13) Table of Contents. Statement of Sources Statement of Access Acknowledgements. Preface. i-iv. List of Tables. vi. List of Figures. vii-x. Part A Mine-scale structural controls on the Mount Isa Zn-Pb-Ag and Cu orebodies. A-1 – A-31. Part B The formation of NNW-plunging, asymmetric folds implicated in the formation of the Mount Isa Cu and Zn-Pb-Ag orebodies. B-1 – B-34. Part C Microstructural analysis of asymmetric boudins and flanking structures from Mount Isa. C-1 – C-32. Part D Textural and microstructural analysis of the Zn-Pb-Ag and copper ores at Mount Isa. D-1 – D-60. Conclusions. Conc-1 – Conc-3. References. Ref-1 – Ref-8. Appendix A Appendix B Appendix C Appendix D. T. P. Davis, PhD 2004. v.
(14) List of Tables. Part A Table 1. Summary of Cover Sequences in the Mount Isa Inlier. Page A-16. Table 2. Correlation between the Zn-Pb-Ag Lenses Used in this Study and ‘Orebodies’ defined by previous workers. A-14. Correlation between Deformation Sequences of Previous Workers. B-16. Description of the Geometric Features of Asymmetric Boudins as Defined by Goscombe and Passchier (2003). C-16. Characteristics of Depositional Sites and Styles of the Ore Assemblage Throughout the Deposit. D-26. Part B Table 1 Part C Table 1 Part D Table 1. T. P. Davis, PhD 2004. vi.
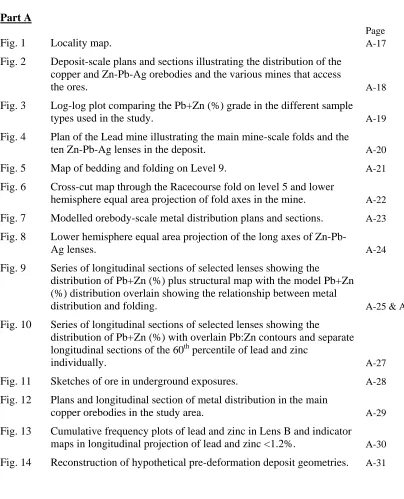
(15) List of Figures. Part A Fig. 1. Locality map.. Page A-17. Fig. 2. Deposit-scale plans and sections illustrating the distribution of the copper and Zn-Pb-Ag orebodies and the various mines that access the ores.. A-18. Log-log plot comparing the Pb+Zn (%) grade in the different sample types used in the study.. A-19. Plan of the Lead mine illustrating the main mine-scale folds and the ten Zn-Pb-Ag lenses in the deposit.. A-20. Fig. 5. Map of bedding and folding on Level 9.. A-21. Fig. 6. Cross-cut map through the Racecourse fold on level 5 and lower hemisphere equal area projection of fold axes in the mine.. A-22. Fig. 7. Modelled orebody-scale metal distribution plans and sections.. A-23. Fig. 8. Lower hemisphere equal area projection of the long axes of Zn-PbAg lenses.. A-24. Series of longitudinal sections of selected lenses showing the distribution of Pb+Zn (%) plus structural map with the model Pb+Zn (%) distribution overlain showing the relationship between metal distribution and folding.. A-25 & A26. Series of longitudinal sections of selected lenses showing the distribution of Pb+Zn (%) with overlain Pb:Zn contours and separate longitudinal sections of the 60th percentile of lead and zinc individually.. A-27. Fig. 11. Sketches of ore in underground exposures.. A-28. Fig. 12. Plans and longitudinal section of metal distribution in the main copper orebodies in the study area.. A-29. Cumulative frequency plots of lead and zinc in Lens B and indicator maps in longitudinal projection of lead and zinc <1.2%.. A-30. Reconstruction of hypothetical pre-deformation deposit geometries.. A-31. Fig. 3 Fig. 4. Fig. 9. Fig. 10. Fig. 13 Fig. 14. T. P. Davis, PhD 2004. vii.
(16) List of Figures continued. Part B. Fig. 1. Locality map.. Page B-17. Fig. 2. Photographs of the main rock types in the Urquhart Shale.. B-18. Fig. 3. Photomicrographs illustrating the different styles of tectonic cleavages in the main rock types.. B-19. Photograph of disjunctive cleavage in siltstones parallel to the axial planes of folds in interbedded siltstone and shales units.. B-20. Fig. 5. Map of NNW-SSE striking folds in the Mount Isa Lead mine.. B-21. Fig. 6. Map of a cross-cut through the Racecourse fold.. B-22. Fig. 7. Map of the Mount Isa fold with high strain zones situated on the short limb, and a lower hemisphere projection equal area projection of bedding on either limb of the fold.. B-23. Map of bedding and the Mount Isa fold in level 27c of the Enterprise mine.. B-24. Fig. 9. Maps of F1 folds in the Lead mine. Level 15, Mount Isa Lead mine.. B-25. Fig. 10. Lower hemisphere equal area projection and rose diagram of fold axis in the Lead mine.. B-26. Photograph of an underground exposure of polyclinal folding. 7350 XC, level 17B, Mount Isa Lead mine.. B-27. Photographs of D2 high strain zones containing carbonate and sulphide alteration on the long limb of the Mount Isa fold. 6904 XC, level 5, Mount Isa Lead Mine.. B-28. Lower hemisphere equal area projections of pitches from a radial series thin sections that illustrate the orientations of foliations.. B-29. Photomicrographs of cleavages on the long limb of NNW-SSEstriking folds.. B-30. Photomicrographs of cleavages in the short limb of the Mount Isa fold.. B-31. Fig. 16. Illustration of the development of the Paroo Fault.. B-32. Fig. 17. Illustration of the fold mechanism that formed NNW-SSE-striking folds.. B-33 & 34. Fig. 4. Fig. 8. Fig. 11 Fig. 12. Fig. 13 Fig. 14 Fig. 15. T. P. Davis, PhD 2004. viii.
(17) List of Figures continued. Part C. Fig. 1. Geometric features of asymmetric boudins.. Page C-17. Fig. 2. Schematic illustration of flanking structures.. C-18. Fig. 3. Locality map.. C-19. Fig. 4. Photomicrographs comparing variations in deformation between the main rock types.. C-20. Fig. 5. Disjunctive cleavages in massive siltstones and mudstones.. C21. Fig. 6. East-dipping carbonate veins in the rock surrounding conformable sulphide accumulations.. C-22. Fig. 7. Asymmetric boudins.. C-23 & C-24. Fig. 8. Flanking structure in an underground exposure.. C-25. Fig. 9. Vertical section looking north of flanking structure and detail of cutting element vein.. C-26. Fig. 10. Photomicrographs of cutting element veins.. C-27. Fig. 11. Dip-isogon analysis of the flanking fold in Figure 9.. C-28. Fig. 12. Photomicrographs comparing the density of S4 in the internal and external host element domains.. C-29. Fig. 13. Illustration of the formation of asymmetric boudins.. C-30. Fig. 14. Schematic illustration of reactivation.. C-31. Fig. 15. Schematic illustration of flanking structure formation.. C-32. T. P. Davis, PhD 2004. ix.
(18) List of Figures continued. Part D. Fig. 1. Locality diagram and plan of level 17 of the Mount Isa mine.. Page D-27. Fig. 2. Photograph of drill core illustrating the main rock types.. D-28. Fig. 3. Illustration of Zn-Pb-Ag bodies at a range of scales covered in this study.. D-29. Fig. 4. Microcrystalline pyrite bands.. D-30. Fig. 5. Massive or pink microcrystalline sphalerite bands.. D-31. Fig. 6. Laminated microcrystalline sphalerite.. D-32. Fig. 7. Microcrystalline sphalerite petrography.. D-33 & 34. Fig. 8. Fine grained sphalerite.. D-35. Fig. 9. Etched fine grained sphalerite.. D-36. Fig. 10. Fine grained sphalerite petrography.. D-37. Fig. 11. Back scatter image of quartz and calcite alteration of dolomite.. D-38. Fig. 12. Galena bands.. D-39. Fig. 13. Trains of carbonate porphyroblasts or ‘nodular layers’.. D-40. Fig. 14. Foliation fill breccias.. D-41 & 42. Fig. 15. Asymmetric boudin breccias.. D-43 & 44. Fig. 16. Fold clast breccias.. D-45. Fig. 17. Rounded clast breccias.. D-46. Fig. 18. Sulphide overprinting relationships in the breccias.. D-47. Fig. 19. Chalcopyrite breccias.. D-48. Fig. 20. East-dipping carbonate veins.. D-49. Fig. 21. Stratiform silica-dolomite alteration between the copper and Zn-PbAg orebodies.. D-50. Fig. 22. Graphs of cumulative thickness of ore textural styles.. D-51. Fig. 23. Distribution of ore textural styles in plan.. D-52 & 53. Fig. 24. Microcrystalline sphalerite alteration front around S2 vein.. D54. Fig. 25. Microstructures in fold clast breccias.. D-55 & 56. Fig. 26. Cleavage relationships on the long limbs west of anticlines in fold clast breccias.. D-57. Cleavage relationships on the short limbs east of anticlines in fold clast breccias.. D-58. Fig. 28. Process diagram of dilation caused by strain gradients.. D-59. Fig. 29. Process diagram illustrating the formation of intrafolial folds.. D-60. Fig. 27. T. P. Davis, PhD 2004. x.
(19) Part A. Mine-scale structural controls on the Mount Isa Zn-Pb-Ag and Cu orebodies. (Published in Economic Geology, volume 99, number 3). T. P. Davis, PhD 2004.
(20) Mine-scale structural controls on the Mount Isa Zn-Pb-Ag and Cu orebodies. Abstract. A-1. Introduction. A-2. Geological Background. A-3. Deposit description. A-3. Genetic Models. A-3. Zn-Pb-Ag orebody. A-3. Copper orebody. A-4. Methodology. A-5. Structural Framework. A-6. The Paroo Fault. A-6. Folding. A-6. Geometric Analysis of the Ores. A-7. Geometry of Zn-Pb-Ag Lenses. A-7. Geometry of Copper orebodies. A-8. Comparison with structure. A-9. Copper orebodies. A-9. Zn-Pb-Ag lenses. A-10. Zoning patterns. A-11. Distribution of low grade populations. A-11. Discussion and Conclusions. A-11. Acknowledgements. A-15. Tables. A-16. Figures. A-17 – A-31. T. P. Davis, PhD 2004.
(21) Part A – Mine-scale Structural Controls. Abstract. The Mount Isa Zn-Pb-Cu-Ag deposit contained almost 30 million tonnes of base metals, prior to mining, in spatially separate copper and Zn-Pb-Ag orebodies. The origin of the Zn-PbAg ores is debated due to apparently conflicting features at intermediate to microscales. Ambiguity is associated with small scale features, which can be interpreted either in terms of syndeformation mineralisation or in terms of remobilisation of a predeformation orebody when considered in isolation of larger scale characteristics of the orebody. Understanding the relationship between metal distribution and the structural framework at the mine-scale helps to determine whether the orebody is deformed and leads to a better understanding of its formation. The deposit contains ten stratabound Zn-Pb-Ag lenses in an en echelon array. The extremities of the orebodies correlate with F4 folds, and high grade shoots are centred on F4 hinges and short limbs that contain older F2 folds. Contours of Pb/Zn ratios throughout the lenses are parallel to F4 hinges and silica-dolomite alteration fronts. Restoring the large scale effects of folding by rotating bedding and the lenses to horizontal indicates that a sedimentary exhalative style of mineralisation cannot account for the present geometries of the Zn-Pb-Ag lenses. This reconstruction places the depositional basin in a compressional setting, or places the ores on topographic highs. These scenarios are considered to be incompatible with synsedimentary processes. There are a number of important similarities between the geometries of the Zn-Pb-Ag lenses and the copper orebodies, which are interpreted to have a syntectonic origin. The Zn-PbAg lenses display the same structural controls as the syntectonic copper ores and appear to have been emplaced at the same time in D4. Older F2 folds are preserved on the hinges and short limb areas of F4 folds and are interpreted to have behaved as structural heterogeneities during D4, which caused the dilation that led to metal deposition. F4 folds closest to the copper orebodies contain the highest grade Zn-Pb-Ag ore shoots, possibly indicating decreasing metal deposition away from the copper ores as fluids became progressively depleted in metals and/or concentration of fluid flow near the copper orebodies. In some areas, Zn-Pb-Ag ores wrap around silica-dolomite alteration associated with syntectonic copper mineralisation, suggesting a similarly late timing. The continuity of metal grades and Pb/Zn ratios throughout the Zn-PbAg lenses indicates that the ores are not the result of local remobilisation. Instead, large-scale processes whereby the metals were introduced from an external source in D4 must have been involved in the formation of the Zn-Pb-Ag orebody.. T. P. Davis, PhD 2004. A-1.
(22) Part A – Mine-scale Structural Controls. Introduction. Mount Isa is a globally significant base metal deposit which, prior to mining, contained 405 million tonnes of ore including 150 Mt at 7 % Zn, 6% Pb, and 150 g/t Ag and 255 Mt at 3.3 % Cu (Forrestal, 1990; McGoldrick and Large, 1998; Waring et al., 1998). ZnPb-Ag and copper orebodies are spatially separate and, when examined at the same scales, in most cases display significant differences in geometry and structure. At the mine-scale the Zn-Pb-Ag orebody contains a series of stratabound lenses, whereas copper orebodies occur in large nonconformable breccias hosted in a silica-dolomite alteration envelope. Debate over the timing of Zn-Pb-Ag mineralisation continues because of conflicting interpretation of several features of the deposit (cf. Valenta, 1994; Perkins, 1997; McGoldrick and Large, 1998; Perkins and Bell, 1998; Chapman, 1999). The strongly stratabound nature of the Zn-Pb-Ag ores and the lack of identifiable channelways, structure, and alteration at exposure-scale appear to indicate a predeformation origin, whereas microstructures such as sulphide -cleavage overprinting relationships and replacive sulphide textures, as well as tectonic veins, suggest that regional deformation had a strong influence on mineralisation. The difference in style between the copper and the adjacent Zn-Pb-Ag ores has generally been attributed to different mineralising events and has added to the genesis debate by requiring spatially coincident mineralising events separated by over 100 Ma. The debate is further complicated by some field observations that can be interpreted to support either predeformation mineralisation with remobilisation, or syntectonic mineralisation, as shown by Perkins (1997, 1998). Most studies of the structure of the ores have been at microscopic to exposure-scales (Grondijs and Schouten, 1937; Blanchard and Hall, 1942; McDonald, 1970; McClay 1979; Perkins, 1997). At these scales some observations are ambiguous and of uncertain representivity relative to the size of the deposit. The aim of this study is to determine the influence of regionalscale deformation on the deposit to define the large-scale relationship between the Zn-Pb-Ag ores and the structural framework in the mine. The influence of deformation on the metal distributions is discussed in the context of remobilisation of pre-existing deposits versus syndeformation mineralisation as examined by Marshall and Gilligan (1987, 1993) and Marshall et al. (2000). The geometries of the Zn-Pb-Ag ores are compared to those of the copper orebodies, which have been interpreted to be tectono-metamorphic in origin (Perkins, 1984; Swager, 1985; Bell et al., 1988; Waring et al., 1998), and the possible genetic links between the two ore types are discussed.. T. P. Davis, PhD 2004. A-2.
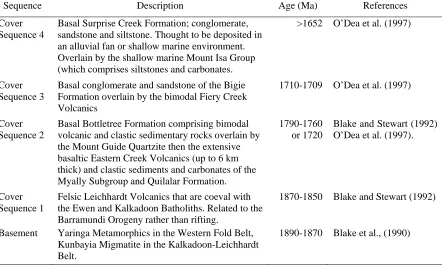
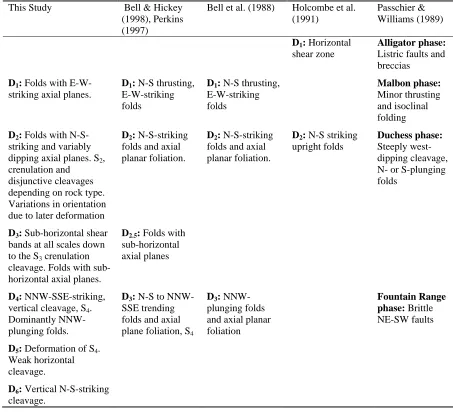
(23) Part A – Mine-scale Structural Controls. Geological Background. Deposit description Mount Isa is located on the western margin of the Leichhardt River Fault Trough in the Mount Isa Inlier (Fig. 1), a Palaeo- to Mesoproterozoic terrane in NW Queensland. The inlier is subdivided into the Western, the Kalkadoon-Leichhardt, and the Eastern Fold Belts (Carter et al., 1961; Blake and Stewart,1992). It comprises basement metamorphic rocks unconformably overlain by rift-fill sedimentary and volcanic rock sequences and intrusive rocks of various ages. The rift-fill package is divided into four cover sequences, summarised in Table 1. The Mount Isa deposit is hosted by the Urquhart Shale member of the Upper Mount Isa Group in Cover Sequence 4. The Urquhart Shale comprises a sequence of interbedded dolomitic, shales, siltstones and mudstones with an average bed thickness of 11.6 mm (Neudert, 1986), which imparts a strong structural anisotropy. The deposit is located on the western limb of a regional D2 anticline (Bell et al., 1988), east of the Mount Isa Fault (Fig. 1). This reverse fault dips steeply west and juxtaposes amphibolite facies rocks to the west against greenschist facies rocks to the east, and truncates a D2 anticline south of the mine (Bell, 1991). The host rocks have been affected by three macroscopic folding events; D1 resulted from N-S shortening and included north to south thrusting (Bell, 1991), whereas D2 and D4 produced N-S trending upright folds in response to east-west compression (Bell, 1983). Locally at Mount Isa, D4 produced NNW-SSE-striking folds. Bell and Hickey (1998) recognised a localised deformation, D3, between D2 and D4. The effects of this deformation are generally subtle and recognised by rotation of F2 fold axes into flat orientations and a shallow-dipping crenulation cleavage. According to Rubenach (1992), prograde Isan metamorphism was synchronous with, and peaked around, the end of D2.. Genetic models Central to the debate about the genesis of Mount Isa is the timing of mineralisation with respect to deposition of the host rocks and regional deformation, and the relationship between the copper and Zn-Pb-Ag orebodies. The following section reviews the genetic models that have been proposed for the Mount Isa deposits.. Zn-Pb-Ag orebody: A syndeformation model for Zn-Pb-Ag ores was initially proposed by Blanchard and Hall (1937, 1942) and more recently by Perkins (1997, 1998) and Perkins and Bell (1998). It is based on replacement textures (Grondijs and Schouten, 1937; O’Malley and McGhie, 1939; Perkins, 1997), mesoscopic relationships of ore to folds and high strain zones. T. P. Davis, PhD 2004. A-3.
(24) Part A – Mine-scale Structural Controls. (Blanchard and Hall, 1937, 1942), and the transgressive nature of Zn-Pb-Ag lenses (Perkins, 1997). The Syn-D4 timing of mineralisation proposed by Perkins (1997) is based on sulphide cleavage overprinting relationships. Perkins (1997) further proposed that Zn-Pb-Ag ores formed contemporaneously with the copper orebodies in a zoned system with synchronous deformation and alteration. Synsedimentary models have been proposed for Mount Isa by Murray (1961), Stanton (1962), Russell et al. (1981), Sawkins (1984), Large et al. (1998) and McGoldrick and Large (1998) based on the lack of evidence for fluid channelways and wallrock alteration and the stratiform nature of the ores at the deposit to exposure-scale. It is argued that primary sedimentary features that are typical of exhalative deposits were destroyed by deformation and metamorphism (McDonald, 1970; McClay, 1979; Betts and Lister, 2002). Cooke et al. (2000) explain the general lack of an identifiable feeder system in the Zn-Pb-Ag deposits in northern Australia, including the Mount Isa, Hilton, and McArthur River deposits, as the result of mineralisation from oxidized fluids that would have required exceptional circumstances to deposit sulphides in a feeder system. A diagenetic origin was proposed by Neudert and Russell (1981) and Neudert (1984, 1986), who interpreted water depths during sedimentation as being too shallow for exhalative processes to form these deposits. However, Large et al. (1998) used sedimentological data to argue that the host rocks at HYC (McArthur River), located in the Batten Trough north of Mount Isa, accumulated when water depths were sufficient for exhalative style mineralisation to occur. A diagenetic timing is also proposed by Chapman (1999) based on stable isotope signatures of carbonates in the host rocks. Various authors (e.g., McDonald, 1970; McClay, 1979; Neudert, 1986; Betts and Lister, 2002) have invoked remobilisation of the ores to account for the observed syntectonic features. Valenta (1994) proposed similar remobilisation at Hilton, 20 km north. McDonald (1970) and McClay (1979), who examined features at the scale of centimetres to several tens of meters, found that fold hinges were generally enriched in galena relative to sphalerite, but unmetamorphosed samples could not be identified in these studies.. Copper orebody: Perkins (1984) and Swager (1985) showed that copper mineralisation, dolomitisation and silicification (referred to locally as silica-dolomite alteration) at Mount Isa were coincident with D4. Bell et al. (1988) proposed that mineralising fluids entered the depositional environment across the Basement Fault which they described as the primary structural control on copper mineralisation. Fluid flow was facilitated by brecciation caused by differential shearing (opposing shear sense) on opposite sides of the Basement Fault during D4.. T. P. Davis, PhD 2004. A-4.
(25) Part A – Mine-scale Structural Controls. Myers et al. (1996) and Perkins (1997) proposed that copper and Zn-Pb-Ag mineralisation were cogenetic and syntectonic. Perkins (1997) argued for a zoned Cu-Pb-Zn system, whereas Myers et al. (1996) preferred synchronous copper and Zn-Pb-Ag mineralisation from separate fluids.. Methodology. The geometry and grade distribution of Zn-Pb-Ag and copper orebodies in the northern part of the Mount Isa deposit were analysed at the mine-scale and in individual exposures. The copper orebodies examined include the 650, 500 and 200 orebodies in the Lead Mine and the 3000 and 3500 orebodies in the Enterprise Mine, situated below the Lead Mine (Fig. 2). The geometries of the orebodies are illustrated in series of plans and sections constructed using grade control data, including drill core and wall sampling and underground mapping. Maps of five levels of the Lead Mine were compiled from historical mapping by company geologists and mapping by the author to establish the mine-scale structural framework (Appendix A). The grade database contains over 514,000 assays of samples collected from 1927 to 2000. Drilling data came mainly from underground diamond drill holes, horizontally and vertically spaced at approximately 25 m, and intersecting the orebody at high angles. Assay data from wall-rock chip samples and drill core were compared on a log-log plot (Fig. 3). The plot for this data set is close to a straight line so both sample types were used in modelling grade distribution, although a slight bias towards higher Pb+Zn in drill core samples was found. Metal distribution was modelled for the mapped levels, which are spaced at approximately 200 m. Only data from 100 m above and below each level was used. A block model was created with individual block dimensions of 4 m north-south, 2 m east-west, and 4 m vertically. These dimensions were chosen to reflect the shape of the orebodies and the sample spacing. The grade of individual blocks was calculated by interpreting between samples using the inverse distance method which weights each sample inversely according to its distance from the block being estimated (Isaaks and Srivastava, 1989). This method was used because of its simplicity, the concentration of metals and the scale of the study. The Zn-Pb-Ag lenses defined in this study are different to the ‘orebodies’ of earlier studies (e.g., Perkins, 1997). Previous workers used a system of 31 orebodies that are not reflected in the modelled metal distributions of this study. Individual ‘orebodies’ of earlier workers in some cases represent only a portion of a Zn-Pb-Ag lens defined here and thereby give an incomplete picture of the Zn-Pb-Ag distribution. Table 2 lists the correlation between orebody names used in previous studies and the Zn-Pb-Ag lenses used here. The deposit was. T. P. Davis, PhD 2004. A-5.
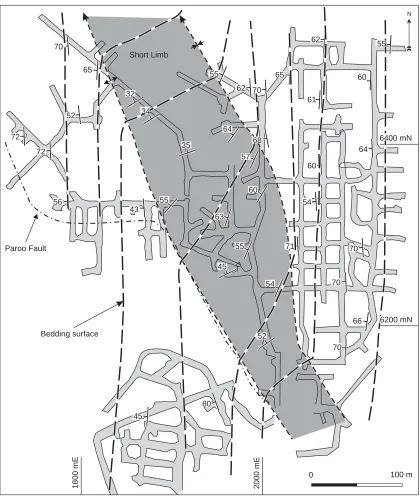
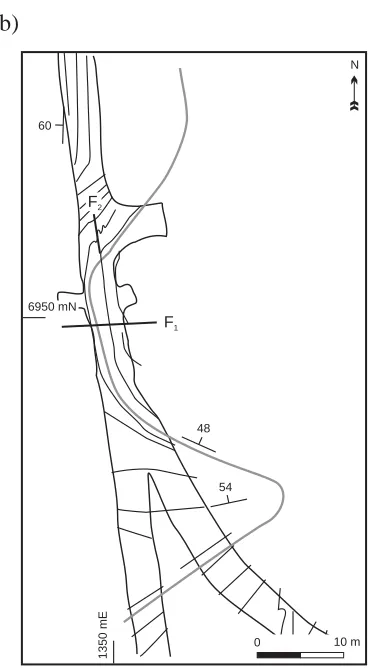
(26) Part A – Mine-scale Structural Controls. found to be dominated by ten Zn-Pb-Ag lenses with Pb+Zn >7.75 %, which are shown in Figure 4. Grade distribution in longitudinal sections was determined using inverse distance weighted contouring of the product of the average grade and the width of intersections through each Zn-Pb-Ag lens. The metal distribution was compared to the geological structure over the modelled areas. Plans and sections of modelled metal distribution in addition to those presented in the figures are located in Appendix A.. Structural Framework. The Paroo fault The Paroo Fault is the largest discrete structure associated with the deposit. It truncates the mine sequence at depth where it forms the faulted contact between the steeply west-dipping Urquhart Shale above, and the shallowly dipping Eastern Creek Volcanics (or greenstone basement; Fig. 2) below. The Paroo Fault has a complex but well constrained geometry determined by drilling. Below the mine it dips at a low angle to the east, where it is termed the Basement Fault, but progressively steepens to the west (Fig. 2b). This geometry was explained by Bell (1983, 1991) as the result of overturning of the Eastern Creek Volcanics in the roof sheet on the western lateral ramp of the Kokkalukkanurker Duplex. There is a change in the depth of the Basement Fault portion of the Paroo Fault in longitudinal section from south to north. Drill hole intersections show that between 3200 mN to 5970 mN (all grid references are in mine grid coordinates) the Basement Fault is consistently located around 2500 mRL. However, north of 5970 mN the Basement Fault dips steeply to the north so that at 6600 mN it is at 1990 mRL, a change of over 500 m (Fig. 2c). The Lead Mine is situated above the deeper parts of the Basement Fault in the north.. Folding The mine-scale fabric is dominated by NNE-SSW-striking bedding in the south that progressively rotates to N-S in the north of the mine (Fig. 5). This fabric is traversed by numerous narrow NNW-SSE-striking linear fold zones that are the short limbs of asymmetric, ENE-verging folds formed in D4. The relative timing of folding was determined by microstructural studies (Bell and Hickey, 1998; Part B). Folds are correlatable throughout the mine despite their discontinuous nature. The interlimb angle of the folds generally decreases as the width of the NNW-SSE-striking fold zones decreases. The fold zones have arcuate boundaries within which bedding orientations vary relative to the dominant fabric outside these. T. P. Davis, PhD 2004. A-6.
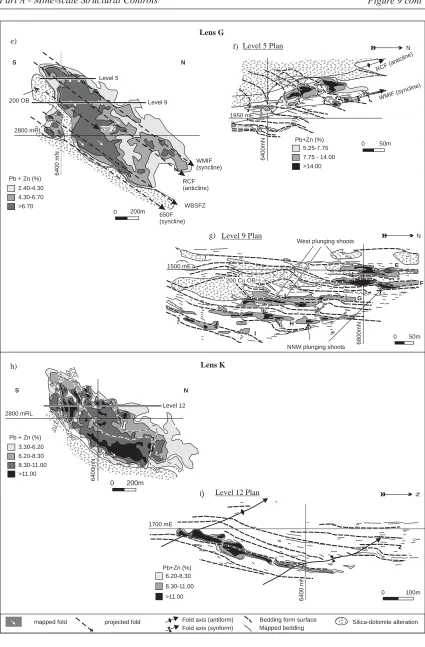
(27) Part A – Mine-scale Structural Controls. zones. The fold zones pinch out along strike and may narrow, bifurcate and/or pinch out with depth. An approximately 100 m-wide, N-S-striking corridor of unfolded, N-S-striking bedding exists in the middle of the mine. The short limb areas of the major F4 fold zones have been named and are shown in Figure 5. Folds along the margins of the fold zones are referred to as either the anticline or the syncline of the couplet. For example, the fold on the WSW margin of the Black Star fold zone is termed the Black Star anticline. The 650 fold zone is the largest and most southerly in the Lead Mine and hosts the 650 copper orebody. The Mount Isa fold zone at the north end of the mine is a large, east-verging, asymmetric fold that can be traced through all levels of the mine and is persistent across the mine. Close examination of the fold zones shows that they contain folds with N-S and NE-SW-trending axes (Fig. 6), but consistent orientations are not clearly distinguishable on an equal area projection. This is most likely the result of reactivation and rotation of D2 structures during D4 because of the similar orientations of σ1 during the two deformations (cf. Adshead-Bell and Bell, 1999; Timms, 2002).. Geometric Analysis of the Ores. The spatially separate copper and Zn-Pb-Ag orebodies are exploited through three main mine workings (Fig. 2). The Copper Mine, located in the south, is dominated by the 1100 and 1900 copper orebodies, where the Basement Fault attains its highest structural level at 2500 mRL, with only minor Zn-Pb-Ag ore (Fig. 2c). Conversely, in the Lead Mine, Zn-Pb-Ag ores dominate and the Basement Fault is up to 500 m deeper (at 1990 mRL). Several small copper orebodies are located at the south end of the Zn-Pb-Ag lenses in the Lead Mine. Approximately 100 m vertically below the base of the Zn-Pb-Ag lenses in the Lead Mine is the top of the Enterprise Mine which contains the 3000 and 3500 copper orebodies adjacent to the Basement Fault.. Geometry of Zn-Pb-Ag lenses The Zn-Pb-Ag lenses are separated into two groups based on their arrangement, termed the Black Star and Racecourse domains (Fig. 4). These names are not directly related to those of the fold zones already defined. The Black Star domain contains two Zn-Pb-Ag lenses (B and C) and the Racecourse domain contains eight (D to K). South of 7000 mN the domains are separated by barren host rocks and the 200 copper orebody. This barren zone is not present between the domains in the north where the deposits occur continuously over a stratigraphic thickness greater than 500 m.. T. P. Davis, PhD 2004. A-7.
(28) Part A – Mine-scale Structural Controls. The Racecourse domain comprises NNE-SSW to N-S-striking, Zn-Pb-Ag lenses, each typically 30 m across strike (ranging from 10 to 50 m) and 600 m along strike, arranged in an en echelon array with NNW-SSE-striking enveloping surfaces (Figs. 4 and 7). The ENE enveloping surface coincides with the hinge of the Mount Isa anticline. The WSW enveloping surface coincides with either the hinge of the 650 anticline or the ENE boundary of the silicadolomite halo around the 200 copper orebody (Fig. 4). The highest Pb+Zn grades of individual orebodies are situated adjacent to the WSW enveloping surface and gradually decrease towards the north (Fig. 7). The Black Star domain strikes N-S, has a maximum across-strike width of 200 m, and extends for more than 1.2 km along strike. High grade mineralisation terminates near the Mount Isa anticline to the north and in the short limb of the 650 fold in the south. The Black Star domain is adjacent to the footwall of the 650-500 copper orebody. Individual Zn-Pb-Ag lenses are sheetlike bodies with a long axis up to 1.2 km long and plunging in the range of 23-60o towards 323-348o (Figs. 8 and 9). In drill core and underground exposures the ores comprise semi-massive to massive, sheetlike, nearly conformable sulphide bands and breccias typically up to 40 cm thick and interlayered with unmineralised siltstones. Bedding in mineralised packages may be straight or exhibit intensive folding (Fig.10). The intermediate axes of the Zn-Pb-Ag lenses are between 250 and 700 m. This dimension decreases from west to east across the deposit. An abrupt decrease in the grade of the Zn-Pb-Ag lenses occurs at the hinge of the Mount Isa anticline in the north and the 650 fold in the south. Low grade ores are present on the north side of the Mount Isa fold couplet, where drilling has been sporadic. The geometries of the Zn-Pb-Ag lenses are clearly illustrated in contoured longitudinal sections (Fig. 9). All lenses are composed of narrow high grade shoots. These may have simple shapes, such as the NNW-plunging shoots in lenses B, C, H, I, J, and K, or complex shapes where more than one shoot can be identified. Zn-Pb-Ag lenses that abut the 200 copper orebody (E, F, and G) have complexly-shaped high grade shoots, the southern margins of which are concave where they terminate against the 200 silica-dolomite body (Fig. 9e). Here, two NNWplunging shoots occur along the upper and lower margins of the Zn-Pb-Ag lens, with a third plunging down the dip of bedding between them and immediately north of the 200 silicadolomite front (Fig. 9e). When considered separately in individual Zn-Pb-Ag lenses, zinc and lead display the same grade distribution with contours having the same shape as those for the total metal. However, the zinc is situated further from the copper ores than the lead (Fig. 11). Silver correlates with lead (r = 0.87) so it was not considered individually here.. T. P. Davis, PhD 2004. A-8.
(29) Part A – Mine-scale Structural Controls. Geometry of copper orebodies The copper orebodies are dominantly NNW-plunging. The largest copper orebodies are situated adjacent to the Basement Fault (e.g., 3000 and 3500 orebodies), whereas those distal to the fault, such as the 650, 500 and 200 orebodies, are much smaller. Copper orebodies are enveloped by silica-dolomite alteration that extends to the fault (Fig. 2). The 650 and 500 copper orebodies are situated in the western part of the Lead Mine in the structural hanging wall of the Zn-Pb-Ag deposits. It is evident from the plans that these orebodies are bifurcated fingers of a single body with NNW-SSE-striking and N-S-striking portions represented by the 650 and 500 orebodies, respectively (Fig. 12). The 500 copper orebody is a vertically-dipping, flattened cigar-shaped body that plunges 25°N (Fig. 12b). The 650 orebody plunges 40° towards 340° and extends for 500 m down plunge (Fig. 12c). Copper grades are highest and the combined body has its largest down dip and across strike extents where the 500 and 650 orebodies intersect. The 200 copper orebody has lower grade and is situated in the centre of the Lead Mine along the WSW enveloping surface of the Racecourse Zn-Pb-Ag domain (Fig. 4). These orebodies and the Zn-Pb-Ag ores have similar geometries. The 3000 orebody consists of an en echelon series of N-S-striking, high grade shoots with a NNW-SSE-striking enveloping surface (Fig. 12). Individual shoots are up to 80 m wide and extend 220 m up dip of bedding from the Paroo Fault. They dip shallowly to the west near the fault and become progressively steeper up dip. The overall plunge of the 3000 orebody is 32° towards 324°. The 3500 orebody is a 500 m long N-S-striking, steeply west-dipping body located east of the 3000 orebody (Figs. 12d and e), and extends up dip of bedding for 320 m. Overall the 3500 orebody plunges 35° towards 339°. Together, the 3000 and 3500 copper orebodies have the same shape as the combined Racecourse and Black Star Zn-Pb-Ag domains (cf. Figs. 4 and 12d).. Comparison with structure Copper orebodies: The copper orebodies are located in the short limbs and hinges of asymmetric folds. Figure 2 shows that the 1100 orebody is located on the synclinal hinge and short limb of a large fold at the contact between the Mount Isa Group units and the Eastern Creek Volcanics, as first noted by Perkins (1984). The 650 and 500 orebodies in Figure 4 are centred on the short limb of the 650 fold bounded by the associated antiform and synform. The 200 orebody is located in the short limb region of the Black Star Fold (Figs. 4, and 9g). Here, silica-dolomite alteration and copper mineralisation were constrained by intrafolial folding of the rocks in the orebody between surrounding unfolded and unmineralised rocks. The 3000 and 3500 copper orebodies are located on the limbs of mine-scale folds in a. T. P. Davis, PhD 2004. A-9.
(30) Part A – Mine-scale Structural Controls. manner similar to the Zn-Pb-Ag orebodies (Figs. 4 and 12d). The external geometry of the 3000 orebody is constrained by the Basement Fault and the Mount Isa anticline. The 3000 orebody is located on the southern long limb of the Mount Isa fold whereas the 3500 orebody is located on the northern long limb. High grade shoots within the orebody are parallel to the plunge of F4 hinges, but it is difficult to precisely map fold structures within the orebodies as the fabrics were destroyed during mineralisation.. Zn-Pb-Ag lenses: At all scales there is a close correlation between folds and the Zn-PbAg ores (cf. Figs. 4 and 9). At the mine-scale, the Zn-Pb-Ag lenses are located between the anticlinal hinges of the 650 and Mount Isa folds. Overlapping grade distribution and structural maps show that folds are also located centrally to NNW-plunging high grade shoots that host the bulk of the ore, as illustrated in Figure 9. However, the west-plunging shoots in orebodies abutting the 200 copper orebody are more complicated and bedding is not folded in them at the mapped scale (Fig. 9g). East of the 200 copper deposit the H-K lenses consist of a single broad NNW-plunging shoot hosted in a large short limb zone in which bedding strikes NNE-SSW, whereas in the long limbs bedding strikes N-S (Figs. 9 h and i). The highest total metal grades are concentrated along the lower margins of the lenses and there is a rapid decrease in grade where the strike of bedding changes to N-S, indicating a clear relationship between bedding orientation and ore grade. Contours of decreasing metal grade away from the high grade shoots are parallel to F4 hinges (Figs. 9 a, c, e and h). Low grade ores extend onto the long limbs of folds that host the high grade shoots. Lens B demonstrates this where the northern boundary of high grade mineralisation coincides with the hinge of the Black Star anticline (Figs. 9 a and b). Here the locus of high grade ore (>7.75 % Zn + Pb) is centred on a parasitic fold on the southern long limb of the Black Star fold and has an across-strike width of 70 m. The grade gradually decreases towards the 650 fold in the south. On the northern long limb of the Black Star fold, high grade ore occurs in three narrow bedding parallel shoots, each approximately 10 m across strike so the overall grade is much lower. On longitudinal sections there is a clear boundary to the high grade ore which is coincidental with the folds. Ore in the vicinity of the Mount Isa anticline has a similar grade distribution but the pattern is less obvious because the grades are lower.. T. P. Davis, PhD 2004. A-10.
(31) Part A – Mine-scale Structural Controls. Zoning patterns In both cross section and plan, zones of high grade Pb+Zn have a tabular, stratiform appearance (Fig. 7a-c). Zn-Pb-Ag lenses are grouped around the copper orebodies with the highest Pb+Zn grades proximal to them as illustrated by cross sections through the Lead Mine (Fig. 7). Grade contours are parallel to F4 hinges and silica-dolomite boundaries. Contours of Pb/Zn ratios cut stratigraphy and are also parallel to silica-dolomite boundaries and F4 trends throughout the Lead Mine. The Pb/Zn contours are centred around, and highest Pb/Zn values are proximal to the copper orebodies at either the same structural level or at deeper levels in the Enterprise Mine (Figs. 7d-f).. Distribution of low grade populations Cumulative frequency plots of the grades were examined to determine if multiple populations existed in the data that were not evident in the grade maps of the deposit. Where a possible second population was identified the samples were plotted on indicator maps to determine their spatial distribution. A single population will plot as a sigmoidal curve when the data is normally distributed (Fig. 13a). Deviations from this may indicate the presence of multiple populations, which may reflect remobilisation, multiple episodes of mineralisation, or other variations in structural or chemical characteristics of the deposit. Most of the Zn-Pb-Ag lenses have grade distributions that indicate the presence of a separate low grade population in the samples but they are small and overlap with the main distribution, which makes them difficult to separate (e.g., Fig. 13a). In lens B there is a discernable separation between low grade samples (<1.2% Pb and <1.2% Zn) and higher grade samples. Zinc-poor samples group together in a north-plunging cluster in the lower part of lens B (Fig. 13b) and are dispersed above this cluster. Lead-poor samples cluster in the north with a north-plunging upper surface (Fig. 13c).. Discussion and Conclusions. The observations presented here strongly support a syn-D4 timing for the development of the present geometries of the Zn-Pb-Ag orebody. This is indicated by the close spatial correlation between the ores and F4 folds at all scales, both along the margins of the Zn-Pb-Ag lenses and within them. High grade shoots are centred on the hinges and short limbs of NNWplunging D4 folds, and contours defining metal zonation are parallel to F4 hinges and silicadolomite fronts throughout the mine (Figs. 9 and 10). Similarities between the geometries of the Zn-Pb-Ag lenses and the copper ores, which. T. P. Davis, PhD 2004. A-11.
(32) Part A – Mine-scale Structural Controls. are interpreted to have formed during D4 (Perkins, 1984; Swager, 1985; Bell et al., 1988; Waring et al., 1998), suggests that both ore types had the same structural history. Folds control the overall geometries of the 1100, 650, 500 and 200 copper orebodies as well as the high grade shoots in Zn-Pb-Ag lenses. This is illustrated in Figure 9g, where silica-dolomite alteration associated with the 200 copper orebody is restricted to an area where bedding is folded, similar to the Zn-Pb-Ag shoots (Figs. 9d and f). The 3000 copper orebody and the collective Racecourse Zn-Pb-Ag lenses exhibit the same geometries in high and low grade areas, notably N-S-striking high grade orebodies with NNW-striking enveloping surfaces (in plan) indicating a strong influence from the structural anisotropy imparted by bedding. These deposits are located in the same structural domain (i.e., on the western long limb of the Mount Isa anticline) with the 3000 copper orebody situated vertically below the Racecourse Zn-Pb-Ag lenses. This relationship is evident at a larger scale than the folds hosting the high grade Zn-Pb-Ag shoots described above. Some aspects of the Zn-Pb-Ag lenses indicate that their geometry was established after silica-dolomite alteration. Zn-Pb-Ag lenses abutting the 200 copper orebody, as shown in Figure 9e, enfold the silica-dolomite body that contains the copper orebody. This pattern suggests that the silica-dolomite alteration, which Perkins (1984) and Swager (1985) interpreted as syntectonic, predates the Zn-Pb-Ag shoots, and the geometries of the Zn-Pb-Ag lenses were locally controlled by the presence of copper ores, or more precisely their enveloping silicadolomite alteration. This feature is not the result of localised remobilisation around the silicadolomite body because the grade distribution that defines it is continuous through the entire ZnPb-Ag orebody. Rather, it may reflect more widespread fluid-assisted remobilisation and/or syntectonic mineralisation. The proximity of the Zn-Pb-Ag ores to copper orebodies, the lack of overprinting between them, their common geometries and association with structures, and metal zonation patterns in the Zn-Pb-Ag orebodies that are centred about the copper orebodies may be interpreted as evidence of syntectonic mineralisation or in terms of remobilisation. On one hand, McDonald (1970) reported enrichment of galena in the hinge of a fold exposed in the underground workings and attributed this to remobilisation. However the patchy distribution of the highest grade contour of Pb+Zn (%) is not reflected in lower orebodies and the lead distribution, which should be the most sensitive to the enrichment of galena during folding, shows no indication of being deformed. Perkins (1997) argued the features described by McDonald (1970) could equally be interpreted as evidence for D4 mineralisation because there was no corresponding depletion on the limbs of the fold. The results of this study support the observations of Myers et al. (1996) and Perkins (1997) who showed that Zn-Pb-Ag orebody boundaries are parallel and coincident with large D4. T. P. Davis, PhD 2004. A-12.
(33) Part A – Mine-scale Structural Controls. folds. Marshall and Spry (2000) and McClay (1979) alternatively suggest that the D4 trends in the orebody reflect the structural controls on pre-existing syndiagenetic mineralisation, i.e. D4 controlled by syndiagenetic structures. A synsedimentary origin for the present geometries of the lenses can be excluded because reconstructions of the predeformation orientations are not consistent with this mode of formation. The enveloping surface to the initial stack of lenses in a synsedimentary setting was determined by rotating bedding to horizontal using a 59º clockwise rotation along the rotational axis to 006º and applying the same rotation to the present enveloping surface of the en echelon array of lenses (Fig. 14a). It was found that this surface would have dipped 46º to 222º. In this case, the orientation of the enveloping surface would reflect the structural controls on basin development in a synsedimentary environment or the structures controlling emplacement of the ores during diagenesis. The location of the highest total metal grades along the WSW enveloping surface indicates that sulphides would have accumulated on the NE block of a SWdipping fault that was the conduit for metal bearing fluids. If the orebody formed in a basin then the controlling structures must have had reverse movement, as shown in Figure 14b, which is inconsistent with the interpreted synsedimentary rift setting (e.g., Smith, 1969; 2000; Large et al. 1998; Cooke et al., 2000). Alternatively, if the basin margin faults had normal displacement then sulphides would have had to accumulate and be preserved on highs, which is unlikely (Fig. 14c). The preservation of older F2 folds in nearly their original orientations in F4 short limbs areas (Fig. 6) indicates that these NNW-SSE-striking F4 folds formed by rotation of bedding on the long limbs. This would require localised progressive shearing on the long limb and around the high grade shoots if the orebodies were present in their current positions prior to D4. This is inconsistent with the expected localisation of deformation in the massive sulphide bodies rather than around them (Marshall and Gilligan, 1987, 1993). Orebody formation during deformation can involve either syndeformation mineralisation or remobilisation of pre-existing massive, semi-massive, or disseminated sulphides or a combination of these processes (Marshall et al., 2000). It is arguable as to whether remobilisation can ever be entirely ruled out in orebody formation (Marshall and Spry, 2000; Marshall et al. 2000). However, without evidence of a pre-deformation deposit remobilisation is difficult to substantiate. In any case, the results of this study suggest that the Zn-Pb-Ag mineralisation was broadly synchronous with the late stage copper orebodies. There is no indication of a source deposit overlapping with the Zn-Pb-Ag lenses in the large scale metal distribution patterns. However, this does not discount the possibility that a source deposit in the vicinity was of a grade too low to be recognised in these patterns. A small. T. P. Davis, PhD 2004. A-13.
(34) Part A – Mine-scale Structural Controls. low grade population, as indicated in Figure 13 may be an indication of an earlier low grade and possibly disseminated Zn-Pb-Ag deposit overlapping with the present orebody. However, this low grade mineralisation follows an F4 trend (Fig. 13b and c), and is only obvious in one of the ten Zn-Pb-Ag lenses. It is therefore more likely that the low grade population reflects the same structural controls on metal deposition exhibited by the main orebody. If remobilisation processes played a role in the formation of the Mount Isa Zn-Pb-Ag lenses, based on the observations of this study the source would have been distal to the present orebody. The termination of the Urquhart Shale against the Paroo Fault below the copper orebodies (cf. Figs. 2b and c) and the lack of zinc or lead anomaly in these orebodies indicate that a source deposit for the present Zn-Pb-Ag orebody was not located between the current ZnPb-Ag ores and the Paroo Fault. The other possible location for an external Zn-Pb-Ag protore is north of the Mount Isa fold and present Zn-Pb-Ag deposit, which requires fluid flow in the opposite direction of the copper mineralising fluids (cf. Waring, 1990) to form the present ZnPb-Ag orebody. F4 short limbs containing older folds at the centre of high grade shoots were important in the localisation of metals in the Zn-Pb-Ag orebody. These are interpreted to have behaved as structural heterogeneities that were centres of strain incompatibility during D4 and resulted in dilation which facilitated fluid movement into these areas where metals were then deposited. These folds occur throughout the Zn-Pb-Ag orebody but those closest to the copper orebodies have the highest grade, indicating decreasing metal deposition away from the copper orebodies as fluids became progressively depleted in ore metals and/or concentration of fluid flow near the copper orebodies. Strain localisation in less competent units played an important role in the formation of this deposit in two ways, it permitted the fluids access to only specific parts of the rock producing the stratiform ores at low grades and secondly, structural heterogeneities formed by unevenly distributed deformation within those units concentrated metals into high grade shoots. Where early F2 folds are located on the short limbs of the F4 folds, the structural heterogeneity likely enhanced fluid flow and promoted the formation of high grade shoots. Where the older F2 folds were absent, such as in the Mount Isa fold, there was no heterogeneity and high grade shoots were not developed.. T. P. Davis, PhD 2004. A-14.
(35) Part A – Mine-scale Structural Controls. Acknowledgements. The author gratefully acknowledges his supervisor, Prof. Tim Bell, and associate supervisor, Dr Andrew Allibone, in this study. Drs. Tom Blenkinsop and Tim Baker provided valuable comments on the manuscript. Funding and data were provided by MIM Limited; Alice Clarke, Steve Law, Ron Eggins and the Lead Mine Geologists are especially thanked. Micromine Pty Ltd and Surpac Software International Pty Ltd contributed software used in the study. This paper benefited significantly from the reviews and suggestions of Drs. Cees van Staal (Geological Survey of Canada) and Mike Solomon (University of Tasmania, CODES) and the additional comments of the Editor and a member of the Editorial Board, for these the author is greatly appreciative.. T. P. Davis, PhD 2004. A-15.
(36) Part A – Mine-scale Structural Controls. Table 1. Summary of Cover Sequences Sequence. Description. Age (Ma). Cover Sequence 4. Basal Surprise Creek Formation; conglomerate, sandstone and siltstone. Thought to be deposited in an alluvial fan or shallow marine environment. Overlain by the shallow marine Mount Isa Group (which comprises siltstones and carbonates.. Cover Sequence 3. References. >1652. O’Dea et al. (1997). Basal conglomerate and sandstone of the Bigie Formation overlain by the bimodal Fiery Creek Volcanics. 1710-1709. O’Dea et al. (1997). Cover Sequence 2. Basal Bottletree Formation comprising bimodal volcanic and clastic sedimentary rocks overlain by the Mount Guide Quartzite then the extensive basaltic Eastern Creek Volcanics (up to 6 km thick) and clastic sediments and carbonates of the Myally Subgroup and Quilalar Formation.. 1790-1760 or 1720. Blake and Stewart (1992) O’Dea et al. (1997).. Cover Sequence 1. Felsic Leichhardt Volcanics that are coeval with the Ewen and Kalkadoon Batholiths. Related to the Barramundi Orogeny rather than rifting. Yaringa Metamorphics in the Western Fold Belt, Kunbayia Migmatite in the Kalkadoon-Leichhardt Belt.. 1870-1850. Blake and Stewart (1992). 1890-1870. Blake et al., (1990). Basement. Table 2. Correlations between the Zn-Pb-Ag Lenses Used in This Study and The System of ‘Orebodies’ Used at the Mine.. Orebody1 B C D E F G H I J K 1. Previously Defined Included Orebodies 0001, 0002 0005 0560, 5110 5200, 0006 0007, 0720 0008, 0009, 0010 0011, 1130 0012, 0013 1320, 1380 1312, 1314, 0014, 1410, 1430. Value of 80th percentile Pb (%) Zn (%) 5.30 5.60 5.80 6.80 3.60 4.05 4.60 6.30 5.10 5.20 6.10 3.80 4.30 5.20 4.00 5.80 3.30 4.50 5.30 5.95. Zn-Pb-Ag Lenses are based on ten Pb+Zn peaks in the modelled grade distribution of level 12.. (see Figs.4 and 7). T. P. Davis, PhD 2004. A-16.
(37) Part A - Mine-scale Structural Controls. Figure 1. N. a). Townsville. o. 20 S. Mount Isa. 2500 mE. b). F4 0. F4 53. 7000 mN. 100 Km. 140oE. 65. N. Western Fold Belt Leichhardt River Fault Trough Kalkadoon-Leichhardt Belt. Paroo Fault. Mount Isa Fault. Eastern Fold Belt 57. Mount Isa Fold 60. 500 m. 0 Magazine Shale. Copper Deposits. Kennedy-Spear Siltstone. Zn-Pb-Ag Deposits. Urquhart Shale. Fault. Native Bee Siltstone. 60. Bedding Orientation. Eastern Creek Volcanics. Figure 1. Locality map of the a) Mount Isa Inlier and b) Mount Isa deposit. Modified after a) Blake and Stewart (1992) and b) Perkins (1997).. T. P. Davis, PhD 2004. A-17.
(38) Part A - Mine-scale Structural Controls. Figure 2. a) Plan 650 OB 500 OB. 1500 mE. 1100 OB. Lead Mine. 1900 OB. 1100 OB. Section in (b). 1900 OB. 6000 mN. N. Copper Mine. Paroo Fa. ult. W. Lead Mine. E Racecourse Level orebodies 5. Lead Mine. S. N. Su. Copper Mine. 9. ing. Fo. rm. 650 OB. 500 m. 3000 mRL. rfa. 200 OB. c) Longitudinal Section Facing West. ce. b) Section Facing North. 0. dd. 12. Be. 500 OB. 2500 mRL. 6000 mN. 15. Enterprise Mine. 0. 500 m. Zn-Pb-Ag lenses. Paroo Fault. Urquhart Shale. Cu deposits. Mine scale F4 fold axes. Eastern Creek Volcanics. Silica-Dolomite. 00. Kennedy-Spear Siltstone. Mine outlines 500 OB: Copper orebody name. 35. Enterprise Mine 3000 OB. OB. 19. Base. 0. 200 m. Fault. 1800 mE. ment. Figure 2. Mine layout and mine scale distribution of copper and Zn-Pb-Ag orebodies at Mount Isa. a) Level 17 plan showing deposit-scale separation between copper and Zn-Pb-Ag. b) Section looking north through 6510 mN intersecting the Lead and Enterprise mines and showing the geometry of the Paroo Fault (Basement Fault portion) below the deposits and the relationships between the fault, the orebodies and their associated alteration halos. Note that the Racecourse Zn-Pb-Ag lenses are vertically above the 3000 copper orebody. Both are located on the same limb of the Mount Isa fold and have the same geometries indicating a common deformation history. c) Longitudinal section looking west.. T. P. Davis, PhD 2004. A-18.
(39) Part A - Mine-scale Structural Controls. Figure 3. op. e=. 1. 100 Sl. Wall Chip Samples Pb+Zn %m (log). 1000. 10 10. 100 Diamond Core Samples Pb+Zn %m (log). 1000. Figure 3. Log-log plot of wall chip and core samples in percent meters (%m), obtained by calculating the product of the average grade of individual intersections by the perpendicular width of the orebody. This plot compares deciles from each data source to determine biases based on the sample type (Isaaks and Srivastava, 1989). A data set with no biases between the variables being compared will plot as a straight line with a slope of 1. The deviation from the straight line demonstrates there is bias for higher grades in drill core compared to wall chip samples. There are over 514,000 samples in the data set.. T. P. Davis, PhD 2004. A-19.
(40) Part A - Mine-scale Structural Controls. Figure 4. N. C Black Star Domain. Racecourse Domain. D. ng opi vel En. B Bla. F. r Sta. e rfac Su. ck Fo lds. E H I G Mo unt Isa Fol. nM. ter. ds. s We. 6800mN. lds. urfa. Fo. gS. Isa. pin. nt. elo. ou. Env. 650 Cu OB. ce. J 200 Cu OB. our. cec. Ra. 500 Cu OB. se st We. ds. Fol ern Ra cec Fo lds. rfa ce. ). m for syn. Su. ld (. ing. Fo. lop. 650. ve. se. En. our. K. 0 65. Pb+Zn >7.75%. ld Fo ). rm. tifo. Lens name. (an. Major fold axis. B. 1600 mE. Silica-dolomite. 0. 100 m. Figure 4. Level 12 (2910 mRL) plan of Pb+Zn > 7.75 % and silica-dolomite alteration in the Mount Isa Lead mine. Zn-Pb-Ag lenses are labeled B-K. Lenses B and C comprise the Black Star domain and lenses D-K the Racecourse domain. The silica-dolomite alteration halos to the main copper orebodies in the Lead mine occur on the WSW side of the Zn-Pb-Ag deposits. Major folds are labeled. See Figure 5 for structural measurements.. T. P. Davis, PhD 2004. A-20.
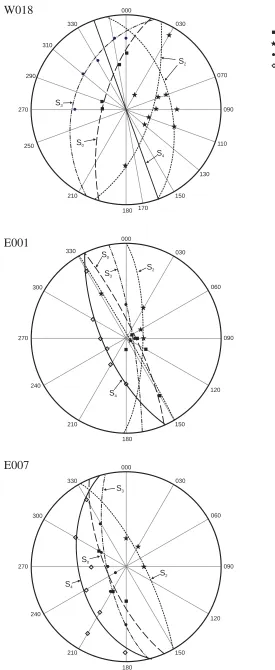
(41) Part B - Formation of Folds Controlling Mineralisation 1650 mE. Figure 7. 79. b) 67. 81. 85. M73 inc 17B. N. 80. 81. E004. 7400 mN. 65. 10 m. 0. 65 75. 85. Bedding surface. 71. 65 69 87 69. 74. 66 72. 84. 69. 82. 48. 69 W011. E002 54. 65 66. 69. 71. 80. 7350 XC 17B L W002. 60. ? 78. E001 65. 60. a). 83 70. 65. 87. 75. 7350 XC 17L. 70 25. 71. 7400 mN 76 N. Legend. 80. 81 83. S0. S3. S2. S4. 85. 0. 7300 mN. 25 m. 85. c). S0. 85. 7200 mN. Beta axis. Bedding surface 86. 85 75. 7100 mN. % 65. n = 294 88. 72. 69 71. 70. 70. 1 2 4 8 16. 86. 72. 7000 mN. E007. T. P. Davis, PhD 2004. 1700 mE. 1600 mE. 80 80 76. High Strain Zone. B-23.
(42) Figure 5. a) Bedding plan in the Lead Mine at Level 9 (3080 mRL). NNW-SSE-striking fold zones are defined by bedding orientations that deviate from the dominant N-S to NNE-SSW-striking fabric. Fold zones are labelled and can be correlated throughout the mine. The inset lower hemisphere equal area projection shows poles to bedding and illustrates a spread of bedding orientation from N-S to NE-SW-striking. The girdle and axis are plotted. A modified Schmidt contouring method was used. b) Section oriented normal to the fold zones, along A-A'. From left to right the fold zones are, 650, Western Black Star (WBS), Black Star (BS), Western Racecourse (WR), Racecourse (R), Western Mount Isa (WMI), and Mount Isa (MI). Silicadolomite alteration overlaps with the short limb areas, and high grade shoots are vertically above or below, or overlapping the folds..
(43) Part A - Mine-scale Structural Controls. 1950 mE. Figure 6. Level 5 (3290 mRL). F4. 50 56. 6230 mN. 56. 55 56. 55 46. F4 55. 35 48. F4. 62. 50. N. 50 80 64 41. 55. 45. F2 F2. F2. b. 79. F4. ort. lim. h ds. ol. eF. e. orm. urs. o ec. c. Ra. d. ed. sb. os Gr. f ing. lin. 0. 5m. Fold axis Shear zone Bedding surface. N. % 1 2 4 8 16. n = 408. Figure 6. Cross cut (S61 NE XC) map of the Racecourse Fold Zone on the 5 Level. The fold zone is bounded by NNW striking F4 folds. Within the short limb of the large asymmetric fold, folds of various orientations are preserved. Outside of the fold zone straight bedding persists. At this locality high grade Zn-Pb-Ag ore is confined to the short limb. An equal area projection of fold axes from short limb zones of mine scale NNWSSE striking asymmetric folds shows a spread of orientations between NW-SE to NNE-SSW that reflect the different generations of folds in the area.. T. P. Davis, PhD 2004. A-22.
(44) 0. 1600 mE. 0. 200 m. 200 Cu OB. 200 m. 200 Cu OB. d) Metal ratios (Pb:Zn):. 1600 mE. B’. B. B’. 500 Cu OB. B 500 Cu OB. 650 Cu OB. PLAN. 650 Cu OB. PLAN. 6800 mN 6800 mN. C’. C. C’. C. 3000 Cu OB. 0. B. 3000 Cu OB. 3200 mRL. 0. 200 Cu OB. e) SECTION BB’ (facing north). B. 650/500 Cu OB. Silica-dolomite alteration. 0.00-0.33 0.33-0.50 0.50-1.00 1.00-2.00 2.00-3.00 >3.00. Pb:Zn (ratio). N. 3200 mRL 650/500 Cu OB. 0.00-1.25 1.25-2.75 2.75-5.25 5.25-7.75 7.75-14.00 >14.00 Silica-dolomite alteration. Pb+Zn %. N. 200 Cu OB. b) SECTION BB’ (facing north) 1600 mE 1600 mE. T. P. Davis, PhD 2004 200 m. B’. 200 m. B’. 0. 3000 Cu OB. C. 3200 mRL. 0. f) SECTION CC’ (facing north). 3000 Cu OB. C. 3200 mRL. c) SECTION CC’ (facing north) 1600 mE 1600 mE. a) Total metal (Pb+Zn):. 200 m. C’. 200 m. C’. Part A - Mine-scale Structural Controls Figure 7. A-23.
(45) Figure 7. Modelled grade distribution plans (Level 12, see Fig. 4) and sections that display total metal content (a, b, and c) and the ratio of Pb to Zn (d, e, and f). Total metal (Pb+Zn) plots demonstrate the stratabound appearance of the Zn-Pb-Ag ores in these projections, whereas the metal ratio (Pb/Zn) highlights the transgressive nature of the metal distribution as well as the change in metal ratios in the Zn-Pb-Ag deposit with proximity to silica-dolomite which envelopes the copper orebodies. a) Total metal plan of Level 12. b) Section through the Lead Mine that includes the 650, 500 and 200 copper deposits (see Fig. 2b). c) Section that does not include a copper deposit within the Zn-Pb-Ag environment, however copper deposits are located below the base of the section in the Enterprise Mine (see Fig. 2b). d) Level 12 plan of metal zonation. The highest Pb/Zn values are clustered around copper/silica-dolomite bodies. e and f) Sections through ZnPb-Ag. Highest Pb/Zn values are adjacent to silica-dolomite bodies..
(46) Part A - Mine-scale Structural Controls. Figure 8. N. n = 10. Figure 8. Lower hemisphere equal area projection of long axes of Zn-Pb-Ag lenses. T. P. Davis, PhD 2004. A-24.
(47) Part A - Mine-scale Structural Controls. Figure 9. Lens B. a) S. N Level 5. MIF (anticline) RCFZ. Pb+Zn (%) 3.00-5.50 5.50-7.75. 6400 mN. 2800 mRL. >7.75. BSFZ 650F (syncline) 0. 200m. b). Level 5 Plan. N. Black Star asymmetric fold. 650 asymmetric fold. 6400mN. 1600 mE. Pb+Zn (%) 5.25-7.75. Mount Isa Fold 0. 200 m. 7.75 - 14.00 >14.00. Lens C. c) S. N. Level 12 2800 mRL. 7.25 - 9.5. 6400 mN. Pb+Zn (%) 4.25 - 7.25. MIF(anticline). >9.5. RCFZ 65. 0. 200m. 0. 65 (a. nt. 0. icl. (s yn c ine line ) ). BSFZ. Level 12 Plan. N. 6400 mN. d). 1520 mE. Pb+Zn (%) 5.25-7.75. 0. 50 m. 7.75 - 14.00 >14.00. mapped fold. T. P. Davis, PhD 2004. projected fold. Fold axis (antiform) Fold axis (synform). Bedding form surface Mapped bedding. Silica-dolomite alteration. A-25.
Figure


+7
Related documents
J., 2000, The structural and metamorphic development of the Soldiers Cap group SE of Cloncurry; implications for the orogenic development of the Eastern Fold Belt of the Mount
Using these criteria, the paragenesis of the deposit can be broken down into prograde (Stage I, peak metamorphic), retrograde, (Stage II, retrograde alteration) and late
