University of Southern Queensland
Faculty of Engineering & Surveying
Life Cycle Assessment in Electronics
A dissertation submitted by
Adrian Supurmaniam
in fulfilment of the requirements of
Courses ENG4111 and ENG4112 Research Project
towards the degree of
Bachelor of Engineering (Electrical and Electronics)
Abstract
Our planets resources are being consumed at an extremely unsustainable rate. Renewable resources are being used up before they can replenish themselves, and non-renewable resources are depleting fast. In our current situation, it is not enough to merely recycle materials. Usually, by the time a product is manufactured, the damage is already done by overuse of materials, the use of non-sustainable materials and processes, and also by materials and processes that pollute the environment.
Life cycle assessment is the ‘cradle to grave’ analysis of a product, in order to identify the sources of excessive material consumption, and also manufacturing processes that cause pollution. Through the results of an LCA analysis, it is then possible to make decisions and improvements to current designs and processes. In the field of electronics, for example, the manufacture of Printed Circuit Boards can cause water and air pollution if not done properly. However, through Life Cycle equivalent studies, standards have now been developed for the proper and sustainable development of printed circuit boards. The same applies to many other electronic components and devices.
In this research project, all preceding work and studies on the subject matter has been covered. The current methodology for an LCA study has been covered from an International Standards Organization requirement standpoint. Finally, a suitable electronic product, a Calculator has been chosen for this study due to its similarity in terms of main components (Plastic outer casing, printed circuit board, smaller electronic components, rubber keypad, glass screen, and a battery).
From this, the methodology was implemented in the chosen LCA software (SimaPro v5.1), and Impact assessments were performed on the Calculator based on selected Impact assessment methodologies, then thorough sensitivity analysis was performed in order to check the validity and to justify all choices for data (materials and processes as well as disposal procedures). Finally, Improvement assessments have been made, for ease of comparison with other similar products. Any ideas for future
University of Southern Queensland
Faculty of Engineering and Surveying
ENG4111 & ENG4112
Research Project
Limitations of Use
The Council of the University of Southern Queensland, its Faculty of Engineering and Surveying, and the staff of the University of Southern Queensland, do not accept any responsibility for the truth, accuracy or completeness of material contained within or associated with this dissertation.
Persons using all or any part of this material do so at their own risk, and not at the risk of the Council of the University of Southern Queensland, its Faculty of Engineering and Surveying or the staff of the University of Southern Queensland.
This dissertation reports an educational exercise and has no purpose or validity beyond this exercise. The sole purpose of the course pair entitled "Research Project" is to contribute to the overall education within the student’s chosen degree program. This document, the associated hardware, software, drawings, and other material set out in the associated appendices should not be used for any other purpose: if they are so used, it is entirely at the risk of the user.
Prof G Baker
Dean
Certification
I certify that the ideas, designs and experimental work, results, analyses and conclusions set out in this dissertation are entirely my own effort, except where otherwise indicated and acknowledged.
I further certify that the work is original and has not been previously submitted for assessment in any other course or institution, except where specifically stated.
Adrian Supurmaniam
Student Number: 0031034341
______________________________ Signature
Acknowledgements
This research was carried out under the supervision of Mr. David Parsons from the Faculty of Engineering at the University of Southern Queensland. I would like to thank him for his continuous assistance and patience during the course of my research.
Special thank must also go to Tim Grant, the Assistant Director at the Centre for Design at The Royal Melbourne Institute of Technology for all his assistance.
Table of Contents
Abstract ... iii
Certification ...v
Acknowledgements...vi
Table of Contents...vii
List of Figures ...ix
Glossary of Terms...xi
Chapter 1 Introduction...1
1.1 Authorization, Limitations and Scope of Report ...1
1.1.1 Authorization ...1
1.1.2 Limitations ...1
1.1.3 Scope of Report and Overview of Project ...2
Chapter 2 Literature Review...3
2.1 Introduction and Background of Life Cycle Assessment ...3
2.2 Life Cycle Assessment Methodology ...5
2.2.1 Overview of ISO Life Cycle Assessment Methodology...6
2.3 Data Evaluation...7
2.4 Improvement Assessment ...8
2.5 Life Cycle Assessment in Australia...8
2.6 Life Cycle Assessment and Electronics...9
2.7 Motivations and Benefits of using LCA ...10
2.8 Limitations of Life Cycle Assessment...11
Chapter 3 Methodology...12
3.1 Stage 1 - Inventory...12
3.2 Stage 2- Interpretation...13
3.3 Stage 3 - Improvement...13
Chapter 4 Life Cycle Assessment on a Calculator ...14
4.1 Justification of Product Selection ...14
4.2 The Calculator Scenario...16
4.3 Breaking Down the Product...18
Chapter 5 Compiling an LCA in SimaPro 5.1...20
5.1 Introduction to SimaPro...20
5.2 Learning to Use SimaPro...21
5.3 Applying the LCA Methodology in SimaPro ...22
5.3.1 Description of Project (Goal and Scope Definition)...22
5.3.2 Defining an Assembly in SimaPro...29
5.3.3 Defining Life Cycle and Disposal Scenarios ...30
5.4 Impact Assessment Methods and the use of Sensitivity Analysis ...32
Chapter 6 LCA Interpretation...33
6.1 Interpretation...33
6.2.1 System Boundaries and Capital Goods...34
6.2.2 Regional Aspects ...35
6.2.3 Representativity ...35
6.3 Contribution Analysis ...36
6.4 Anomality Assessment...37
6.5 Mismatch between Inventory and Impact Assessment...37
Chapter 7 Life Cycle Impact Assessment...39
7.1 Introduction to Life Cycle Impact Assessment...39
7.2 Eco-Indicator ’99 (Netherlands Impact Assessment Method)...40
7.2.1 Impact Assessment (Eco-Indicator ’99 Graphs) ...43
7.2.1 Impact Assessment (Eco-Indicator ’99)...45
7.2.2 Damage Assessment (Eco-Indicator ’99) ...46
7.3 CML 2 baseline 2000 Method ...47
7.3.1 Impact Assessment (CML 2 baseline 2000) ...48
7.3.1 Impact Assessment (CML 2 baseline 2000 Graphs)...49
7.4.1 Impact Assessment (CML baseline 2000 continued) ...51
7.4 EPS 2000 (Swedish Impact Assessment Method)...52
7.4.1 Impact Assessment (EPS 2000 Graphs) ...53
7.4.1 Impact Assessment (EPS 2000 continued) ...55
Chapter 8 Sensitivity Analysis ...57
8.1 Introduction to Sensitivity Analysis...57
8.2 Sensitivity Analysis with Eco-Indicator ’99...57
8.2 Sensitivity Analysis with Eco-Indicator ’99 (Graphs)...61
8.2 Sensitivity Analysis with CML 2 baseline 2000...68
8.2 Sensitivity Analysis with CML 2 baseline 2000...70
8.3 Sensitivity Analysis with EPS 2000 ...77
8.3 Sensitivity Analysis with EPS 2000 (Graphs) ...78
Chapter 9 Conclusions and Summary ...85
9.1 Achievement of Objectives...85
9.2 Impact Assessment of Sub-Assemblies ...85
9.3 Recommendations for Improvement...88
9.3 Proposal for Future Work ...88
List of References ...90
Appendix A Project Specification ...93
List of Figures
• Figure 4.1 - satellite map of the region with shipping route indicated
• Figure 4.2 - Assembly tree showing the sub-assemblies and materials / processes
• Figure 5.1 – Goal and Scope Definition Screen
• Figure 5.2 – Eco-indicator calculation process
• Figure 5.3 – Assembly Definition Screen
• Figure 5.4 – Sub-assembly Definition Screen
• Figure 5.5 – Life Cycle and Disposal Definition Screen
• Figure 7.1 - All original weights and materials (original assembly) without transport
• Figure 7.2 - All original weights and materials (original assembly) with transport
• Figure 7.3 – CML 2 - All original weights and materials (original assembly) without transport
• Figure 7.4 – CML 2 - All original weights and materials (original assembly) with transport
• Figure 7.5 – EPS 2000 - All original weights and materials (original assembly) without transport
• Figure 7.6 – EPS 2000 - All original weights and materials (original assembly) with transport
• Figure 8.1 – Eco - Changed quantity of HDPE B250 to 100g
• Figure 8.2 – Eco - Changed HDPE B250 Material to PP granulate average B250
• Figure 8.3 – Eco - Changed Battery from Alkaline to Li Ion
• Figure 8.4 – Eco - Changed Battery from Alkaline to Ni Cad
• Figure 8.6 – Eco - Changed Delivery Van (<3.5t) B250 to 16 t truck B250 with 50% load average
• Figure 8.7 – Eco - Changed Container Ship I to Bulk Carrier I
• Figure 8.8 – CML 2 - Changed quantity of HDPE B250 to 100g
• Figure 8.9 – CML 2 - Changed HDPE B250 Material to PP granulate average B250
• Figure 8.10 – CML 2 - Changed Battery from Alkaline to Li Ion
• Figure 8.11 – CML 2 - Changed Battery from Alkaline to Ni Cad
• Figure 8.12 – CML 2 - Changed Glass from White to Virgin
• Figure 8.13 – CML 2 - Changed Delivery Van (<3.5t) B250 to 16 t truck B250 with 50% load average
• Figure 8.14 – CML 2 - Changed Container Ship I to Bulk Carrier I
• Figure 8.15 – EPS - Changed quantity of HDPE B250 to 100g
• Figure 8.16 – EPS - Changed HDPE B250 Material to PP granulate average B250
• Figure 8.17 – EPS - Changed Battery from Alkaline to Li Ion
• Figure 8.18 – EPS - Changed Battery from Alkaline to Ni Cad
• Figure 8.19 – EPS - Changed Glass from White to Virgin
Glossary of Terms
• LCA - Life Cycle Assessment
• Assembly - Collection of materials and processes that make up a product
• Life cycle - The complete useful life of a product, including use- phase products (such as batteries for a calculator)
• ISO - International Standards Organization
• PCB - Printed Circuit Board
• LCD - Liquid Crystal Display
• EEP - Electrical and Electronic Products
Chapter 1
Introduction
1.1 Authorization, Limitations and Scope of Report
1.1.1 Authorization
The research done for this project was commissioned by the Faculty of Engineering and Surveying, at the University of Southern Queensland as part of the Engineering Research Project ENG 4111 / 4112. The main aim of this study of Life Cycle Assessment (LCA) is to conduct an LCA on a simple piece of electronic hardware, and to develop an efficient method of evaluating and weighting data collected in the data collection stage to be used in the process improvement assessment. Currently, there are many different methods of converting this data into useful information. However, there is much dispute over which method is superior. Therefore, I intend to expand on these methods in an effort to make Life Cycle Assessment more accessible to non-professionals.
1.1.2 Limitations
Some limitations were encountered in the process of my research. One of the main limitations was encountered in the data collection stage. This is due to the fact that since Life Cycle Assessment is still in it’s infancy, many corporations and research organizations find little need to publish such data. Some of the major research organizations as well as main software developers publish data lists for specific materials commonly used in production of physical products. The drawback is that such data is limited and information on more uncommon materials are usually not publicly available.
1.1.3 Scope of Report and Overview of Project
This report covers a background (Chapter 2) of Life Cycle Assessment, Methodology used in the study, Current ISO standards, LCA development in Australia, the use of Life Cycle Assessment in Electronics, as well as the motivations and limitations of using LCA. It also covers the methodology used (Chapter 3) for the completion of this research project.
The next stage of this report (Chapter 4) covers the breakdown of the product being studied (calculator), as well as a justification for this product selection and the construction of a theoretical scenario in order to make this study as realistic as possible.
A guide is given (in Chapter 5) on the proper usage of the LCA software used in this study, which was SimaPro v5.1 (which was later replaced with SimaPro v6).This guide covers methods on defining an assembly in SimaPro, as well as defining lifecycles and disposal scenarios. It also covers the use of Impact Assessment methods and the use of Sensitivity Analysis.
An Interpretation of the LCA performed is provided according to ISO 14042 standards in Chapter 6. A life Cycle Impact Assessment is performed and analyzed in Chapter 7, and a Sensitivity Analysis is performed on this assessment in Chapter 8.
Chapter 2
Literature Review
2.1
Introduction and Background of Life Cycle Assessment
This chapter is written with the purpose of reviewing past and current literature which is relevant to the issue of Life Cycle Assessment. The reason for this review is to identify LCA concepts and ideas that have already been developed. This will prove the need for LCA to be incorporated by companies in their products, processes and other activities. In my literature review, I will address a few important points, which are:
• the different stages that a researcher must complete in conducting an LCA,
• different approaches taken in evaluating raw data acquired, and
• how the information can be used in directing company policies and decisions.
• Some of the benefits of using LCA, as well as motivation to use it, and
• The use of LCA in the electrical / electronics field.
In early times, people as a society did not worry about the issue of sustainability. The idea was that raw materials and fuels would last infinitely, and the environment would keep regenerating itself regardless of the amount of pollution and waste released by human processes. In recent times however, we have realized that our precious resources are not going to last forever.
According to Svoboda (1995) at The National Pollution Prevention Center for Higher Education, at the University of Michigan, one of the first efforts in researching sustainability was initiated in the 1960s when scientists were concerned about the rapid depletion of fossil fuel resources. The worlds increasing population and the impact on fossil fuels created an interest in studies regarding the impact energy consumption had on the usage of fuel in an effort to make consumption more efficient.
raw materials for each of the different types of containers. This showed that corporations were starting to get more environmentally conscious.
In the 1970s the U.S Environmental Protection Agency created the Resource and Environmental Profile Analysis (REPA). This methodology of assessing resource and environmental conditions was refined from the Coca Cola Companies efforts and driven by the oil crisis in 1973. Towards the early 1980s the worlds concern shifted towards the management of hazardous wastes. The most logical approach to this problem was to incorporate some sort of study of the life cycle of such products. This early form of life cycle assessment was used by the community as a part of their risk assessment programs, in order to develop environmental protection standards. The major problem with life cycle assessment in the early days was that it was usually carried out by companies after their product had been released, and only when it had their best interests at hand. One can see how such organizations may have omitted or purposely ignored negative information simply to boost company standings. As such, these early LCA’s were highly undependable.
In the 1990s there has been a tremendous pressure to improve the environmental quality and to ensure that company production processes and activities do not have a significant impact on the environment. It is not only left up to the company to provide this assurance these days, but non-profit environmental organizations have also taken it into their hands to perform life cycle assessments on various products to provide some comparison between them. In this manner, companies are indirectly pressured to improve their processes due to the fear of being eliminated by more eco-friendly competition.
currently in the second stage which is data collection process. This will continue until sometime next year, when the third stage, weighting and data evaluating will take place in mid-2005. Details can be obtained from the Center for Design website http://www.cfd.rmit.edu.au/.
Although the apparent reason to use LCA would be to compare different products for environmental friendliness, such as different kinds of cans for beer, or the difference between nappies and diapers for babies, it is also a powerful tool which can be incorporated into an organization to guide their decision and policy making.
2.2
Life Cycle Assessment Methodology
Different research groups have developed their own methods for conducting LCA’s. Each of these methods needs to be taken into consideration. The Society of Environmental Toxicology and Chemistry (SETAC) and The Institute of Environmental Sciences at the University of Leiden describe a complete LCA as comprising of 5 main stages. In sequential order, these are, Planning, Screening, Data Collection and Treatment, Evaluation and Improvement Assessment.
One of the largest, oldest LCA companies, based in the UK, Boustead Consulting Ltd. (2004) defines a life cycle assessment as having 3 main stages. First is the Inventory stage, where raw data is collected, then comes the Interpretation stage, where this data is related to specific environmental situations, and finally comes the Improvement stage where the system is modified to eliminate the environmental impacts observed in the analysis.
These similarities can again be seen in the Life Cycle Assessment Research Centers (2002) report on the ISO Committee’s LCA model which includes the following steps:
• Goal and Scope Definition
• Inventory Analysis
• Impact Assessment
• Interpretation
• Reporting
• Critical Review
This is quite clearly similar to the previous two models, with slightly different wording. Other than that, we can safely conclude that generally, most life cycle assessments are quite identical, at least as an overview. They all indicate the need to study the system, define goals and scopes of study, the need to gather raw data, to evaluate and categorize this data, as well as the need to report on this data so that important decisions can be made to modify current processes.
2.2.1 Overview of ISO Life Cycle Assessment Methodology
The ISO set of standards for carrying out an LCA is defined in the set of documents ISO 14040 to ISO 14043. 14040 describes a clear overview of LCA practice, applications and limitations of LCA. It is meant to describe the system to potential users and those with a limited knowledge of LCA.
These standards are very helpful for a researcher like myself who is just starting out in this particular field of research. A few researchers dispute the guidelines set out in these documents , but I cannot see any flaws in them.
2.3 Data Evaluation
Data Evaluation is a much disputed area of Life Cycle Assessment. Although there are many similarities in most areas of evaluation, many researchers dispute the most efficient way to relate raw data to environmental impact. Therefore, this section will examine these different views.
Svoboda (1995) at The National Pollution Prevention Center for Higher Education, at the University of Michigan suggests that a useful impact assessment should address ecological and human impacts as well as social, cultural and economic impacts. The ISO 14042 standard addresses this stage of LCA. It says that all Life Cycle Inventory data should be categorized into different impact categories. These impact categories will have weightings so that the potential harm of each process can be easily identified. This will enable the more serious problems to be given priority over lesser ones.
2.4 Improvement Assessment
Improvement Assessment is the process of using the Life Cycle Impact Assessment (LCIA) in stage two of the LCA and using it to make beneficial alterations to the current system. The reason for a review of this topic is to ensure that I have not overlooked any method of using the LCIA data as a decision making tool.
Marano and Rogers (1999) utilized the results of a Life Cycle Impact Analysis combined with linear programming, in order to provide them with the most cost efficient course of Improvement action to be taken. This is a small example of how LCIAs can be combined with other methods to form a decision assisting tool.
There is not much information available on the decisions made after the Life cycle analysis, as most documents simply detail the actual process of LCA but very rarely its post-assessment implications.
2.5 Life Cycle Assessment in Australia
The Australian Eco-Indicator project undertaken by the Center for Design at the Royal Melbourne Institute of Technology in Melbourne is the first large scale LCA project to be initiated in Australia.
This objective of this project is to create an environmental assessment methodology for Australia, based on the Eco-Indicator ’99 method developed in the Netherlands. This aims to increase the usability and relevance of LCA for designers, policy makers and non-LCA expert users in Australia. It also aims to expose the environmental impacts of manufacture and processes currently facing Australia.
2.6 Life Cycle Assessment and Electronics
LCA plays an important role in the field of electrical / electronics products (EEPs). In an Australian context, according to the Center for Designs report on Sustainable Development of Electrical and Electronic products (2001), each year, Australians purchase millions of electrical and electronic products. These products cause vast consumption of energy, water, detergent as well as a large amount of non-renewable resources.
EEPs contribute to such a significant portion of Australia’s solid and hazardous wastes that the NSW government has proposed the idea of initiating a product take-back scheme so that companies would have the responsibility of recycling their own products.
The Center for Design outlines several design strategies that would help product designers aim for more sustainable EEPs that do not produce so much waste and by products. The following design guidelines generally apply to most electronic and electrical devices:
• minimise standby power consumption
• minimise warm up time
• power down as far as possible, as fast as possible after use
• minimise operation power requirements
• use efficient power supplies
• for equipment that uses paper, provide double sided copying and printing
• ensure controls for energy saving features are easy to use
• evaluate usage patterns to identify potential to store useful heat, and carry over energy for next task
• minimise heat losses and gains
• incorporate lightweight moving components
• where water is heated, minimise volume and heat losses and recover waste heat
• where heat must be transferred, optimize the process
• where ducts or pipes are part of the system, optimize insulation and size
• ensure where relevant products comply with the energy efficiency star rating scheme, and that ‘point of sale’ labels are clearly displayed and promoted.
These design criteria will be taken into consideration when I am making recommendations based on my Life Cycle Assessment of the Calculator being used in this project.
2.7 Motivations and Benefits of using LCA
The ICF Consulting Team (2004) identify one of the reasons for companies to start using LCA is that in today’s society, it is becoming increasingly common for an organization to not only be held responsible for financial performance, but also for their impact on society and the environment.
The Center for Design at RMIT (2001) outline some of the motivations for corporations to incorporate LCA into their operations. Firstly, LCA will assist companies in breaking into markets overseas where they will be competing with other companies which use environmental strategies to market their products. It will also provide an edge in the local market where foreign competitors are trying to market their ‘green products’ which boast environmental efficiency.
The Environmental Management Center (2004) identifies one of the benefits LCA has over a Risk Assessment (RA). While an RA would help identify the risks involved and how to avoid them, what it usually does is to shift the risk to another area. LCA has the benefit of following all processes involved, from ‘cradle to grave’ so all negative elements can be eliminated along the way.
2.8 Limitations of Life Cycle Assessment
Guinee (2001) describes an analysis of the limitations of LCA processes as follows:
• LCA does not provide the capability to carry out a full fledge Risk Assessment study. This is due to the fact that by studying some chain effects, others have to be simplified.
• LCA focuses on the physical aspects of industrial activities instead of on market mechanisms and the secondary effect on technological development.
• LCA focuses mainly on the environmental impacts and fails to address social, cultural and economic impacts.
• Data is currently being compiled in several countries, and standardization efforts are being made, but the fact is that most of the time, this data is obsolete, incomparable or of unknown quality. Data is often available for blocks of processes, such as ‘production of phenolic compound’ instead of the separate processes used to get the compound.
Chapter 3
Methodology
The following is the methodology I devised to assist me in the completion of my Life Cycle Assessment for this research project. It involves 3 main stages which are Inventory, Interpretation, and Improvement
3.1 Stage 1
-
Inventory
In this stage, first, the calculator being studied was dismantled. The components were removed from the circuit board by use of a de-soldering braid and a soldering iron. The parts were then researched, according to commonly used parts in the electronic industry.
These parts were then inventoried by means of building an assembly in SimaPro. By researching commonly used materials for these parts, it was then a process of selecting the correct materials and processes in SimaPro. As there did not exist exact matches, this process had to be completed by means of substituting for the most accurate matches.
The next step in the inventory process was to build a life cycle and disposal scenario for the calculator .To do this, the batteries lifespan was calculated based on the LR1130 button cells data sheet. Based on this data, it was possible to calculate the average lifespan of the calculator (assuming only one battery was used).
3.2 Stage 2-
Interpretation
Once the assembly had been defined and built into SimaPro, it was then possible to carry out Impact Assessment Analysis.
This was done using 3 different Impact Assessment Methods (later detailed in Chapter 5, and 7). The main method was the Eco-Indicator ’99 method, which was chosen due to its similarity to the current development of the Australian Eco-Indicator method (which was not yet available for use). The other two methods chosen, the CML 2 baseline 2000 method and the EPS 2000 method were chosen for control reasons. By performing an Impact Assessment using 3 methods, it would then be possible to eliminate any errors and to detect outliers in the results.
The next step in this stage was Sensitivity Analysis. This was the process of modifying the originally defined assembly, in order to determine the correctness and usability of data. In each stage of the modification, additional Impact Assessments were made, and analyzed to determine important changes in impact levels of each sub-assembly.
3.3 Stage 3
-
Improvement
In this final stage, all the data from the Impact Assessments and Sensitivity Analysis was analyzed collectively. From here, it was possible to group all the analysis (according to my discretion as the analyst) to make an overall judgment on the sustainability of each sub-assembly in the calculator based on the three Impact Assessment methods chosen. Since 2 of the methods were damage oriented and 1 was product development (monetary and product usefulness) oriented, this created an interesting contrast (which is outlined in Chapter 9).
Chapter 4
Life Cycle Assessment on a Calculator
4.1 Justification of Product Selection
The scope of my research project was to execute a Life Cycle Assessment on an electronic product using a software program to assist in the analysis. The LCA process is quite complicated, and simply compiling an LCA of a wood shed (which comprises of wooden planks and nails) can prove to be a long and tedious process of data acquisition and inventorying. After this, the data needs to be analyzed and interpreted, which makes the task even more arduous. With such complications arising even for the LCA of a wooden shed, one can imagine how problematical it must be to compile an LCA of an electronic product which has many intricate components.
There are two main reasons I chose a calculator to perform my LCA on. The first being its simplicity, and the second was its similarity (in terms of physical features and material construct) to other electronic products in the market.
The calculator consists of one Printed Circuit Board, which has two capacitors, a battery holder and a battery. This is connected to a Liquid Crystal Display, and operated by a silicon rubber keypad. All these components are housed inside a HDPE casing. This construct of a calculator makes it many times simpler to analyze than an electronic organizer, or a television set which consists of hundreds of (sometimes tiny and complex) electronic and other components. This makes the process of inventorying materials and processes much simpler.
the remote control for a television set), and a hard plastic casing usually made of HDPE.
4.2 The Calculator Scenario
Due to the fact that not all information was available for my scope of study, I created a theoretical scenario, by which to explain the rationale behind assigning certain materials and processes to the LCA.
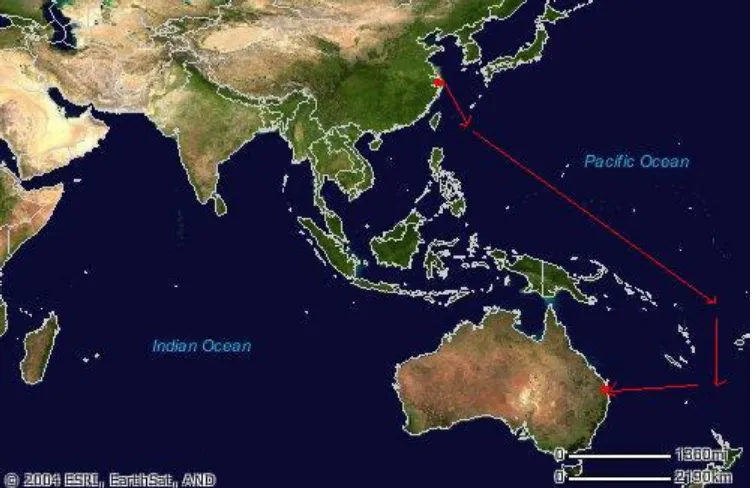
[image:27.595.110.488.291.535.2]The version of SimaPro that was obtained by the University did not include the Australian data set that had been compiled by the Royal Melbourne Institute of Technology (RMIT) in their Australian Eco-Indicator project. Instead, it included mostly European data. The calculator, on the other hand, was manufactured in China.
Figure 4.1 - satellite map of the region with shipping route indicated
what goes on when a product such as this is manufactured in China, and shipped to Australia.
According the China Shipping Lines, there is a direct container ship service that comes from Shanghai, China, and unloads in Brisbane, Sydney and Melbourne Australia. I chose to select the Shanghai – Brisbane route for ease of calculation. From this, we obtain the following distances for cargo transport:
Shipping (Shanghai – Brisbane)
According to the China Shipping Australia Company, a Container ship that leaves Shanghai, China on a direct voyage to Brisbane takes a total of 13 days. According to the SimaPro data for an Average Container ship, it travels at a speed of 43km/hr.
From this, it can be calculated that the ship travels a total of 13416 km.
Truck (Brisbane – Toowoomba)
Toowoomba is located inland about 180 km from Brisbane.
4.3 Breaking Down the Product
[image:29.595.94.506.260.602.2]Before a thorough Life Cycle Assessment could be carried out in SimaPro, the Calculator had to be broken down into smaller parts called sub-assemblies. This is done to group the components that make up the Calculator by their materials. The following flowchart (taken from SimaPro) shows the main assembly of the Calculator being broken down into its sub-assemblies and these sub-assemblies being broken down into the separate materials and processes involved in their production.
Figure 4.2 - Assembly tree showing the sub-assemblies and materials / processes
From this breakdown, we can see that the Assembly model is broken down into 5 sub-assemblies. It is also apparent from this assembly diagram that the UCPTE Electricity (Electricity supply by the Union for the Co-ordination of Production and Transmissions of Electricity in Western Europe) for the Injection Moulding process is
0.0238 kg Injection moulding 0.000568 0.0238 kg HDPE P 0.0106 0.112 MJ Electricity UCPTE Med. 0.000704 1 p
AA cell battery (Alkaline) 0.00559 0.00427 kg PB I 0.00165 0.0038 kg
Printed board I
taken into account. Also taken into account is the process used to form the rubber numeric keypad from Butadiene Rubber (reinforced 25%).
It is important to note that the diagram above is simply shown for illustrative purposes only. Not shown in the diagram is the Liquid Crystal Display (LCD) and the Smaller Parts (2 Capacitors, 2 Screws, and the Battery Holder). At first, it was not clear why SimaPro did not display these sub-assemblies. During sensitivity analysis (refer to Chapter 8) however, when the glass was changed from ‘White’ to ‘Virgin’, it appeared on the network diagram. This could have been because the ‘White’ glass did not have a large enough impact contribution to be worth showing on the diagram.
Later on, I confirmed this theory by changing the quantities of the LCD and Smaller Parts to some nonsense high number. All the sub-assemblies were now shown on the diagram. This would mean that if a sub-assembly contains an extremely low impact on the overall system, SimaPro would leave it out of the picture, as this would help place focus on the important sub-assemblies.
Chapter 5
Compiling an LCA in SimaPro 5.1
5.1 Introduction to SimaPro
SimaPro 5.1 is the Life Cycle Assessment software that I chose for this study. Before this selection was made, other possible software choices were first researched. Two of the more prominent software in the market is listed below:
GaBi 4 Software System
(http://www.environmental-expert.com/software/pr_eng/pr_eng.htm)
The GaBi 4 Software system uses environmental impact data collected by the PE Consulting Group at Environmental Expert dot Com. Data compiled and analyzed using this software can only be shared with it’s sister software SoFi which is a sustainability analysis software.
Although this software features 650 data sets from industry averages, the use of impact assessment methods such as the Eco-indicator 99, and CML 1996 / 2001, and also a certain ease of functionality, it was not the best choice of software out there since SimaPro 5.1 incorporated all these features, and it had better features in terms of user friendliness, and compatibility with the data set being developed by the Royal Melbourne Institute of Technology (RMIT) in their Australian Eco-Indicator Project.
The Boustead Model
5.2 Learning to Use SimaPro
As this, or any Life Cycle Assessment software is substantially different from any other software I had used before, there was a learning curve in reaching a thorough level of understanding of SimaPro 5.1s functionality. I could not start work on my particular project immediately, but instead, had to work on several simpler LCA projects in order to determine the proper was to enter data and methods of conducting an extensive interpretation on the analysis performed. There is no easy way to learn how to use SimaPro. I would suggest that anyone keen on learning how to use it start by playing around with the software at every given opportunity, and get acquainted with it by compiling Assemblies of simple products (products that only contain one or two materials / processes). This will also simplify the process of conducting an analysis on these simple assemblies.
There were also a few setbacks, such as a wait period for the university to obtain a full version of the program. In these initial 4 months before obtaining a copy of the software on the faculties servers, I used to demo version available freely over the internet at http://www.pre.nl/simapro/download_simapro.htm.
The demo version offered only limited functionality, with the inability to create a new project. It was still a good tool to learn about the software, but could not be used for any proper research since the demo version could not be saved, copied, imported or exported.
As a start, I worked through the SimaPro ‘Guided Tour with Coffee’, the ‘Tutorial with Wood’ and the ‘LCA Wizard’, each of which gave me valuable insight into the workings of the system.
The Tutorial with Wood leaves the user with the knowledge gained from the guided tour, and lets you look through a Life Cycle Assessment that was compiled on the assembly of a Wooden Shed. Since the guided tour demonstrated the capabilities of SimaPro, this Tutorial allows the user to play around with the template-like structure of the program, as well as allowing them to perform an analysis on the pre-defined assembly using the different Impact Assessment Methods available.
5.3 Applying the LCA Methodology in SimaPro
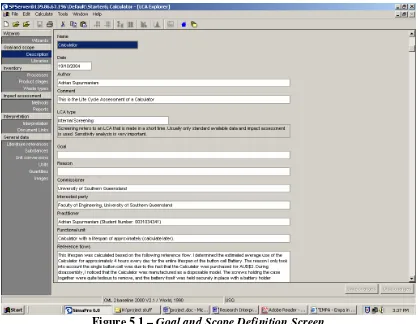
5.3.1 Description of Project (Goal and Scope Definition)
Before commencing any Life Cycle Assessment project, it is wise to outline certain details to guide the analyst through the study. In SimaPro, an LCA project is set out like a template. There are 5 main categories (each of which contains several sub-categories) in this template. These are:
• Goal and Scope
• Inventory
• Impact Assessment
• Interpretation
• General Data
Figure 5.1 – Goal and Scope Definition Screen
The first four categories represent the 4 main stages of any LCA study. The last category, General Data contains minor details and information that may be needed in some studies. This includes things like literature references, lists of substances available for use in projects, lists of units and unit conversions, names of quantities and dimensions, and clip art images that can be used to visually describe assemblies within a project.
The description of the project is set out in Goal and Scope. In this section, the user may define any specific comments about the study, the type of LCA, Goal, Reason for conducting the study, as well as provide a description of the Functional Unit, with Reference Flows and Alternative Scenarios.
The type of LCA being carried out is an ‘Internal Screening’, which refers to an LCA which is carried out in a relatively short time, and uses mainly standard available data. Since I only had the span of approximately 4 months to complete my study, and the data used was mainly from 3 libraries available with SimaPro, this method of LCA was selected.
The concept of the Functional Unit and Reference Flows may be new to many, as they would not have been used except in other Life Cycle type studies. According the SimaPro User Manual, the example of comparing 2 different products (for example a Milk carton and a Milk bottle) is given. 1 Milk Carton cannot be compared to 1 Milk bottle, since the Bottle is reusable (perhaps 10 or more times) and the Carton is disposable. In this manner, it would be more logical to define the individual functional units of the Milk Carton as 1 use, and the Milk Bottle as 10 uses. In this way, a reference flow can be created to compare 1000 Milk Cartons to 100 Bottles.
The preceding Functional Unit and Reference Flows help to define the project, limiting the study to one Calculators lifespan based on the duration of the battery.
It is also necessary under Goal and Scope definition to select the data libraries being used for each project. Each data library is unique and can be used in collaboration with each other to build assemblies, life cycles and disposal and reuse scenarios. For my LCA, 3 different libraries are used. These are the IDEMAT 2001, BUWAL250 and the SimaPro Data Archive. A short description of each of the different libraries used as well as a listing of sub-assemblies defined from data in these libraries is provided below.
IDEMAT 2001
The Department of Industrial Engineering Design at the Delft University of Technology developed this database. The data contained within this database is original (obtained through research work done by the department), and not derived from other databases.
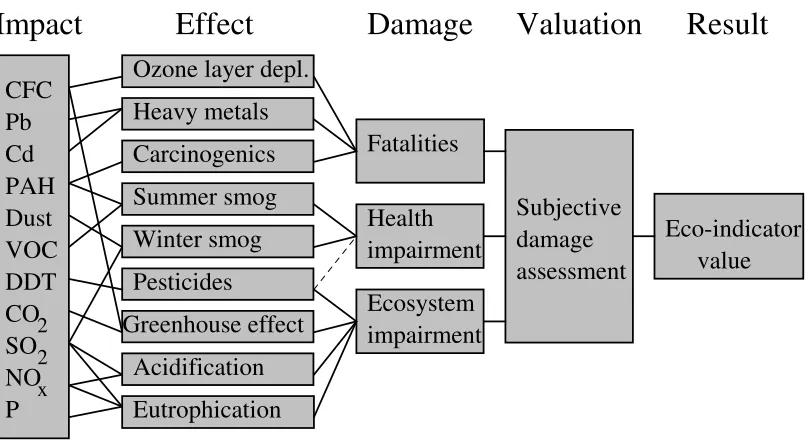
This is a fine database to use for most international situations since an ‘average world situation’ is accounted for. However, while suitable for use as a local data substitute, the data is actually only valid in the Netherlands. The IDEMAT ‘Manual for Designers’ (available through IDEMAT Online) defines the term ‘Eco’ as the ‘Environmental effects that damage ecosystems or human health on a European scale.’ This is due to the fact that the values are calculated based on the impact caused by an ‘average European on an average day’. A more thorough understanding of sources of information in this database can be obtained through reading the ‘Manual for Designers’.
Effect
CO SO Pb
Greenhouse effect Ozone layer depl.
[image:37.595.96.499.83.303.2]Eutrophication Winter smog CFC Health Fatalities Ecosystem
Impact
Heavy metals Pesticides Carcinogenics Summer smog impairment impairment AcidificationValuation
Subjective assessmentDamage
damage PAH DDT VOC NO Dust Cd P Eco-indicator valueResult
2 2 xFigure 5.2 – Eco-indicator calculation process
The Eco-indicator values are actually values obtained through a thorough Life Cycle Assessment carried out on common materials and processes. The values are an indicator of how bad the environmental impact is. The higher the value, the worse the impact.
The sub-assemblies for this research project defined using this library are listed below:
• Battery
Alkaline Battery (Handbook of Batteries, Linden)
• Printed Circuit Board
Printed Board I (Western Europe)
• Rubber Numeric Keypad
BUWAL 250
This is the inventory of packaging materials developed by the Swiss Federal Laboratories for Materials Testing and Research (EMPA) for the Swiss Packaging Institute. All data provided in this database is derived from research in a Swiss situation. No more information was freely available about this database except what is presented below.
This databases inventory includes emissions from raw material production, energy production, the production of semi-manufacturers and auxiliary materials, transports and the production processes of materials. It also includes several waste scenarios, one of which has been used for this project.
The sub-assemblies for this research project defined using this library are listed below.
• Liquid Crystal Display
Glass (white) B250 (Swiss, Western Europe)
• Smaller Parts (2 Screws, 2 Capacitors, Battery holder) ECCS steel 20% scrap (Swiss, Western Europe)
SimaPro Data Archive
This is data collected from industries by industry associations, and is usually outdated. However, where little information is available, or if the information contained in the other (more up to date) libraries are not entirely suitable, this Data Archive was used. There is no more information available on this Data Archive, since it was only available with SimaPro 5.1, which was removed prematurely by Information Technology Services at The University of Southern Queensland, before I could finish research on my project. It was later re-installed as SimaPro 6.0 which did not include this Data Archive.
• Plastic Casing
HDPE P (Western Europe)
Injection Moulding (Western Europe)
• Rubber Numeric Keypad
5.3.2 Defining an Assembly in SimaPro
The next step in performing an LCA is to define an assembly. With a simple product, such as a plastic bottle, this would be a relatively simple task. All that would need to be defined is the processing of raw materials for the plastic, and the actual manufacture of the bottle from the plastic. With a more complex assembly such as the Calculator, where there are many diverse parts involved, it becomes necessary to define sub-assemblies.
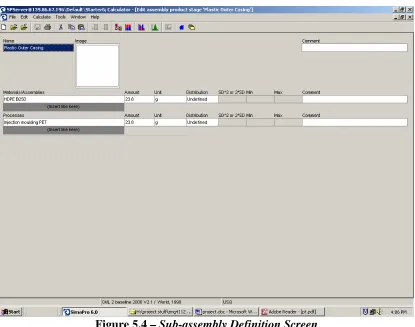
[image:40.595.89.507.397.710.2]To explain the process simply, the whole Calculator is defined as the main Assembly. Under this, 6 separate sub-assemblies are defined, for the Plastic Casing, Liquid Crystal Display, Rubber Numeric Keypad, Printed Circuit Board, Smaller Parts and the Battery. A breakdown of the Assembly into the separate sub-assemblies can be seen in Chapter 4, under 4.3 Breaking Down the Product. We can see in the screenshot below, how all the sub-assemblies are linked back to the main assembly.
Under each sub-assembly, the analyst can define materials and processes involved in its manufacture. Below is a screenshot of the definition of the Plastic Casing. We can see that the material used (HDPE P) and the processes used to form this material (Injection Moulding) into the Calculators Plastic Casing are included.
Figure 5.4 – Sub-assembly Definition Screen
5.3.3 Defining Life Cycle and Disposal Scenarios
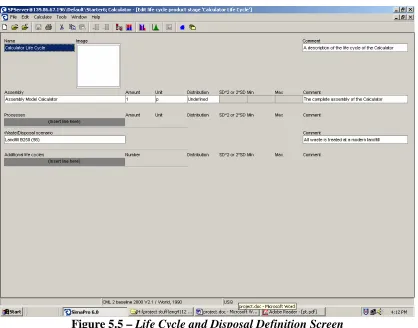
The following screenshot shows the Life Cycle screen which is used to link the Life Cycle Stage to the main assembly. Also, the disposal of the Calculator in a Modern Landfill is defined.
[image:42.595.90.508.142.470.2]
Figure 5.5 – Life Cycle and Disposal Definition Screen
5.4 Impact Assessment Methods and the use of Sensitivity Analysis
The process of Impact Assessment involves the linking of each specific process to specific environmental impacts. Often, one manufacturing or transporting process will lead to many smaller emissions and impacts on the environment. An Impact Assessment Method is a compilation from research done by a certain organization. This organization conducts a study on different processes present in their particular area, and produces a methodology for linking these processes to environmental impacts.
SimaPro 5.1 offers a range of Impact Assessment Methods that can be selected after the initial process of constructing an assembly and life cycle and disposal / reuse scenarios. The main method I selected for my research was the Eco-Indicator ’99 Method developed in the Netherlands. This is a damage oriented method and has been designed for user friendliness. It has also become the basis for the Australian Eco-Indicator Project being currently executed by the Royal Melbourne Institute of Technology (RMIT). Another 2 methods were also selected for comparison. These were the CML 2 baseline 2000 method and the EPS 2000 (product development) method, all of which are detailed in Chapter 7.
Once the Calculator assembly had been defined, an Impact Assessment was performed using the 3 selected methods from SimaPro. Since the assembly was built using standard data from Databases in SimaPro, it was important to use Sensitivity Analysis to re-evaluate these data choices (for materials and processes) to make sure that the most sustainable solutions were chosen. In order to do this, materials and processes were substituted for other values, and separate Impact Assessments were carried out as a sensitivity analysis (detailed in Chapter 8).
Sensitivity analysis was extremely important in this study, not only to determine the validity of data choices, but also to verify the validity and appropriateness of Impact Assessment Method Choices.
Chapter 6
LCA Interpretation
6.1 Interpretation
The interpretation of the Life Cycle Assessment is the important step of converting raw data, and SimaPro impact assessment output into a summary of observable impacts against expected output. This should be documented in such a way that it is possible to use it as a basis for comparison with the LCA’s of other similar products. The International Standards Organisations standard ISO14043 provides guidance for the interpretation of results from an LCA study. The interpretation of my research project LCA follows these guidelines as closely as possible.
The use of sensitivity analysis is very important in this section as it assists in determining the relevance of results. A sensitivity analysis is the process of varying the inputs to a sub-assembly, in this case, the materials and processes that go into that sub-assembly, in order to determine the effects of this change to the measured output (environmental impact in each category or overall).
The purpose of this project was to perform a Life Cycle Assessment on a basic electronic product to see how the common components that form the construct of these products may impact the environment. I also explore options for improvement through the use of sensitivity analysis.
6.2
Consistency Check
6.2.1 System Boundaries and Capital Goods
The use of system boundaries was important in this study to outline the actual goals of the study. Without these cut-off criteria, it would be difficult to obtain proper usable results from the study as the data would be far too vast. System boundaries set for this study were:
Time Period: 2000 to 2004 (time of manufacture / time of data periods)
Geography: Asia, China and Australia (manufacture of calculator and use geography)
Type of Technology: Average / Outdated Technology
Representativity: Mixed Data / Average from processes with similar outputs / Average of all suppliers / Theoretical Calculation
Cut-off rules: Less than 1% physical criteria / Less than 1% socio economic criteria / Less than 5% environmental relevance (These percentages are chosen based on requirements of individual studies. For example, here I have chosen to not pay so much importance on the physical and socio-economic criteria, and more importance on the environmental criteria.)
System Boundary: Second and Third order (material / energy flows including operations and capital goods)
Boundary w nature: Agriculture is part of production system
The use of capital goods in my analysis was extremely limited. The only actual capital good taken into account was the UCPTE Electricity used in the Injection Moulding and the molding of the rubber numeric keypad.
6.2.2 Regional Aspects
This project uses data from 2 main libraries, which are the BUWAL 250 and IDEMAT 2001 (both detailed in Chapter 5). These libraries contain data from Switzerland and from Europe. This data is being used in collaboration with an Impact Assessment method from the Netherlands (Eco-Indicator ’99) and also a method from Sweden (EPS 2000).
Together, this information and methods are used to analyze an electronic product (calculator) manufactured in China, and the data for transport and any assumptions made are for an Australian condition.
6.2.3 Representativity
Representativity is split into two main categories. The type of technology used in the study and the main sources of data. The reason for identifying these portions of information is to ensure that the correct type of information is obtained.
Since the Calculator was manufactured in China, and then shipped and consumed in Australia, the region selected was both China and Australia.
The calculator is quite a simple model, and only contains basic components. By comparison to other products in the market, we can see that today’s calculators have many modern features which are not incorporated in the model in focus. This shows us that the Calculator has outdated, or at best, average technology.
identified to be used in this project was mixed data (data from old archives), average data from processes with similar outputs, average data from all suppliers, and theoretical calculation (calculation of transport from China to Australia and transport within Australia, as well as the calculation of weight of smaller parts in Calculator).
It should also be noted that the Average date from all suppliers and Average data from processes with similar outputs are averages from processes and suppliers in Western Europe.
6.3
Contribution Analysis
In this section, the processes from the calculator assembly that contribute considerably towards the Life Cycle Impact Assessment results are examined. In the SimaPro Life Cycle Impact Assessment (LCIA) screen, there is a separate tab for Process Contribution. In this section, the user is shown a table with the contribution of each process used.
These process contributions can be viewed from many different information perspectives. An analyst can view the actual amount of contribution or a standardized ‘single score’ contribution, in which processes contribution can be compared to other processes. One can also view the Damage Indicator, Normalized Indicator, and the Weighted Indicator, in which impacts on Human Health, Ecosystem Quality and Resources can be analyzed. There is also an Impact Indicator, in which specific impacts on the environment from these processes is shown. The ‘cut-off’ option can be used to eliminate processes that contribute an insignificant amount of impact to the study.
There are 13 main processes that occur in the calculator assembly. Out of this, only 8 processes contribute to more than 0.1% of the total environmental load if the Eco-Indicator 99 is used.
At 5%, only the PCB, the HDPE P, and the alkaline battery remain significant processes. The PCB has the highest impact, as it remains significant right up to a cut- off point of 78%.
These process contributions can also be viewed as a bar chart or a pie chart.
6.4
Anomality Assessment
This section is reserved for unexpected or unusual results. Outliers in project outcomes usually indicate errors. Up to this point, none have been discovered.
6.5 Mismatch between Inventory and Impact Assessment
This project utilized a number of Impact Assessment Methods. These are discussed in terms of compatibility with the projects Life Cycle Inventory. Specifically, the methods used are the CML 2 baseline 2000, and the Eco-Indicator 99.
There are 3 different versions of Eco-Indicator 99. These are the versions from the egalitarian perspective, the hierarchist perspective, and the individualist perspective. In the egalitarian perspective, impacts are viewed in a very long time frame. All substances are included as long as there is any indication of an impact. From this perspective, damage is unavoidable, and leads to catastrophe. From the hierarchist perspective, impacts are also viewed from a long-term viewpoint. Substances are included if its impact is agreed to be significant. According to this perspective, damages can be avoided through good management. The final version is the individualist perspective, which is viewed from a short-term perception (100 years or less). From this perspective, substances are included only if there is irrefutable proof of significant environmental impact. It is the notion that it is possible to recuperate from damages caused by these substances through technological and economic development. This perspective also assumes that fossil fuels cannot be depleted.
it would be possible to consider techniques of reducing or eliminating these impacts through good management.
When using the Eco-Indicator 99 (H) to analyse the assembly, SimaPro generates a list of substance results that were not covered in the method. This is found in the LCIA screen, under the ‘checks’ tab. In this project, 255 substances were listed. Using the CML 2 baseline 2000 method, 238 substances were listed, meaning these substances were not covered by this method. From this list of unlisted substances, an analyst can determine how extensive the mismatch is between the Impact Assessment Method used, and the Life Cycle Inventory of the product.
Chapter 7
Life Cycle Impact Assessment
7.1 Introduction to Life Cycle Impact Assessment
In the stage of Life Cycle Impact Assessment, or LCIA, Impact Assessment methods are used to link each of the materials and processes in the Calculators lifespan to a specific environmental impact. Each of the Impact Assessment methods used for this research project have been outlined and detailed. These are the Eco-Indicator ’99 Method, the CML 2 baseline 2000 Method, the Ecopoints ’97 method. They were selected based on the suitability of the Impact Assessment categories, and also since they were the most up to date methods being used today.
In this section, the methodologies that make up these Impact Assessment Methods will be explained in some detail, and also the range of impact assessment categories that they feature. A description of each impact category is adapted from the SimaPro 6 Database Manual (provided with SimaPro v6). Then, each of these methods will be applied to the calculator assembly in order to perform a Life Cycle Assessment. A Sensitivity Analysis is also performed on each of the sub-assemblies to determine if the impact contribution of each can be reduced through the use of different materials or processes.
It should be noted that where percentages are used to indicate the impact contribution of sub-assemblies to impact categories, they represent the percentage of impact caused by the sub-assembly against the total assembly. This means that the assembly as a whole would cause 100% impact in all categories affected.
7.2 Eco-Indicator ’99 (Netherlands Impact Assessment Method)
This Impact Assessment method was initially developed under a Dutch program in 1995. It was part of an environmental initiative by several companies including Philips Consumer Electronics and Volvo / Mitsubishi. The method was continuously updated up to the year 2000 and is highly compatible with ISO 14042 requirements.
This method was mainly designed to be user friendly and to allow for environmental impact scores to be turned into a design improvement tool for designers and product managers. The methodology presented by this method is currently one of the most widely used in the world. It features more than 200 predefined eco-indicator scores for commonly used materials and processes, and updates are constantly available (depending on service agreements of software used).
Although this method features many different impact categories including Carcinogens, Respiratory organics / inorganics, Radiation, Acidification / Eutrophication, Climate Change, Ozone Layer and Minerals, each of which is discussed below.
• Carcinogens (Measures emissions of carcinogenic substances to air, water and soil).
• Respiratory inorganics (Measures respiratory effects of emissions of dust, sulphur, and nitrogen oxides to air resulting from winter smog).
• Respiratory organics (Measures respiratory effects of emissions of organic substances to air resulting from summer smog).
• Climate change (Measures damage (diseases and death) caused by climate change).
• Ozone layer (Measures damage due to increased UV radiation resulting from emissions of ozone depleting substances to the air).
• Ecotoxicity (Measures emissions of ecotoxic substances to the air, water and soil and the damage caused to the ecosystem quality).
• Acidification / Eutrophication (Measures acidifying substances to the air, and the resulting damage on ecosystem quality).
• Land use (Measures the damage resulting from the conversion or occupation
of land).
• Minerals (Measures decreasing mineral grades and the resulting surplus energy used to mine each extra kg of mineral).
• Fossil fuels (Measures lowered quality of resources and the surplus energy used to extract each MJ, kg or m3 of fossil fuel).
It only has 3 main endpoints in its damage assessment stage. These are Human Health, Environment and Resources. This means that SimaPro will output a single bar graph (a Damage Assessment graph was unable to be reproduced) that shows the proportion of damage caused by each of the sub-assemblies being analyzed. Some Damage Assessment has been made in Chapter 8.
There are 3 versions of the method available for use, which are briefly outlined below for further understanding.
• Hierarchist perspective (long term perspective, and substances are included if there is consensus regarding their effect)
• Individualist perspective (short time perspective of 100 years or less, and substances are included only if there is complete proof regarding their effect).
7.2.1 Impact Assessment (Eco-Indicator ’99 Graphs)
Figure 7.1 - All original weights and materials (original assembly) without transport
A nalyzing 1 p assembly 'Assembly Model Calculator'; Method: Eco-indicator 99 (H) / Europe EI 99 H/H / characterisation %
0 10 20 30 40 50 60 70 80 90 100
Carcinogens Resp. organics Resp. inorganics
Climate change Radiation Ozone layer Ecotoxicity A cidif ication/ Eutrophication
Land use Minerals Fossil fuels
Battery Casing PCB Rubber Numeric Keypad Small Parts Liquid Crystal Display
100 100 100 100
0
7.2.1 Impact Assessment (Eco-Indicator ’99)
The bar graphs shown on the previous pages are the results from an Impact Assessment done with the Eco-Indicator ’99. We can see from this that the different Impact categories are individually assessed in terms of each of the separate sub-assemblies. Each sub-assembly is shown as a proportion of its contribution to the impact in that particular category.
One clear observation from the graph is that the Printed Circuit Board (PCB) contributes towards most of the impact across the chart. For Carcinogens, Eco-toxicity and Land Use, the PCB contributes to nearly all the impact. The smallest impact categories are Respiratory Organics and Fossil Fuels.
The plastic casing is the sub-assembly that has the second largest impact. The main impact is in Respiratory Organics for which it contributes nearly a quarter of the impact, and in Fossil Fuels. The casing also has minor impact in Respiratory In-organics, Climate Change, Ozone Layer, Acidification / Eutrophication, and Land Use. It also has a slight (but negligible) impact on Eco-toxicity. The casing has absolutely no impact on Minerals.
The battery does not have a major impact, but does contribute slightly (approximately 5 to 10 %) to the impact on Respiratory Organics and In-Organics, Climate Change, Ozone Layer, Eco-toxicity, Acidification / Eutrophication, Minerals and Fossil Fuels. It has a negligible impact on Carcinogens and no impact on Land Use.
The Rubber Numeric Keypad has about an 8% impact on Respiratory Organics and Fossil Fuels. It also has a minor impact (about 2%) on Respiratory In-organics, Ozone Layer, Acidification / Eutrophication, and Land Use. It has negligible impacts on Carcinogens and Eco-toxicity, and no impact on Minerals.
in all affected categories. None of the sub-assemblies that make up the Calculator causes any Radiation, as this is one category that is not affected at all.
All these results were obtained from the analysis for an assembly for a Calculator that was manufactured and not transported anywhere. Adding transportation into the equation was possible by defining it in the main assembly as a process. From this, some judgments could be made about the effect of transporting a product over such a long distance (refer to 4.2 The Calculator Scenario in Chapter 4 for distance calculations).
It was apparent from the bar graph presented on the previous pages, that the impact from transport is so great that it practically overshadows the impact from the rest of the assembly. In the damage assessment step, the Container Ship was found to have a 90% impact on Human Health and Eco-system Quality and a 65% impact on Resources. The remainder of the impact on these 3 damage categories was accounted for by the Delivery Van.
The Delivery Van is responsible for 100% of the impact on Carcinogens, Ozone Layer and Eco-toxicity, and approximately 60% of Respiratory Organics, and 40% of Climate Change and Fossil Fuels. It also causes about 10% impact on Respiratory In-organics and Acidification / Eutrophication.
The Container Ship causes about 90% of the impact on Respiratory In-organics and Acidification / Eutrophication. It also causes about 60% impact on Climate Change and Fossil Fuels and approximately 40% impact on Respiratory Organics.
7.2.2 Damage Assessment (Eco-Indicator ’99)
7.3 CML 2 baseline 2000 Method
This method is an improvement on the Dutch Guide to LCA in 1992 by the Center of Environmental Sciences (CML). This method is also known as the NOH method or Heijungs 1992.
This method is slightly similar to the Eco-Indicator ’99, but varies in terms of Impact Categories featured. Impact Categories are:
• Depletion of abiotic resources (Determined based on the extraction of minerals and fossil fuels and is concerned with the protection of human welfare, human health, and ecosystem health).
• Climate Change (Records the global warming potential in the next 100 years
from carbon dioxide emissions to the air. Climate Change will affect ecosystem health, human health, and material welfare).
• Stratospheric Ozone Depletion (Measures CFC-11 emissions to the ozone on
an infinity timescale. Effects of this ozone depletion is a larger fraction of UV-B radiation reaching ear