Annual variation of the angular distribution of the UV beneath
public shade structures
D.J. Turnbull*, A.V. Parisi
Centre for Astronomy, Solar Radiation and Climate, University of Southern Queensland, Toowoomba, 4350, Australia. Ph: +61 7 46 311488. Fax: +61 7 46 311530.
Email: [email protected]
* To whom correspondence should be addressed
Abstract
Local governments provide many shade structures at parks and sporting ovals for public use. However, the question remains of how effective are public shade structures at reducing biologically effective UV radiation throughout the year? Broadband measurements of the angular distribution of scattered UV beneath three specific public shade structures was conducted for relatively clear skies and for a solar zenith angle (SZA) ranging from 13o to 76o. The ultraviolet protection factors (UPF) for the shade structures ranged from 18.3 to 1.5 for an increasing SZA. Measurements showed that the horizontal plane received the highest SUV levels from the SZA of 28o to 75o, 42o to 76o, and 50o to 76o for the small, medium and large structures respectively. This was due to the angle of the sun causing the shade created by the shade structure to be outside the structure. For the small shade structure, the measurements directed to the west were the highest levels in the shade after approximately 28o. For the medium and large shade structures, the measurements directed to the west and south were the highest levels in the shade after roughly 42o and 50o respectively.
Keywords: Diffuse; Angular; UV; Shade structures; Protection factor
1. Introduction
Australia has the unenviable reputation of having one of the highest rates of mortality for skin cancer in the world. Skin cancer has been linked to excessive and repeated exposures to solar UV radiation [1,2] and causes more than 1000 deaths in Australia each year, with the majority of these being preventable. The health effects of solar UV radiation vary significantly, from being a morale booster to the severe degradation of body tissue. Solar UV radiation at the Earth’s surface is
influenced by a number of factors, namely time of day, atmospheric ozone, aerosols, cloud cover, albedo, and seasonal and geographical variation [1,3]. While direct UV from the sun is generally reflected or absorbed by the shade environment, the diffuse component is still present in the shade and the lack of knowledge on diffuse UV leads to misconceptions regarding the amount that shade protects the human body against ultraviolet radiation [4].
summer, people may seek shade or utilise other UV minimisation strategies in the hottest part of the day for comfort [5] and also because they have been educated about the dangers of direct summertime UV. For the colder winter month’s people may spend longer outside as they seek the warmth from the sun when outside and as they believe they are at a greatly decreased risk of exposure to harmful UV.
While past research has measured seasonal variation of UV in full sun (e.g. [6-10]), only a small amount of research has been conducted on seasonal variation of UV beneath different shade environments (e.g. [3,4,11-14]). This previous research has found that the percentage of erythemal UV in tree shade compared to that in full sun is higher in winter compared to summer [3]. However, the absolute erythemal UV irradiances in the tree shade were still higher in summer due to the higher irradiances in full sun. For public shade structures, the UV exposure under the structures is determined by the design and construction of the structure [4]. The ultraviolet protection factor (UPF) has been shown to decrease with solar zenith angle (SZA) between 33o and 76o [4,13]. Additionally, the solar UV exposures in shade have been shown to be dependent on the angle of the receiving surface [12].
Consequently, this paper extends this previous research and reports the findings of concurrent measurements of the diffuse UV on a horizontal plane in full sun and the angular distribution of UV in the shade of three public shade structures for the broad range of solar zenith angles seen throughout the year. This research compares the UV levels on horizontal and vertical planes directed to the north, south, east and west beneath and around three specific different sized public shade structures with that of the diffuse UV on an
unshaded horizontal plane for clear skies at a Southern Hemisphere site.
2.Materials and Methods
2.1 Shade Structures
T e three public shade structures employed in this research were located at varying public locations around the city of Toowoomba (27.5oS, 151.9oE, 692 m above sea level), Australia. The three structures were chosen because of their differences in size and shape. To a first order, the results are applicable to other shade structures of the same approximate dimensions that reduce the amount of sky view by the same approximate amount. None of the shade structures had any surrounding vegetation or other structures in close proximity. The structures will be referred to as the small, medium and large shade structures (refer to Figure 1). Descriptions of the shade structures have been provided elsewhere [13]. Briefly, they are as follows:
h
Small Shade Structure: The small shade structure is 2.55 m wide at the sides, 2.28 m high at the eaves and approximately 3.10 m high at the apex. The overhang of the roof is approximately 0.69 m.
Medium Shade Structure: The medium shade structure is of hexagonal shape with sides measuring 2.16 m wide, 2.11 m high at the eaves, and approximately 3.31 m high at the apex. The overhang of the roof is approximately 0.55 m.
The albedo of the grass surrounding the shade structures ranged from 4% in the shade to 7% in full sun, while the albedo of the concrete beneath the shade structure stayed at approximately 10% for shade and full sun. Descriptions of sky view and albedo related to the tables, seats and underside of roofs have been provided elsewhere [13].
2.2 Shade Structure Radiometry
Two broadband sensors were used in this research to measure the solar UV irradiance beneath each of the shade structures; the erythemal UV (SUV) [15] and UVA (320 – 400 nm) were measured. For this research all measurements were taken in the centre of the shade created by the shade structure and at a height of approximately 0.41 m from ground level, which roughly approximates young primary school children sitting on the ground. For the lower SZA’s seen during summer the measurements in the shade were conducted either on the seats or on the tables. The UV irradiances were measured on a horizontal plane in full sun and then on horizontal and vertical planes in the shade of the shade structure every 10 min from 9 am to 12 noon. The vertical plane measurements were directed north, south, east and west to account for the side-on scattered UV. The time between each shade and full sun measurement was less than 1 minute. Two or three clear sky days were utilized to gather data for the range of SZA’s. For the measurements, the outside temperature ranged between 9oC to 35oC, relative humidity ranged between 26% to 92% and ozone levels varied between 248 DU to 347 DU.
A hand held Robertson-Berger (RB) meter (model 3D V2.0, Solar Light Co., Philadelphia, PA, USA) [16] fitted with a UVA detector and an erythemal weighted
UV detector was used to measure the UV irradiances. The RB meter was calibrated against a scanning spectroradiometer for UV exposures and temperature variations on a clear day with an SZA between 16o to 66o. The scanning spectroradiometer based on a double grating monochromator, integrating sphere and photomultiplier tube [13] was employed to measure the UV spectrum in 1 nm increments in the sun (model OL IS-640, Optronics Laboratories, Orlando, FL, USA). The uncertainty in the measured UV irradiance is estimated to be of the order of 10% for the RB meter.
2.3 Diffuse Broadband Radiometry
A diffuse SUV broadband radiometer (UV-Biometer Model 501 Version 3, Solar Light Co.) [17] mounted on an unobstructed roof of the University of Southern Queensland, Toowoomba, was also employed in this research. The diffuse SUV radiometer was specifically designed to measure the diffuse erythemal radiation by making use of a shadow band to block the sun as it traversed the sky throughout the day and the year. The error associated with the shadow-band of the diffuse SUV radiometer has been measured at approximately 10% with the appropriate correction applied to all of the necessary data. The diffuse SUV radiometer is temperature stabilized to 25oC and was calibrated against the scanning spectroradiometer described in the previous section, with an estimated uncertainty of the order of 10%.
3.Results and Discussion
3.1 Shade structures and scattered UV
measurements. The horizontal plane received the highest SUV levels from the SZA of 28o to 75o, 42o to 76o, and 50o to 76o for the small, medium and large structures respectively. This was due to the angle of the sun causing the shade created by the shade structure to be outside the structure. As the SZA decreased, the levels of UV in the shade decreased on the horizontal plane and increased for the vertical planes. For the small shade structure, the measurements directed to the west were the highest levels in the shade after approximately 28o. For the medium and large shade structures, the measurements directed to the west and south were the highest levels in the shade after roughly 42o and 50o respectively. This apparent increase in vertical plane measurements was due to the decrease in sky view on the horizontal plane which in turn decreased the levels of UV on the horizontal plane.
Figure 2 shows the comparison of the annual levels of SUV in the shade of the three shade structures as a function of SZA for clear skies. For the SZA’s of 44o to 53o, the erythemal UV beneath the shade structures was at a maximum. The maximum values were 0.16 MED/10 min, 0.12 MED/10 min and 0.09 MED/10 min for the small, medium and large shade structures respectively. The lowest SUV levels in the shade for the small and medium shade structures were 0.07 and 0.03 MED/10 min, respectively, at a SZA of approximately 75o. However, the lowest levels for the large shade structure were observed at approximately 14o with 0.03 MED/10 min. SUV levels in the shade of the three structures increased as the SZA decreased from approximately 76o to 45o before decreasing as the SZA decreased. Figure 3 shows UVA levels in the shade for the three shade structures. UVA levels in the shade showed a general decreasing
trend as the SZA decreased. Maximum UVA levels measured beneath the shade structures were 8.8 W/m2, 7.9 W/m2 and 6.9 W/m2 for the small, medium and large shade structures respectively. The lowest UVA levels measured beneath the shade structures were 5.1 W/m2, 4.6 W/m2 and 1.8 W/m2 for the small, medium and large shade structures respectively.
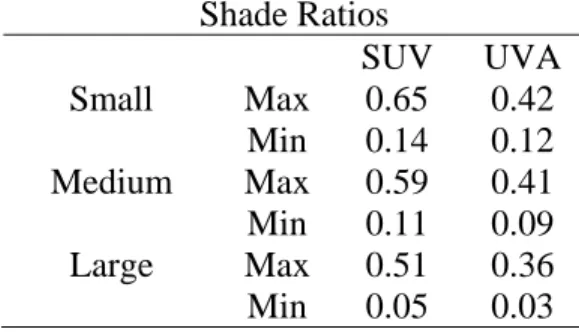
The relative proportion of SUV in the shade of the large shade structure decreases more rapidly than the other shade structures as the SZA decreases, this reduction can be attributed to the larger roof area obscuring more of the sky at the smaller SZA’s. When comparing SUV to UVA shade ratios (refer to Table 1), the levels of SUV are much higher than for UVA because erythemal UV is more biologically effective in the UVB waveband than the UVA. Consequently, Rayleigh scattering results in increased scattering at the shorter wavelengths associated with the UVB waveband. There is also less difference between the shade structures for the UVA shade ratios; this shows that roof area has a more important role in decreasing the scattered SUV than the UVA.
The reduction in SUV for the shade structures is due to the decrease in sky view as the SZA decreased, resulting in diminishing the distance from the centre of the shade to the centre of the shade structure. Specifically, as the shaded area moved to be under the structure with decreasing SZA, there was less sky view.
3.2 Annual variation in UV protection factors
this decrease takes place due to the increase in the relative proportion of the scattered UV as a result of the larger SZA. However, such a decrease does not necessarily mean an increase in UV levels beneath the shade structures. As Figure 2 shows, the highest levels of UV measured in the shade were around a SZA of between 44o to 53o. The increase in UPF for the large shade structure, at the smaller SZA’s, can be attributed to the fact that the centre of the shade received more protection from the roof (decreased amount of sky view) when compared to the other shade structures.
For clear sky days and SZA’s of 13o to 76o the relationships are:
Small Shade Structure
y = 0.0014x2 – 0.2x + 10.2 (1) Medium Shade Structure
y = 0.0016x2 – 0.3x + 14.7 (2) Large Shade Structure
y = -4x10-5x3 + 0.011x2 – 0.95x + 30.1(3) where x is the SZA and y is the UPF of the shade structures. The coefficient of determination for equations 1, 2 and 3 are 0.98, 0.95 and 0.99, respectively. A cubic polynomial is used for the large shade structure to give it a better fit for the large SZA. The fit for the large shade structure is better presented as a cubic polynomial.
3.3 Diffuse UV and UV in the shade
The research presented above is significant because it extends previous work by Turnbull et al [13] which looked at scattered UV levels in the shade on a horizontal plane during winter. Previous research has measured the variation that diffuse UV exhibits with a changing SZA. For example, Parisi et al [18] measured the difference between the relative proportions of diffuse UVB and UVA where the percentage diffuse UVB ranged from 23% at noon to 59% at 3 pm and the percentage diffuse UVA ranged from 17% to 31% for the same times. Likewise, the diffuse UVB has been measured on clear days and has been shown to range from 48% to 70% for solar zenith angles of 15o and range to 100% for solar zenith angles of 75o [19]. Figure 5 shows the relationship between
the diffuse UV in the sun as measured by the roof-mounted radiometer and the scattered UV in the shade measured for each of the shade structures. From this plot the relationships between the diffuse UV and the scattered UV beneath these three shade structures can be obtained for the range of SZA’s of 13o to 76o.
For clear sky days and SZA’s of 13o to 76o the relationships are:
Small Shade Structure
y = 17679x4 – 4083.3x3 + 318.36x2 - 9.422x + 0.123 (4)
Medium Shade Structure
y = -1180x4 + 512x3 – 71.8x2 + 3.8x –
0.0372 (5)
Large Shade Structure
y = -3591x4 + 1038.2x3 – 113.5x2 + 5.223x
– 0.058 (6)
where x is the diffuse UV and y is the scattered UV in the shade of the shade structures on a horizontal plane. The coefficient of determination for equations 4, 5 and 6 are 0.98, 0.89 and 0.96, respectively.
From the relationships obtained for each shade structure, field measurements were conducted and compared against the models for a range of SZA from 11o to 66o. For the small, medium and large shade structures variation between the field measurements and those of the models was up to approximately 11%, 5% and 11%, respectively.
4.Conclusions
observed throughout an entire year. These angular measurements are crucial in showing that research into the effects of side-on protection is essential.
When constructing shade structures, careful consideration must be given to these findings because, even though summer has the highest UV levels in the full sun, winter has the highest relative proportion of scattered UV in the shade due to the increased scattering resulting from the longer path of the solar UV through the atmosphere. Shade is certainly important as a UV minimisation strategy. However, the message is that for long periods, shade alone does not provide enough protection from some biologically damaging UV. Even though the UV transmission through the materials employed on the roof of the structures may be very low, it is the construction of the entire shade setting that determines the exposure beneath that structure. Shade structures that have trees, shrubs or buildings in close proximity generally have lower levels of UV in the shade than those having no such surrounding objects. During a winter in south east Queensland, full sun UV radiation can reach levels of approximately a third or more of that registered in the middle of the day during summer. Therefore, it is necessary for people who live in similar latitudes to minimise UV exposure under all climatic conditions, throughout the year.
From this research it can be concluded that these specific shade structures are inadequate for providing the public enough protection against damaging UV radiation for changing SZA. The shade structures used in this research had no side-on protection, therefore further research is needed to show how effective side-on protection would be at changing a shade structures UPF.
There are countless ways of preventing sunburn and other deleterious effects due to excess sun exposure. Prevention behaviours include simple things such as: wearing hats, appropriate clothing, sunglasses, sunscreens and seeking shade. These prevention behaviours need to be used in conjunction with one another; otherwise the full sun protective affect will not occur.
5. Abbreviations
UV Ultraviolet radiation SZA Solar zenith angle
UPF Ultraviolet protection factor SUV Erythemal ultraviolet
UVA Ultraviolet radiation (320 - 400 nm) DU Dobson units
RB Robertson-Berger MED Minimum erythemal dose
References
[1] NHMRC (National Health and Medical Research Council), Primary Prevention of skin cancer in Australia, Report of the Sun Protection Programs Working Party, Publication No. 2120, Australian Government Publishing Service, Canberra, 1996.
[2] J.C. van der Leun, F.R. de Gruijl, Influences of ozone depletion on human and animal health, in M. Tevini (Ed), UV-B Radiation and Ozone Depletion: Effects on Humans, Animals, Plants, Microorganisms, and Materials, Lewis Publishers, Boca Rotan, 1993, pp. 95-123.
Photodermatol. Photoimmunol. Photomed. 17 (2001) 55-59.
[4] D.J. Turnbull, A.V. Parisi, Spectral UV in public shade settings, J. Photochem. Photobiol. B: Biol. 69 (2003) 13-19.
[5] D. Hill, V. White, R. Marks, T. Theobald, R. Borland, C. Roy, Melanoma prevention: behavioural and nonbehavioural factors in sunburn among an Australian urban population, Prev. Med. 21 (1992) 654-669.
[6] R.L. McKenzie, P.V. Johnston, M. Kotkamp, A. Bittar, J.D. Hamlin, Solar ultraviolet spectroradiometry in New Zealand: instrumentation and sample results from 1990, App. Opt. 31 (1992) 6501-6509.
[7] A.R. Webb, Spectral measurements of solar ultraviolet-B radiation in Southeast England, J. App. Met., 31 (1992) 212-216.
[8] G.D. Smith, M.G. White, K.G. Ryan, Seasonal trends in erythemal and carcinogenic ultraviolet radiation at mid-southern latitudes 1989-1991, Photochem. Photobiol. 57 (1993) 513-517.
[9] J. Sabburg, A. Parisi, J. Wong, Ozone, cloud, solar and UV-B levels at a low pollution, Southern Hemisphere, sub-tropical site for winter/spring 1995, Aust. Phys. Eng. Sci. Med. 20 (1997) 198-202. [10] H.P. Gies, C. Roy, S. Toomey, D.
Tomlinson, Ambient solar UVR, personal exposure and protection, J. Epidem. 9 (1999) S115-S122.
[11] A.V. Parisi, M.G. Kimlin, J.C.F. Wong, R. Lester, D. Turnbull, Reduction in the personal annual solar erythemal ultraviolet exposure
provided by Australian gum trees, Rad. Prot. Dos. 92 (2000) 307-312. [12] A.V. Parisi, M.G. Kimlin, R.
Lester, D. Turnbull, Lower body anatomical distribution of solar ultraviolet radiation on the human form in standing and sitting postures, J. Photochem. Photobiol. B: Biol. 69 (2003) 1-6.
[13] D.J. Turnbull, A.V. Parisi, J. Sabburg, Scattered UV beneath public shade structures during winter, Photochem. Photobiol. 78 (2003) 180-183.
[14] Grant, R.H., Heisler, G.M. & Gao, W. Estimation of pedestrian level UV exposure under trees, Phtochem. Photobiol. 75 (2002) 369-376.
[15] CIE (International Commission on Illumination), A reference action spectrum for ultraviolet induced erythema in human skin, CIE J. 6 (1987) 17-22.
[16] Solar Light Co., Erythema UV and UVA intensity meter: instruction manual. Philadelphia, USA, 1994. [17] Solar Light Co. UV-biometer:
user’s manual. Philadelphia, USA, 1991.
[18] A.V. Parisi, A. Green, M.G. Kimlin, Diffuse solar ultraviolet radiation and implications for preventing human eye damage, Photochem. Photobiol. 73 (2001) 135-139.
[19] R.H. Grant, W. Gao, Diffuse fraction of UV radiation under partly cloudy skies as defined by the automated surface observation system (ASOS), J. Geophys. Res.
Table 1. The maximum and minimum observed shade ratios for the three shade structures of small, medium and large.
Shade Ratios
SUV UVA
Small Max 0.65 0.42
Min 0.14 0.12
Medium Max 0.59 0.41
Min 0.11 0.09
Large Max 0.51 0.36
Figure Captions
Figure 1. A top-view schematic representation of the roofs of the three shade structures used for this research.
Figure 2. Maximum SUV levels encountered beneath the shade structures, small (S), medium (M) and large (L), as a function of SZA.
Figure 3. Maximum UVA levels encountered beneath the shade structures, small (S), medium (M) and large (L), as a function of SZA.
Figure 4. Ultraviolet Protection Factors (UPF) for each shade structure, small (S), medium (M) and large (L), as a function of SZA.
Figure 5. Scattered SUV in the shade of the structures compared with diffuse SUV measurements.
3.93 m
Small 2.71 m
Medium
2.99 m
2.79 m
2.
79
m
Large
(S)
(M)
(L)
0.00 0.06 0.12 0.18 0.24 0.30
0 10 20 30 40 50 60 70 8
SZA (o)
Sh
ade SUV (MED/10min)
0
(S)
(M)
(L)
0 2 4 6 8 10 12 14 16 18 20
0 10 20 30 40 50 60 70 8
SZA (o)
Sh
ade
UVA (W
/m
2 )
0
(S) (M) (L)
0 2 4 6 8 10 12 14 16 18 20
0 10 20 30 40 50 60 70 8
SZA (o)
UPF
0
(S)
(M)
(L) 0.00
0.02 0.04 0.06 0.08 0.10 0.12
0.00 0.02 0.04 0.06 0.08 0.10 0.12
Diffuse SUV (W/m2)
Sh
ade
SUV
(W/m
2 )