Sources of cosmic dust in the Earth
’
s atmosphere
J. D. Carrillo-Sánchez1 , D. Nesvorný2 , P. Pokorný3,4 , D. Janches4 , and J. M. C. Plane1
1
School of Chemistry, University of Leeds, Leeds, UK,2Department of Space Studies, Southwest Research Institute, Boulder, Colorado, USA,3Department of Physics, Catholic University of America, Washington, District of Columbia, USA,4Space
Weather Laboratory, Greenbelt, Maryland, USA
Abstract
There are four known sources of dust in the inner solar system: Jupiter Family comets, asteroids, Halley Type comets, and Oort Cloud comets. Here we combine the mass, velocity, and radiant distributions of these cosmic dust populations from an astronomical model with a chemical ablation model to estimate the injection rates of Na and Fe into the Earth’s upper atmosphere, as well as theflux of cosmic spherules to the surface. Comparing these parameters to lidar observations of the vertical Na and Fefluxes above 87.5 km, and the measured cosmic spherule accretion rate at South Pole, shows that Jupiter Family Comets contribute (8017)% of the total input mass (4314 t d1), in good accord with Cosmic Background Explorer and Planck observations of the zodiacal cloud.1. Introduction
Estimates of the mass influx of cosmic dust entering the Earth’s atmosphere vary over a wide range from 5 to 270 tons per day (t d1), depending on the method used to make the estimate [Plane, 2012]. These dust par-ticles are present in the zodiacal cloud (ZC), which is a circumsolar disk of small debris parpar-ticles produced by sublimating comets and collisions between asteroids. The principal sources to the ZC are short-period Jupiter Family Comets (JFCs); particles from the asteroid belt (ASTs); longer-period Halley Type Comets (HTCs); and Oort Cloud Comets (OCCs) [Nesvorný et al., 2011, 2010;Pokorný et al., 2014]. In the 1990s, it was assumed that gravitational focusing of relatively slow-moving AST particles would enhance their contribution to the ZC and the terrestrial input [Durda and Dermott, 1997;Flynn, 1989]. However,Nesvorný et al. [2010] used numerical modeling of dust ejected from these different sources, together with observations of infrared emission from the ZC made by the InfraRed Astronomy Satellite (IRAS), to show that JFCs are the dominant source (85–95%) of the dust. This is because the profile of IR emission across the plane of the ecliptic matches that expected from JFC particles, whereas HTC particles should have a broader profile and the AST profile should be nar-rower (Huang et al. [2015] showed that the relatively large Na ablationflux compared to Fe in the upper mesosphere was consistent with the dominant JFC particle model). Subsequently,Rowan-Robinson and May[2013] modeled IRAS and Cosmic Background Explorer (COBE) observations, concluding that the come-tary contribution was 70% with a 22% AST contribution. Most recently,Yang and Ishiguro[2015] combined observations of the albedo and spectral gradient of the ZC to show that cometary dust contributes ~94% of the ZC, with the remaining ~6% from asteroidal particles.
The present study will employ a completely different approach to this problem. We will use the cosmic spherule accretion rate at the bottom of an ice chamber at the Amundsen-Scott base at South Pole [Taylor et al., 1998], together with recent measurements of the verticalfluxes of Na and Fe atoms above 87.5 km in the atmosphere [Gardner et al., 2016, 2014;Huang et al., 2015], to determine the absolute contri-butions of each of these dust sources to the global input of cosmic dust.
2. Mass and Velocity Distributions of Dust From Different Sources
For the present study, the size distribution of cosmic dust particles was assumed to be represented by a bro-ken power law with a differential index2 to3 below the break diameterDbreakand a differential index4 to5 aboveDbreak. COBE observations indicate thatDbreaklies between 30μm and 60μm [Fixsen and Dwek, 2002], which is supported by measurements of weak ZC emission at submillimeter wavelengths by the Planck telescope launched in 2009 [Ade et al., 2014]. Here we assumeDbreak= 36μm, which corresponds to a dust composition in between amorphous carbon (Dbreak~ 28μm) and silicate (Dbreak~ 64μm) [Fixsen and Dwek, 2002]. The cumulative size distribution is shown in Figure S1 in the supporting information. The IRAS observations suggestedDbreak~ 100μm [Nesvorný et al., 2010], compared in Figure S1.
Geophysical Research Letters
RESEARCH LETTER
10.1002/2016GL071697
Key Points:
•Solar system dust sources arefitted to
the cosmic spherule accretion rate
and the Na and Fefluxes in the
mesosphere
•Jupiter Family Comets provide ~80%
of the cosmic dust entering the atmosphere, with 12% from long-period comets and 8% from asteroids
•The resulting differential ablation of
Ca and Fe relative to Na explains the relative abundances of these metal layers in the mesosphere
Supporting Information:
•Supporting Information S1
Correspondence to: J. M. C. Plane, J.M.C.Plane@leeds.ac.uk
Citation:
Carrillo-Sánchez, J. D., D. Nesvorný, P. Pokorný, D. Janches, and J. M. C. Plane (2016), Sources of cosmic dust in the
Earth’s atmosphere,Geophys. Res. Lett.,
43, 11,979–11,986, doi:10.1002/
2016GL071697.
Received 23 OCT 2016 Accepted 30 NOV 2016
Accepted article online 4 DEC 2016 Published online 14 DEC 2016
©2016. The Authors.
In the Zodiacal Cloud Model (ZCM) [Nesvorný et al., 2011, 2010], particles of different sizes were launched from the four sources (JFCs, ASTs, etc.) and their orbits were tracked with an N-body code. These integrations accounted for the gravity of all planets, solar pressure, and Poynting-Robertson drag. A collisional model is used where particles are assumed to experience an erosive collision with another particle in the ZC after a characteristic time,τ, which is a function of the particle size and orbit; the particles then undergo a collisional cascade, with smaller fragments being progressively more affected by Poynting-Robertson drag [Nesvorný et al., 2011]. For example, 50μm and 500μm radius particles in a circular orbit at 1 AU have collisional life-times of 1.5 × 10⁵and 7.3 × 10³years, respectively [Grün et al., 1985]. The accretion probability of particles on planets was computed with the standard Öpik code [Greenberg, 1982]. The thermal infrared emission from these modeled particle distributions was then compared iteratively with the emission measured by Planck (or IRAS).
Figures 1a and 1b are histograms of the particle mass distributions for the four cosmic dust sources accreted at the Earth derived from the Planck and IRAS observations, respectively. These distributions are shown as massflux per decade over the mass range 109to 102g, i.e., with a radius between 5μm and 1 mm, assum-ing a particle density of 2.2 g cm3[Consolmagno et al., 2008]. The mass influx of each source has been weighted according to thefitting procedure in section 4. As discussed above, the JFCs were modeled using either the Planck or IRAS distributions—these are termed JFC-IRAS and JFC-Planck particles, respectively. Figures 1a and 1b show that the JFCs-Planck mass distribution peaks around 0.01μg, whereas the largest mass contribution of accreted JFC-IRAS, HTC, and OCC particles is from particles of ~1μg, and the AST peak is ~10μg. Following from the conclusion that most of the ZC emission is from JFC particles, the IRAS and Planck observations indicate a global input of 3417 t d1 of JFC-IRAS particles [Carrillo-Sánchez et al., 2015;Nesvorný et al., 2011] or 3015 t d1of JFC-Planck particles [Janches et al., 2015] into the atmosphere. Meanwhile, the total mass input rates of the AST, HTC, and OCC sources are arbitrarily set to 10 t d1in the ZCM, because the ZC observations cannot be used to calibrate these mass distributions. In section 4 the absolute magnitudes of all four dust sources are optimized to get an estimate of the total input mass (TIM).
Figures 1c and 1d show the entry velocity distributions of the different populations, modeled by the ZCM. The slowest particles tend to be JFC and AST particles, and the fastest particles are HTC and OCC particles from long-period comets. The average entry velocity of the JFCs and the ASTs is 14.5 km s1 and 12.0 km s1, respectively, which means that most of these particles are in prograde orbits originating from the helion and antihelion sporadic sources [Nesvorný et al., 2011, 2010].
The velocity distribution for the HTC and OCC particles is shown in Figure 1d. The HTC distribution depends on the mass range: for masses<1μg, the distribution follows a bimodal trend with a dominant peak at 26 km s1and a second maximum at 57 km s1. For masses>1μg there is a single peak at 26 km s1. The OCC distribution exhibits a single peak at 58 km s1. Most of these particles are in a retrograde orbit, and they are likely released from the north and south apex sources.
3. Meteoric Ablation Modeling
The Chemical ABlation MODel (CABMOD) solves the momentum and energy balance for a cosmic dust par-ticle of a particular mass entering the atmosphere with a defined velocity and entry angle [Vondrak et al., 2008]. The ablation of individual elements occurs both through sputtering (i.e., collisions with air molecules causing the ejection of surface atoms, which is important before the particle melts) and the much more rapid evaporation of metal atoms and oxides after melting. CABMOD has recently been tested using the Meteoric Ablation SImulator [Bones et al., 2016], commissioned in our laboratory to test the predicted evaporation of Na, Fe, and Ca from meteoritic particles under realistic heating conditions. These tests have enabled the eva-poration kinetics of a particle around its melting point to be better described using a sigmoidal function for the uptake coefficient describing Langmuir evaporation from the melt [Vondrak et al., 2008]. For the present study we use a sigmoidal function which best describes the ablation of a carbonaceous chondrite (Allende, CV3) [Macke et al., 2011], with a melting point of 1800 K and a density of 2.2 g cm3[Consolmagno et al., 2008].
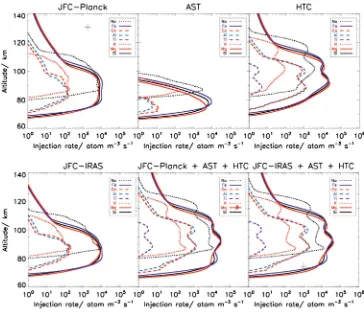
[Carrillo-Sanchez et al., 2015]. Only particles smaller than 500μm in radius (<103μg) are sampled, in order to ensure isothermal heating of the particles which is a requirement of CABMOD [Vondrak et al., 2008]. This size lim-itation is a reasonable approximation because the very large particles do not represent a significant share of the total input (Figures 1a and 1b). Each mass decade is divided intofive bins, and the velocity and zenith angle distributions are Monte Carlo selected. The resulting atmospheric ablation profiles are then coadded. Finally, the results for each mass bin are summed to obtain the integrated injection rates profiles for each metallic ele-ment [Carrillo-Sanchez et al., 2015]. The total number of sampled particles is 15,500 for each dust source, assum-ing a sample size of 500 particles per mass and 5 bins per decade in the mass range between 103and 103μg. The injection rate profiles for individual elements from the different sources are shown in Figure 2. Note that these ablation profiles have been weighted following thefitting procedure in section 4, in order to show their absolute contributions to the total input of each element. Figure 2 (top row) illustrates the contributions of JFC-Planck, AST, and HTC particles. Figure 2 (bottom left) shows the elemental ablation rate profiles for JFC-IRAS, and Figure 2 (bottom middle and bottom right) shows the total inputs for IRAS and Planck. In all cases, the most volatile elements (Na and K) ablate 10–15 km higher than the main constituent elements (Fe, Mg, and Si), which in turn ablate higher than the most refractory elements (Ca, Al, and Ti). As expected, the ablation profiles for the AST are about 10–20 km below that the corresponding profiles for the JFCs and HTCs. This is caused by their slower velocity distribution (Figure 1) and the larger particles in the AST popula-tion taking longer than the JFCs to reach the melting point. The ablapopula-tion profiles for the HTCs represent the opposite extreme. The ablation profiles for the OCCs are very similar to the HTCs and so are not shown in Figure 2.
[image:3.612.105.510.88.402.2]Meteoroids that melt but do not ablate completely become cosmic spherules. When the size of these particles is recorded in the CABMOD output, they are assumed to have a higher density (3.2 g cm3 [Kohout et al., 2014]) than the initially more porous meteoroids.
4. Determining the Contribution of Each Cosmic Dust Source
We now use three observations to constrain the relative contributions of each of these dust sources. First, the analysis of cosmic spherules at South Pole indicates a global accretion rate of 4.40.8 t d1, for spherules with diameters between 50 and 700μm [Taylor et al., 1998]. Second, the global input rate of Na atoms from meteoric ablation above 87.5 km is estimated to be 0.300.06 t d1, by taking the annual mean verticalflux of Na atoms at 87.5 km (167001800 atoms cm2s1) measured at the Starfire Optical Range (35°N) [Gardner et al., 2014], assuming that this can be extrapolated globally [Gardner et al., 2016], though we (arbitrarily) double the error to allow for uncertainty in this extrapolation, and multiplying theflux by a factor of 1.03 to obtain thetotalNa input by including the other forms of Na modeled to be present at 87.5 km [Marsh et al., 2013]. Third, the global input rate of Fe atoms above 87.5 km is estimated to be 2.291.05 t d1, by taking the ratio of the Fe to Na atom
fluxes measured at the Table Mountain Lidar Facility (40°N) to be 2.36 at 87.5 km [Huang et al., 2015, Figure 1] and multiplying by a factor of 1.38 [Feng et al., 2013] to obtain the total Fe input.
The ablation profiles of Na and Fe from each cosmic dust source (Figure 2) can now be integrated above 87.5 km to produce an ablationflux, which is then multiplied by the global surface area of the atmosphere at 87.5 km to produce a global input rate. This assumes that theflux is globally isentropic, which should be the case when integrated over a year [Feng et al., 2013]. The cosmic spheruleflux predicted by CABMOD for each dust source can similarly be converted into a global accretion rate.
We now have three simultaneous equations of the form in equation (1):
ψTotal¼αψJFCþβψASTþγψLPC (1)
where ψTotal is the global mass accretion rate of Na atoms, Fe atoms, or cosmic spherules,
[image:4.612.191.555.88.400.2]using our three criteria (see below). In the following discussion, the LPC particles are treated as HTCs unless otherwise stated.
Since there are three simultaneous equations and three unknowns (α,β, andγ), the solution is, in principle, unambiguous. However, one constraint on the solution is the elemental abundance ratio of Na to Fe in the cosmic dust particles. The measured Fe and Na atomfluxes above 87.5 km [Huang et al., 2015] correspond to a Fe:Na ratio of ~3.16. However, if the Fe:Na ratio in the cometary particles is the Carbonaceous Ivuna (CI) ratio of 15.5 [Asplund et al., 2009], then CABMOD predicts that the Fe:Na ablationflux above 87.5 km would be 3.4, 13.2, or 14.6 for the JFC, HTC, and OCC sources, respectively. Thus, even if LPC particles make up a small proportion of the total input, because they ablate relatively efficiently, this implies that the come-tary particles must be enriched in Na. There is in fact strong evidence for Na overabundance compared to Fe: a measured enrichment factor of 2.0 from the Stardust mission to comet 81P/Wild 2 [Gainsforth et al., 2015], ~2 from meteor spectroscopic analysis during the Perseid and Leonid showers [Trigo-Rodriguez and Llorca, 2007], 3.2 from the VEGA-1 mission to comet 1P/Halley [Jessberger et al., 1988], and most recently, 4.83.7 from the Rosetta mission to 67P/Churyumov-Gerasimenko [Hilchenbach et al., 2016].
The optimal fits using the JFC-Planck particles—termed the ZCM-Planck model—are Na enrichment factor = 2.5, α= 1.170.47, β= (3.461.96) × 102, and γ= (4.992.72) × 102. These values and their stated uncertainties were estimated by using Monte Carlo selection (assuming a top-hat distribution) to choose the cosmic spherule, Na and Fefluxes within their quoted uncertainties, and then solving the simultaneous equations for new values ofα,β, andγ. Trials which generated negative values of any of these parameters were rejected. A Na enrichment factor of 2.5 gave a high number of successful trials (71%) and is well within the observed range (see above). The values and their uncertainties are then the mean and standard deviations of 105trials. In terms of the global mass input rate, the contributions of the JFC, AST, and LPC particles are 34.613.8 t d1 (80%), 3.72.1 t d1 (8%), and 5.02.7 t d1 (12%), respectively. The corresponding results for the JFC-IRAS distribution (termed the ZCM-IRAS model) are shown in the supporting information.
5. Discussion
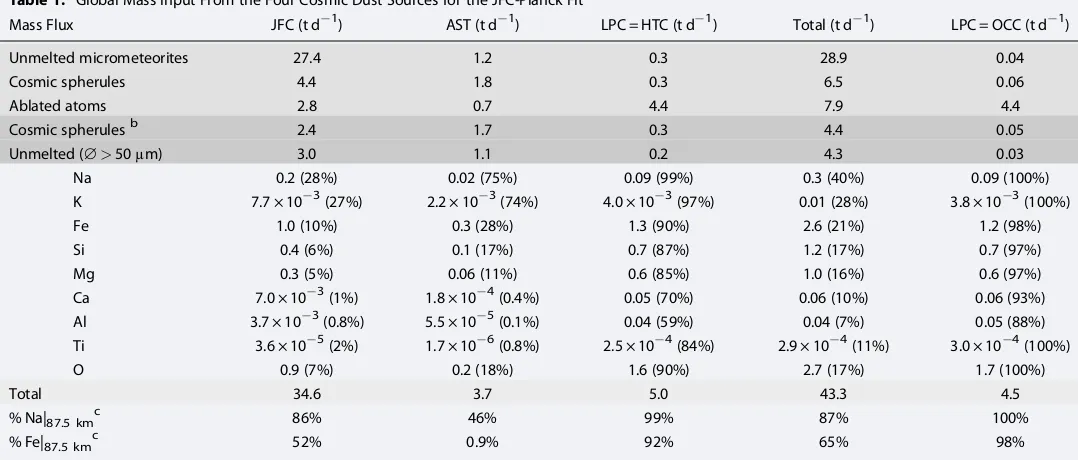
Table 1 (first to third rows) illustrates the partitioning of the accreted mass between unmelted micrometeorites, cosmic spherules, and ablated atoms, for the JFC-Planck, AST, and LPC (= HTC) dust sources. Table 1 (fifth column) shows the total from the three sources. The bottom part of Table 1 shows the ablated mass of each element for each of the dust sources. Table 1 (sixth column) shows the fate of the OCC particle population, which was calculated by setting LPC = OCC instead of HTC in thefitting procedure (minor changes to the JFC and AST outcomes are not shown in the table). Because the HTCs and OCCs are relatively fast particles (Figure 1), Table 1 shows that 88% of the HTC mass input, or 98% of the OCC mass input, ablates. As a conse-quence, these dust populations make an insignificant (6% and 1% for HTC and OCC, respectively) contribution to the cosmic spheruleflux. They also produce very similar Fe:Na ablation ratios (5.7 and 5.9, respectively, with a Na enrichment factor of 2.5). This explains why solving equation (1) does not distinguish between HTCs and OCCs.
We now consider why thefitting procedure yields such a high relative input of JFCs. The ratio of the Na mass input measured by lidar above 87.5 km [Gardner et al., 2016, 2014;Huang et al., 2015] to the cosmic spherule
flux [Taylor et al., 1998] is Na|87.5 km:ψsp= 0.07. For Fe, the corresponding ratio is Fe|87.5 km:ψsp= 0.52. These ratios can be compared with the corresponding ratios for the different sources in Table 1. The JFCs produce the closest ratios to the measurements with Na|87.5 km:ψsp= 0.08 and Fe|87.5 km:ψsp= 0.42. In contrast, the ASTs and LPCs represent lower and upper limits, since these sources are at the opposite extreme in the production of ablated atoms and spherules. For the ASTs, where there is a low average velocity, there is a significant production of spherules compared to ablated atoms, so that Na|87.5 km:ψsp= 0.01 and Fe|87.5 km:ψsp= 0.18. For the LPCs, where there is a high average velocity, the situation is reversed: Na|87.5 km:ψsp= 0.30 and Fe|87.5 km:ψsp= 4.33. Consequently, the fitting procedure determines a minor contribution from both ASTs and LPCs.
Ishiguro[2015], andRowan-Robinson and May[2013] (see section 1). It should be noted, as pointed out by Yang and Ishiguro[2015], that the analysis of Antarctic micrometeorites and cosmic dust particles collected in the stratosphere has found that less than 50% are“chondritic porous”particles, which are taken to be of come-tary origin [Noguchi et al., 2015]. In contrast, the present study indicates that 63% of unmelted micrometeorites and cosmic spherules with diameters>50μm (the lower limit for measurements) should be cometary. This may indicate that some of the“chondritic smooth”particles, assumed to be asteroidal, are wrongly assigned. Because the JFC-Planck particle mass distribution peaks around 0.01μg (Figure 1), there is only significant abla-tion of the high-mass tail of the distribuabla-tion, so that 67% of the TIM does not melt during entry.
Table 1 shows that there are striking differences in the ablation efficiencies of individual elements for the different dust sources (see Table S1 in the supporting information for the corresponding data from the ZCM-IRAS model). In the case of Na, the ablation efficiency from JFC-Planck particles is 28%, compared with 99% for LPC particles. For the highly refractory elements, the differences are even more extreme: for Ca, the ablation efficiency is 1%, compared with 70% for the LPCs. Note that even though the average velocity of ASTs is lower than JFCs (Figure 1), the ablation efficiencies are higher for all the elements apart from the most refractory (Ca, Al, and Ti) because the particle mass distribution is shifted to larger particles which tend to reach higher temperatures during atmospheric entry.
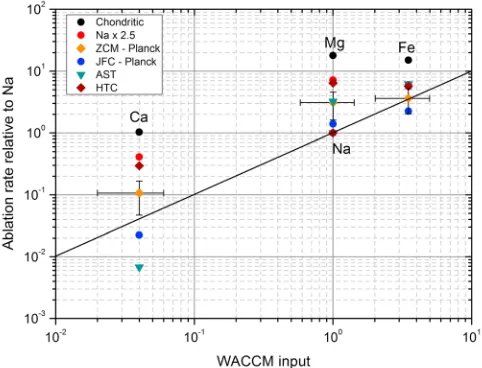
[image:6.612.36.575.98.328.2]Figure 3 correlates the ablation efficiencies of Fe, Mg, and Ca relative to Na (data taken from Table 1) against the relative ablation rates of these elements required to produce good agreement between the Whole Atmosphere Climate Model (WACCM) and lidar and satellite observations of the mesospheric metal atom layers [Carrillo-Sanchez et al., 2015]. The black circles show the CI chondritic ratios [Asplund et al., 2009], and the red circles are the CI ratios but with a Na enrichment factor of 2.5. The red points represent the case where there is no differential ablation, i.e., complete ablation of all elements, and are well above the line of 1:1 correspondence. However, when differential ablation is included, ZCM-Planck (orange diamonds) produces much improved correlation with the modeled observations. Figure 3 also shows the differential ablation ratios for the JFC, AST, and HTC particles in the ZCM-Planck model, where the HTCs essentially ablate in their chondritic ratios for all metals. In contrast, the ASTs exhibit such a high degree of differential ablation for the refractory elements that the Ca:Na ratio is well below the line of 1:1 correspondence.
Table 1. Global Mass Input From the Four Cosmic Dust Sources for the JFC-Planck Fita
Mass Flux JFC (t d1) AST (t d1) LPC = HTC (t d1) Total (t d1) LPC = OCC (t d1)
Unmelted micrometeorites 27.4 1.2 0.3 28.9 0.04
Cosmic spherules 4.4 1.8 0.3 6.5 0.06
Ablated atoms 2.8 0.7 4.4 7.9 4.4
Cosmic spherulesb 2.4 1.7 0.3 4.4 0.05
Unmelted (∅>50μm) 3.0 1.1 0.2 4.3 0.03
Na 0.2 (28%) 0.02 (75%) 0.09 (99%) 0.3 (40%) 0.09 (100%)
K 7.7 × 10³(27%) 2.2 × 10³(74%) 4.0 × 10³(97%) 0.01 (28%) 3.8 × 10³(100%)
Fe 1.0 (10%) 0.3 (28%) 1.3 (90%) 2.6 (21%) 1.2 (98%)
Si 0.4 (6%) 0.1 (17%) 0.7 (87%) 1.2 (17%) 0.7 (97%)
Mg 0.3 (5%) 0.06 (11%) 0.6 (85%) 1.0 (16%) 0.6 (97%)
Ca 7.0 × 10³(1%) 1.8 × 10⁴(0.4%) 0.05 (70%) 0.06 (10%) 0.06 (93%) Al 3.7 × 10³(0.8%) 5.5 × 10⁵(0.1%) 0.04 (59%) 0.04 (7%) 0.05 (88%) Ti 3.6 × 10⁵(2%) 1.7 × 10⁶(0.8%) 2.5 × 10⁴(84%) 2.9 × 10⁴(11%) 3.0 × 10⁴(100%)
O 0.9 (7%) 0.2 (18%) 1.6 (90%) 2.7 (17%) 1.7 (100%)
Total 34.6 3.7 5.0 43.3 4.5
% Na|87.5 kmc 86% 46% 99% 87% 100%
% Fe|87.5 kmc 52% 0.9% 92% 65% 98%
aElemental ablation inputs are italicized; the percentages in parentheses show the fraction of each element that ablates from its total atmospheric input from
each source.
bSpherules in the size range 50 μm≤∅≤700 μm corresponding to measurements at South Pole [Taylor et al., 1998]. c
6. Conclusions
In this study the absolute inputs of cosmic dust particles from four differ-ent sources—JFCs, ASTs, HTCs, and OCCs—to the Earth’s atmosphere were constrained using the measured vertical Na and Fe fluxes above 87.5 km and the accretion rate of cos-mic spherules at South Pole. Because HTCs and OCCs are characterized by high entry velocities, it is not possible to distinguish between them in terms of these constraints. Taking a JFC mass distribution determined recently from observations of the zodiacal cloud by the Planck satellite, JFCs are shown to contribute (8017)% of the total input mass of 4314 t d1, assuming a Na to Fe enrichment of 2.5 which is close to the average enrichment mea-sured in cometary particles. Finally, the differential ablation of Ca and Fe, with respect to Na, is now large enough to model the respective metal atom layers in the upper mesosphere.
References
Ade, P. A. R., et al. (2014), Planck 2013 results. XIV. Zodiacal emission,Astron. Astrophys.,571, A14.
Asplund, M., N. Grevesse, A. J. Sauval, and P. Scott (2009), The chemical composition of the Sun, inAnn. Rev. Astron. Astrophys, edited by R.
Blandford, J. Kormendy, and E. van Dishoeck, pp. 481–522 , Annual Reviews, Palo Alto, doi:10.1146/annurev.astro.46.060407.145222. Bones, D. L., J. C. Gómez-Martín, C. J. Empson, J. D. Carrillo-Sánchez, A. D. James, T. P. Conroy, and J. M. C. Plane (2016), A novel instrument to
measure differential ablation of meteorite samples and proxies: Meteoric Ablation Simulator (MASI),Rev. Sci. Instr.,87, 094504.
Carrillo-Sanchez, J. D., J. M. C. Plane, W. Feng, D. Nesvorny, and D. Janches (2015), On the size and velocity distribution of cosmic dust
particles entering the atmosphere,Geophys. Res. Lett.,42, 6518–6525, doi:10.1002/2015GL065149.
Carrillo-Sánchez, J. D., J. M. C. Plane, W. Feng, D. Nesvorný, and D. Janches (2015), Constraints on the size and velocity distribution of cosmic
dust particles entering the atmosphere,Geophys. Res. Lett.,42, 6518–6525, doi:10.1002/2015GL065149.
Consolmagno, G. J., D. T. Britt, and R. J. Macke (2008), The significance of meteorite density and porosity,Chem. Erde-Geochem.,68, 1–29.
Durda, D. D., and S. F. Dermott (1997), The collisional evolution of the asteroid belt and its contribution to the zodiacal cloud,Icarus,130,
140–164.
Feng, W., D. R. Marsh, M. P. Chipperfield, D. Janches, J. Hoeffner, F. Yi, and J. M. C. Plane (2013), A global atmospheric model of meteoric iron,
J. Geophys. Res. Atmos.,118, 9456–9474, doi:10.1002/jgrd.50708.
Fixsen, D. J., and E. Dwek (2002), The zodiacal emission spectrum as determined byCOBEand its implications,Astrophys. J.,578, 1009–1014.
Flynn, G. J. (1989), Atmospheric entry heating: A criterion to distinguish between asteroidal and cometary sources of interplanetary dust,
Icarus,77, 287–310.
Gainsforth, Z., et al. (2015), Constraints on the formation environment of two chondrule-like igneous particles from comet 81P/Wild 2,
Meteor. Planet. Sci.,50, 976–1004.
Gardner, C. S., A. Z. Liu, and Y. Guo (2016), Vertical and horizontal transport of mesospheric Na: Implications for the mass influx of cosmic
dust,J. Atmos. Sol. Terr. Phys., doi:10.1016/j.jastp.2016.1007.1013.
Gardner, C. S., A. Z. Liu, D. R. Marsh, W. H. Feng, and J. M. C. Plane (2014), Inferring the global cosmic dust influx to the Earth’s atmosphere
from lidar observations of the verticalflux of mesospheric Na,J. Geophys. Res. Space Physics,119, 7870–7879, doi:10.1002/2014JA020383.
Greenberg, R. (1982), Orbital interactions—A new geometrical formalism,Astron. J.,87, 184–195.
Grün, E., H. A. Zook, H. Fechtig, and R. H. Giese (1985), Collisional balance of the meteoritic complex,Icarus,62, 244–272.
Hilchenbach, M., et al. (2016), Comet 67P/Churyumov-Gerasimenko: Close up on dust particles fragments,Astrophys. J. Lett.,816, L32.
Huang, W., X. Chu, C. S. Gardner, J. D. Carrillo-Sánchez, W. Feng, J. M. C. Plane, and D. Nesvorný (2015), Measurements of the verticalfluxes of
atomic Fe and Na at the mesopause: Implications for the velocity of cosmic dust entering the atmosphere,Geophys. Res. Lett.,42, 169–175,
doi:10.1002/2014GL062390.
Janches, D., N. Swarnalingam, J. M. C. Plane, D. Nesvorny, W. Feng, D. Vokrouhlicky, and M. J. Nicolls (2015), Radar detectability studies of slow
and small zodiacal dust cloud particles. II. A study of three radars with different sensitivity,Astrophys. J.,807, 13.
Jessberger, E. K., A. Christoforidis, and J. Kissel (1988), Aspects of the major element composition of Halley dust,Nature,332, 691–695.
Kohout, T., A. Kallonen, J. P. Suuronen, P. Rochette, A. Hutzler, J. Gattacceca, D. D. Badjukov, R. Skála, V. Böhmová, and J.Čuda (2014), Density,
porosity, mineralogy, and internal structure of cosmic dust and alteration of its properties during high-velocity atmospheric entry,Met.
[image:7.612.178.419.91.275.2]Planet. Sci.,49, 1157–1170.
Figure 3.Ablation rates for Ca, Fe, and Mg relative to Na, plotted against the relative input rates required to model the global metal atom layers in the MLT using WACCM [Carrillo-Sanchez et al., 2015]. The solid line is the 1:1 correlation line. The black points show the relative CI chondritic compositions, and the red points are the CI compositions with a Na enrichment factor of 2.5. The predicted ratios for the JFC-Planck, AST, and LPC sources are also shown (see legend). For the overall ZCM-Planck prediction (orange diamonds), the horizontal error bars indicate the uncertainties in the WACCM ratios, and the vertical error bars show the uncertainties in the relative ablation rates derived from the Monte Carlo analysis (see text).
Acknowledgments
This work was supported by the European Research Council (project
291332—CODITA). D.N. has been
Macke, R. J., G. J. Consolmagno, and D. T. Britt (2011), Density, porosity, and magnetic susceptibility of carbonaceous chondrites,Meteor. Planet. Sci.,46, 1842–1862.
Marsh, D. R., D. Janches, W. Feng, and J. M. C. Plane (2013), A global model of meteoric sodium,J. Geophys. Res. Atmos.,118, 11,442–11,452,
doi:10.1002/jgrd.50870.
Nesvorný, D., D. Janches, D. Vokrouhlický, P. Pokorný, W. F. Bottke, and P. Jenniskens (2011), Dynamical model for the zodiacal cloud and
sporadic meteors,Astrophys. J.,743, 129–144.
Nesvorný, D., P. Jenniskens, H. F. Levison, W. F. Bottke, D. Vokrouhlický, and M. Gounelle (2010), Cometary origin of the zodiacal cloud and
carbonaceous micrometeorites. Implications for hot debris disks,Astrophys. J.,713, 816–836.
Noguchi, T., N. Ohashi, S. Tsujimoto, T. Mitsunari, J. P. Bradley, T. Nakamura, S. Toh, T. Stephan, N. Iwata, and N. Imae (2015), Cometary dust in
Antarctic ice and snow: Past and present chondritic porous micrometeorites preserved on the Earth’s surface,Earth Planet. Sci. Lett.,410,
1–11.
Plane, J. M. C. (2012), Cosmic dust in the Earth’s atmosphere,Chem. Soc. Rev.,41, 6507–6518.
Pokorný, P., D. Vokrouhlický, D. Nesvorný, M. Campbell-Brown, and P. Brown (2014), Dynamical model for the toroidal sporadic meteors,
Astrophys. J.,789, 25.
Rowan-Robinson, M., and B. May (2013), An improved model for the infrared emission from the zodiacal dust cloud: Cometary, asteroidal and
interstellar dust,Mon. Not. Roy. Astron. Soc.,429, 2894–2902.
Taylor, S., J. H. Lever, and R. P. Harvey (1998), Accretion rate of cosmic spherules measured at the South Pole,Nature,392, 899–903.
Trigo-Rodriguez, J. M., and J. Llorca (2007), On the sodium overabundance in cometary meteoroids,Adv. Space Res.,39, 517–525.
Vondrak, T., J. M. C. Plane, S. Broadley, and D. Janches (2008), A chemical model of meteoric ablation,Atmos. Chem. Phys.,8, 7015–7031.