Rochester Institute of Technology
RIT Scholar Works
Theses Thesis/Dissertation Collections
7-2017
Production Quality for Process Capability with
Multiple Characteristics on the Chip Resistor
Production
Sujeong Seo [email protected]
Follow this and additional works at:https://scholarworks.rit.edu/theses
This Thesis is brought to you for free and open access by the Thesis/Dissertation Collections at RIT Scholar Works. It has been accepted for inclusion in Theses by an authorized administrator of RIT Scholar Works. For more information, please [email protected].
Recommended Citation
Production Quality for Process Capability with
Multiple Characteristics on the Chip Resistor
Production
by
Sujeong Seo
A Thesis submitted in partial fulfillment of the requirements for
the Degree of Master of Science in Applied Statistics
Department of Applied Statistics
College of Science
Rochester Institute of Technology
Rochester Institute of Technology
College of Science
Master of Science in Applied Statistics
Thesis Approval Form
Student Name: Sujeong Seo
Thesis Title:
Production Quality for Process Capability with Multiple
Characteristics on the Chip Resistor Production
Thesis Committee
Name
Signature
Date
Dr. Robert Parody
Thesis Advisor
Dr. Linlin Chen
Committee member
Abstract
There are many journal papers about process capability indices with multiple
characteristics in certain manufacturing assemblies including !", !"#, !"$, and !"%. However, all
of them assume the data is normal distribution and there is no product level process capability with an example chip resistor. This paper will discuss the affection of sample mean and standard deviations on process capability indices for multiple quality characteristics and its product assembly instead of assuming as normal distributions with the data from simulation.
Acknowledgments
I would like to express my sincere appreciation to my thesis advisor Dr. Parody for all of his guidance and wisdom throughout this project, from inception to completion, as well as his incredible and unwavering patience in working with me over the past semesters. Additionally, I thank and acknowledge my committee members for their input and encouragement.
I would also like to thank and acknowledge the many current and former faculty, classmates, and friends through the department of Applied Statistics that I have had the incredible joy and
pleasure of working with over the course of my graduate education: Matthew Williams whom I have been studied with for a full two years. Anisia Jabin who supports me the most with
Matthew. Also, I would like to recognize Marcos Micheal Soriano Almanzar, with whom it has been a pleasure both inside and out of the classroom. Additionally, I would like to thank and acknowledge my friends from Iowa. During my undergraduate degree, I met good friends who still pray for my well-being and study: Andrea Alert who was my viola teacher and best friend in the United States. She always told me that I could do it if I continued to work, and that
everything would be okay whenever I was down. Caryn and John Cowger, my host parents, who have taken care of me the most like my family in Korea. Kat Benjegerdes who was my first roommate and a good friend since then.
Table of Contents
1 Introduction ... 8
2 Related Work ... 9
2.1 Process Capability Analysis for the quality management ...9
2.2 Quality management in the electronic manufacturing industry ...11
3 Methodology ... 12
3.1 Introduce the product ...12
3.2 Data Collection ...13
3.3 Process capabilities for multiple quality characteristics ...13
3.4 Relationship between capability process and sample data ...14
3.5 Product level process capabilities ...14
3.5.1 Weighted mean ...14
4 Results ... 17
4.1 Process capabilities for multiple quality characteristic ...17
4.2 Relationship between multiple process capability and sample data ...19
4.3 Product level process capabilities ...20
5 Discussion ... 22
5.1 Multiple Quality Characteristics Analyses ...22
5.2 Sample Size ...22
5.3 Product level Capability Analyses ...22
6 Conclusion ... 24
7 Reference ... 25
List of Figures
Figure 1: H-type chip resistor (Ouyang et al., 2013) ... 12
Figure 2: Changes on !& and !&' of Product 1 Upper Width ... 19
Figure A. 1 Product 1 Length ... 27
Figure A. 2 Product 1 Width ... 28
Figure A. 3 Product 1 Height ... 28
Figure A. 4 Product 2 Length ... 29
Figure A. 5 Product 2 Width ... 29
Figure A. 6 Product 2 Height ... 30
Figure A. 7 Product 2 Upper width ... 30
Figure A. 8 Product 2 Lower width ... 31
Figure A. 9 Product 3 Length ... 31
Figure A. 10 Product 3 Width ... 32
Figure A. 11 Product 3 Height ... 32
Figure A. 12 Product 3 Upper width ... 33
Figure A. 13 Product 3 Lower width ... 33
Figure A. 14 Product 4 Length ... 34
Figure A. 15 Product 4 Width ... 34
Figure A. 16 Product 4 Height ... 35
Figure A. 17 Product 4 Upper width ... 35
Figure A. 18 Product 4 Lower width ... 36
Figure A. 19 Product 5 Length ... 36
Figure A. 20 Product 5 Width ... 37
Figure A. 21 Product 5 Height ... 37
Figure A. 22 Product 5 Upper Width ... 38
Figure A. 23 Product 5 Lower width ... 38
Figure A. 24 Product 6 Length ... 39
Figure A. 25 Product 6 Width ... 39
Figure A. 26 Product 6 Height ... 40
Figure A. 27 Product 6 Upper width ... 40
List of Tables
Table 1 Specifications of products ... 13
Table 2 Five quality conditions (Chen et al, 2001). ... 13
Table 3 Dynamic weight ... 16
Table 4 Sample data with specifications of products ... 18
Table 5 Product level with !& ... 21
1
Introduction
Quality is the most important factor in research, development and robust design within the manufacturing industry since customer needs and product satisfaction is rapidly changing through globalization. Globalization brought wide sets of choices to consumers when planning to purchase products. Therefore, consumers’ feedback regarding product quality became an
important aspect in the manufacturing industry. Furthermore, quality of a product is related to the defect of a product. Based on the business dictionary, the definition of a defective product is a commercially manufactured product which has inadequate assembly, design, or manufacture. Both assembly and manufacture are correlated to quality process. Assembly and manufacture failures are often decided by quality level like process capability indices (PCIs). With technology development, production engineers have struggled with quality management in the
manufacturing industry. To solve the problem and evaluate the quality of products, research and development (R&D) and robust design has become popular.
Process capability analysis for robust design, manufacturing quality, and process planning have been used and evaluated in journal papers for the past decades. In this paper, we are going to introduce literature of the research which was already introduced in journals and peer reviewed. Additionally, we would propose new methodology to evaluate the process capability with existing PCIs and relationship between PCIs and sample mean and standard deviation. We cannot defect the entire product in the production because of the time limitation and cost. Therefore, many researchers set the experiment to analyze or generate the data by simulation which is close to the practical environment. Many journal papers adapt process capability analysis such that it is assumed that their data are all normally distributed. In the simulation section, we will discuss sample mean and standard deviations with simulated data without assuming the normal distribution.
With an example product, quality characteristics and product level PCIs including !" and !"#
will be generated.
2
Related Work
2.1 Process Capability Analysis for the quality management
The goals of the R&D are to determine specs of a product which meets customer
requirements in a short period of time and introduce into the market while maintaining the lowest production cost with premium product quality. Robust product design or Taguchi methods is a popular technique to use in the manufacturing industry for the R&D of productions. Robust product design is introduced by Dr. Genichi Taguchi, a Japanese quality guru. It is defined as making the product insensitive on variation. The variation (or often referred as noise) can come from a variety of factors and be allocated to three main type: internal, external variations, and variation between two units. Internal variation is caused by degeneration such as aging of materials. External variation is caused by factors relating to environmental conditions such as temperature, humidity and dust. Unit to Unit variation is variations between parts like variations in material, processes and equipment (Lochner and Matar, 18).
In order to control variations, many researchers have used process capability analysis with design of experiment for robust design for production quality improvement. Jeang (2013) demonstrated his robust design research with process capability analysis as multiple response values for statistical analysis like Response Surface Methodology (RSM).
A process dimension in the ISEO/IEC 15504 defines process as a unique set of customer-supplier, engineering, supporting, management, organizations, IT service, and enterprise. For the manufacturing line, a process is often defined as a combination of tools, materials, methods, and people engaged in producing measurable output. All processes have built in statistical variability which can be evaluated by statistical methods (Bothe 1997). The output of a process is expected to meet customer requirements, specifications, or engineering tolerance. Process capability is ability of the process to realize a characteristic that will satisfy the requirements of the characteristic based on the ISSO 25517-4. In addition, the process capability is a measurable component of a process to the specification, can be expressed as a process capability index like
material, product, or service. Specifications must be respected to avoid sanctions (Montgomery 1997).
Juran (1974) firstly introduced the concept of process capability index (PCI) and
evaluated a PCI !" which combines the process parameters with product specification if the data
have a normal distribution in his handbook. This index is defined as
!" =
*+, − ,+,
6/ 2.1
where USL and LSL are the upper and the lower specification limits of the product, respectively;
/ is the process standard deviation.
Process capability indices include !"$, !"%, and !"#, were introduced by Victor Kane
who was a manager of the Applied Systems Analysis Department within Ford Motor Company to provide statistical measures on process performance for quality and reliability assurance. These indices are defined as
!"$ = *+, − 4
3/ , !"% =
4 − ,+,
3/ , !"# = min
*+, − 4
3/ ,
4 − ,+,
3/ 2.2
In 1988, Cpm is proposed as a new measure of process capability indices by Chan, Cheng, and Spiring. Past decades, process capability indices (PCIs) have been evaluated by several
researchers in the manufacturing industry (Pearn et al., 1992, 1998; Kotz and Lovelace 1998; Chen KS 2001; Kotz and Johnson, 2002 for more details).
Ouyang, Hsu et al (2013), Pearn and Chien-Wei (2005) mentioned efficiency of PCIs for the normally distributed processes. !"# and !" are adequate measures for processes with
two-sided specifications. The specification tolerance which is linked to overall process variation can be measured by the index !". It mirrors process potential or precision. Also, !"# provides
process performance in proportion of compliances like yield.
Usually, most factory applications in a product have several quality characteristics with different levels of specifications limits. This requires greater time consumption through
proposed by Chen et al. (2003). However, both do not show the product’s level quality. These analysis charts show whether all quality characteristics are in an acceptable range or not.
2.2 Quality management in the electronic manufacturing industry
Weber et al. (1991) and Dickson (1996) introduced that process quality has been significantly emphasized in the competitive electronics industry. Also, several researchers like Chen et al (2001), Pearn and Wu (2006), and other quality experts indicated process
3
Methodology
Process capability analysis had major five procedures: process selection and collect the data of the process, identify specific limits according to which capability analysis will be evaluated, verify the process is under statistical control, analyze data distribution, and lastly, estimate capability indices (Montgomery 1997). Specification limits can be divided into two limits: The Upper Specification Limit (USL) and the Lower Specification Limit (LSL). These limits are usually target values. Specifications are often provided from production requirements or market requirements. If both USL and LSL are specified, it is considered two-sided. When one of USL and LSL is specified, it is considered one-sided specifications. In this paper, we will not follow this traditional process capability analysis steps, but it each step will be presented with different order. We already have specification limits about the product from a research (Ouyang, Hsu, and Yang, 2013) and a company browser (HVR). Then we select the process and run data collection through simulation method. In the following sections, details of our case product will be introduced and other detail methods we used for process capability analysis for the case product.
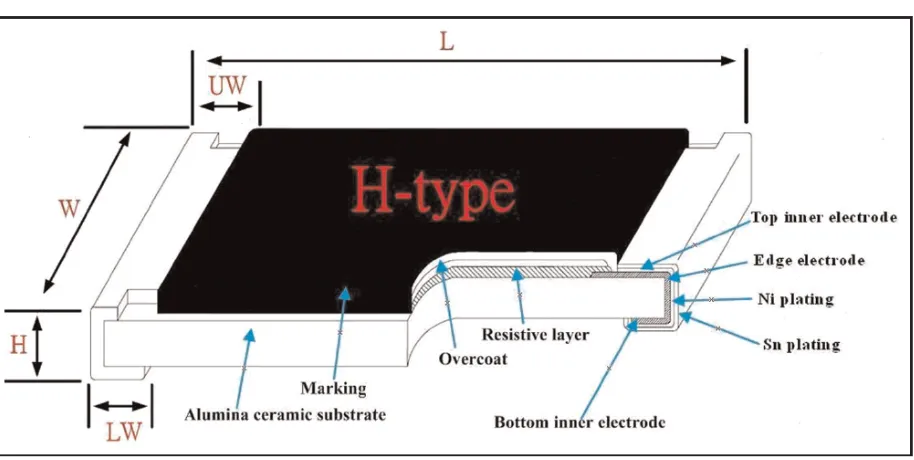
[image:13.612.83.540.407.637.2]3.1 Introduce the product
Figure 1: H-type chip resistor (Ouyang et al., 2013)
have multiple quality characteristics and how to analyze. Illustrative aspect of the product is show in the figure 1. This H-type chip resistor has five quality characteristics: Length, Width, Height, Upper Width, and Lower Width. This five quality characteristics belong into a set of specification. Furthermore, H-type chip resistor is one of the most common chip resistors. Usually, there are more than a set of specifications under a chip resistor. Many manufacturers have at least five sets of specifications. In this research, we adapt six sets of specifications under the H-type chip resistor (HVR).
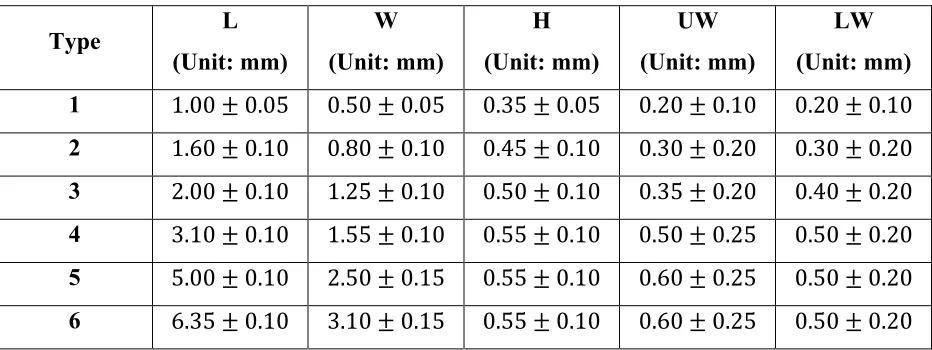
Table 1 Specifications of products
Type L
(Unit: mm) W (Unit: mm) H (Unit: mm) UW (Unit: mm) LW (Unit: mm)
1 1.00 ± 0.05 0.50 ± 0.05 0.35 ± 0.05 0.20 ± 0.10 0.20 ± 0.10
2 1.60 ± 0.10 0.80 ± 0.10 0.45 ± 0.10 0.30 ± 0.20 0.30 ± 0.20
3 2.00 ± 0.10 1.25 ± 0.10 0.50 ± 0.10 0.35 ± 0.20 0.40 ± 0.20
4 3.10 ± 0.10 1.55 ± 0.10 0.55 ± 0.10 0.50 ± 0.25 0.50 ± 0.20
5 5.00 ± 0.10 2.50 ± 0.15 0.55 ± 0.10 0.60 ± 0.25 0.50 ± 0.20
6 6.35 ± 0.10 3.10 ± 0.15 0.55 ± 0.10 0.60 ± 0.25 0.50 ± 0.20
3.2 Data Collection
There are several softwares we can generate the random sampling data; Microsoft Office Excel, statistical software R, and ANSYS. Distributions of the data can easily be detected through characteristics of output variable and sample size. This paper used R software to generate the sample data since we already have specifications and some of sample means and standard deviations.
3.3 Process capabilities for multiple quality characteristics
In the section 3.1., we indicate a set of specifications of H-type chip resistor. Also, we select six sets of specifications. Therefore, we have thirty process quality characteristics overall. We are going to calculate PCIs such as !", !"$, !"%, and !"#. Quality level of each component
3.4 Relationship between capability process and sample data
PCIs like !" and !"# are impacted by sample standard deviations. !" and !"# are inverse
proportion with sample standard deviations. Especially, !"# is affected by sample means as well.
Therefore, we would like to present how sample mean and standard deviations affect !" and !"#
for individual processes. For instance, if sample mean is closed to lower specification limits, do
!" and !"# get increased or decreased?
3.5 Product level process capabilities
Many research papers introduced in the related work section did not indicate process capability of entire product, but only quality characteristics processes. There are several ways we can calculate product level process capabilities with statistical methods such as mean, median, and mode. In this paper, we are going to use mean among statistical methods.
3.5.1 Weighted mean
In probability and statistics, population mean and expected value are used synonymously to refer to one measure of the central tendency either of a probability distribution or of the random variable characterized by that distribution (Feller, 1950). For a data set, the terms arithmetic mean, mathematical expectation, and sometimes average are used synonymously to refer to a central value of a discrete set of numbers: specifically, the sum of the values divided by the number of values. The arithmetic mean of a set of numbers ?@, ?A, … , ?Cis typically denoted by ?, pronounced “x bar”. If the data set were based on series of observations obtained by sampling from a statistical population, the arithmetic mean is termed the sample mean (denoted
If we think about mean is also known as arithmetic mean (AM). AM of a sample
?@, ?A, … , ?C, usually denoted by ?, is the sum of the sampled values divided by the number of
items in the sample:
? =?@+ ?A+ ⋯ + ?C
F (3.1)
In this case, each of the data points contributing equally to the final average. We are going to call this ordinary arithmetic mean as unweighted mean. If we convert this arithmetic mean into product quality values like expected value, we can rewrite the equation as
I !J = 4K = 1
FLJM@C NJ 3.2
Simple expected values have the same impacts on different values into one sample mean. Therefore, we decided to adapt arithmetic weighted mean into our weighted mean of product processes. Its equation can be simply written as follows
I ! = LJM@C O
J4J. 3.3
The concepts of weighted average and its extended functions are introduced by Hardy et al. Grossman et al (1980) where it is indicated the weighted averages of functions as they pertain to the important roles in the systems of differential and integral calculus. Furthermore, in this article, we are going to use its statistical properties which are indicated in the previous
paragraphs with the mathematical definition. Formally, the weighted mean of a non-empty set of data can be written as
N@, NA, … , NC , 3.4
where x represents a set of values with non-negative weights can be written by:
N =LJM@
C O JNJ
LJM@C O
J , 3.5
which means:
N = O@N@+ OANA+ ⋯ + OCNC
O@+ OA+ ⋯ + OC 3.6
Therefore, data elements with a high weight contribute more to weighted mean than do elements with a low weight. The weights cannot be negative; However, some may be zero, with the assumption that all weights are not equal to 0. The formulas are simplified when the weights are normalized such that they sum up to 1, i.e. LJM@C O
weighted mean is simply as the weighted sample mean. Using the normalized weight yields the same results as when using the original weights. Indeed,
N = LJM@C OJPNJ = LJM@C
OJ LQM@C O
QNJ =
LJM@C O JNJ
LQM@C O Q =
LJM@C O JNJ
LJM@C O
J 3.7
In this study, we adapt the reliability weights which have normalized weight:
S@ = LJM@T O
J = 1. 3.8
Where summation i equals to one to five which are number of quality component within a product. Then the weighted mean vector 4∗can be simplified to
4∗ = L
JM@T OJNJ. 3.9
There are two ways you can use this normalized weight methodology. One is using the proportion of each of the process capability values. Another is adjusted weight which uses proportions inversely. In the proportion weighted mean, a higher capability value has higher proportion in the product processes capability. However, higher capability values get a lower weight in the inverse proportion method. We are going to call the proportion method as the weighted mean and the inverse proportion method as the adjusted weighted mean. With these two methods and simple arithmetic average, we can compare the results under the normalized weight, wherein all weights are sum up to 1.
However, it does not show variability of processes capability even if there exist large variations in process capability between characteristics. Therefore, we decided to make a
dynamic mean. Weights are different by 10 or 100 depending on the values of process capability. For example, if process capability values are less than 1, the weight is 10. Then process
capability value is greater than 2, weight become 0.1. Details of the weights are presented in the table 3.
4
Results
4.1 Process capabilities for multiple quality characteristic
Through R software, we generated the random sampling data. With its sample mean and standard deviations, we calculated !", !"$, !"%, and !"# and it is presented in the table 2. Each
product has different levels of quality characteristics.
Instead of reading individual PCIs, we can compare and contrast these multiple quality characteristics under quality conditions. Some have extreme difference between processes, but others have very similar capability values.
There are extremely low and best level of processes in the Product 1. Product 1 has varied results based on the quality levels of each quality characteristics. Width and height are
inadequate, and length is capable. The other two characteristics are super levels. Product 3 has capable, excellent, and super level of quality processes. Also, Product 4 has capable and super level of quality processes like large gaps between quality components like product 1.
However, Product 5 and 6 have similar quality levels, which means that they fall into the same quality level. All components in product 5 are capable, but product 6 has all super quality level. Additionally, PCIs of product 2 belong to two quality levels, which are super and
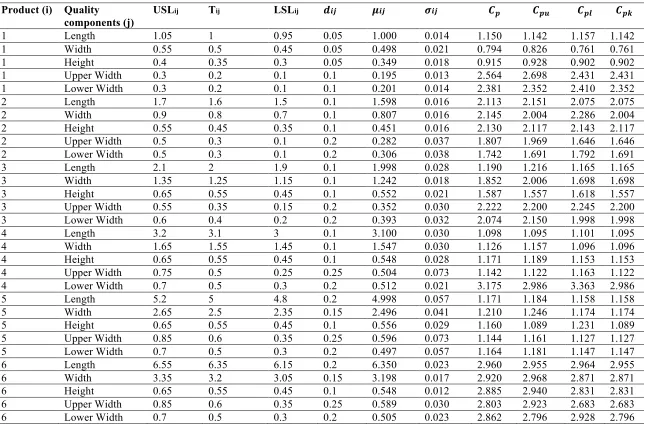
Table 4 Sample data with specifications of products Product (i) Quality
components (j)
USLij Tij LSLij !"# $"# %"# &' &') &'* &'+
1 Length 1.05 1 0.95 0.05 1.000 0.014 1.150 1.142 1.157 1.142
1 Width 0.55 0.5 0.45 0.05 0.498 0.021 0.794 0.826 0.761 0.761
1 Height 0.4 0.35 0.3 0.05 0.349 0.018 0.915 0.928 0.902 0.902
1 Upper Width 0.3 0.2 0.1 0.1 0.195 0.013 2.564 2.698 2.431 2.431
1 Lower Width 0.3 0.2 0.1 0.1 0.201 0.014 2.381 2.352 2.410 2.352
2 Length 1.7 1.6 1.5 0.1 1.598 0.016 2.113 2.151 2.075 2.075
2 Width 0.9 0.8 0.7 0.1 0.807 0.016 2.145 2.004 2.286 2.004
2 Height 0.55 0.45 0.35 0.1 0.451 0.016 2.130 2.117 2.143 2.117
2 Upper Width 0.5 0.3 0.1 0.2 0.282 0.037 1.807 1.969 1.646 1.646
2 Lower Width 0.5 0.3 0.1 0.2 0.306 0.038 1.742 1.691 1.792 1.691
3 Length 2.1 2 1.9 0.1 1.998 0.028 1.190 1.216 1.165 1.165
3 Width 1.35 1.25 1.15 0.1 1.242 0.018 1.852 2.006 1.698 1.698
3 Height 0.65 0.55 0.45 0.1 0.552 0.021 1.587 1.557 1.618 1.557
3 Upper Width 0.55 0.35 0.15 0.2 0.352 0.030 2.222 2.200 2.245 2.200
3 Lower Width 0.6 0.4 0.2 0.2 0.393 0.032 2.074 2.150 1.998 1.998
4 Length 3.2 3.1 3 0.1 3.100 0.030 1.098 1.095 1.101 1.095
4 Width 1.65 1.55 1.45 0.1 1.547 0.030 1.126 1.157 1.096 1.096
4 Height 0.65 0.55 0.45 0.1 0.548 0.028 1.171 1.189 1.153 1.153
4 Upper Width 0.75 0.5 0.25 0.25 0.504 0.073 1.142 1.122 1.163 1.122
4 Lower Width 0.7 0.5 0.3 0.2 0.512 0.021 3.175 2.986 3.363 2.986
5 Length 5.2 5 4.8 0.2 4.998 0.057 1.171 1.184 1.158 1.158
5 Width 2.65 2.5 2.35 0.15 2.496 0.041 1.210 1.246 1.174 1.174
5 Height 0.65 0.55 0.45 0.1 0.556 0.029 1.160 1.089 1.231 1.089
5 Upper Width 0.85 0.6 0.35 0.25 0.596 0.073 1.144 1.161 1.127 1.127
5 Lower Width 0.7 0.5 0.3 0.2 0.497 0.057 1.164 1.181 1.147 1.147
6 Length 6.55 6.35 6.15 0.2 6.350 0.023 2.960 2.955 2.964 2.955
6 Width 3.35 3.2 3.05 0.15 3.198 0.017 2.920 2.968 2.871 2.871
6 Height 0.65 0.55 0.45 0.1 0.548 0.012 2.885 2.940 2.831 2.831
6 Upper Width 0.85 0.6 0.35 0.25 0.589 0.030 2.803 2.923 2.683 2.683
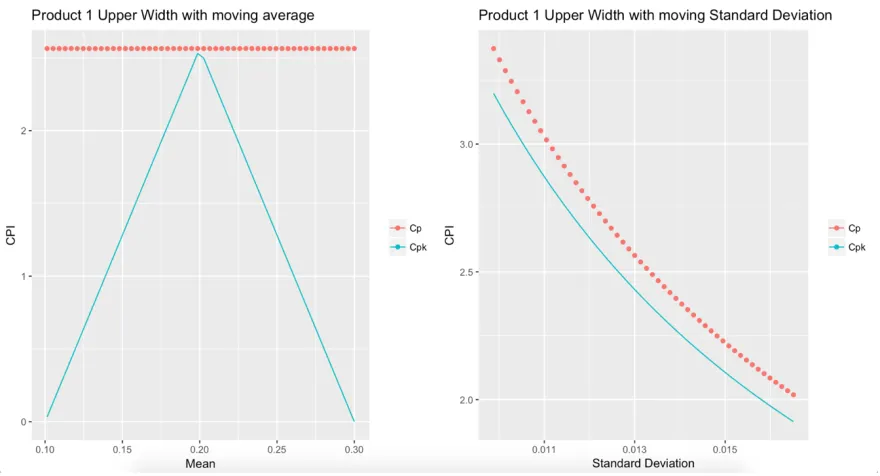
4.2 Relationship between multiple process capability and sample data
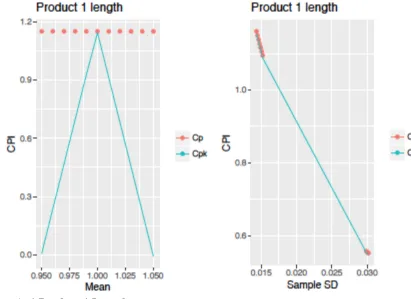
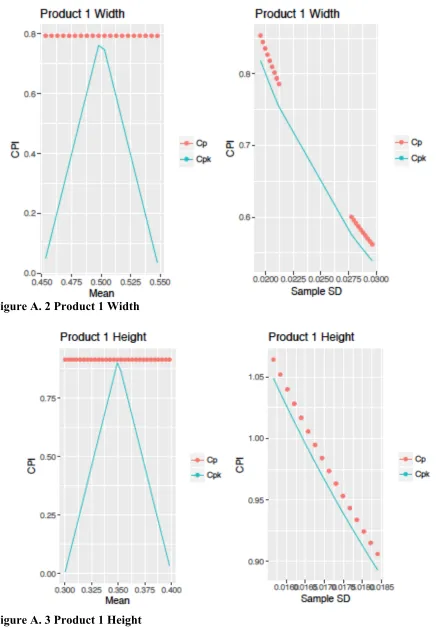
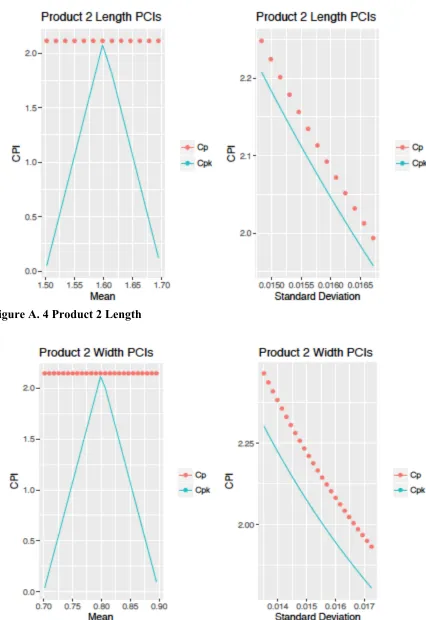
Figure 2: Changes on !" and !"# of Product 1 Upper Width
All the journals which indicated previous sections assumed all data are normal
distribution with random sampling, such as the Central Limit Theorem (large-sample normality of its sampling distribution) and the Law of Large Numbers (convergence to the population mean as n increases) apply also to sample proportions. However, large sample sizes, which is
determined to be greater than 25 or 30, are not always available in the manufacturing industry. Also, many engineers have difficulty detecting the distributions of the data they are analyzing without statistical inference in the quality improvement movement in 1960’s (Johnson, 2001). According to the equations in the introduction section, in the process capability indices, especially; $% and $%& are mainly dependent on sample mean (') and sample standard deviation ( (). In figure 2 it is shown that changes of sample mean and standard deviation changes
hundredth of sample means and standard deviations for each of the quality components. Sample mean change is followed by lower specification limits to upper specification limits. Also,
standard deviation is increased and decreased like lower specification limit to upper specification limits.
limit to upper specification limit. However, $%& is increased around mean or center values and decreased while it goes up to upper limit specification. Furthermore, standard deviation impacts $% and $%& much more than mean values. Both $% and $%& get decreased when the sample standard deviation increased.
There is one more characteristics which effects on the sample size indirectly with $% and $%&; Distance. Distance is the difference between upper and lower specification limits. All components have the same patterns while the changes of sample mean and standard deviations are applied as is shown in the figure 2. However, range, which is more like distance between lower and upper specification limits, are varied. Also, depending on the distance of the
components, changing gaps are different. For example, upper and lower widths have a greater distance than other characteristics. Some have five or six levels of changes between center specification to upper or lower limits. Others have around 20 to 25 levels of changes.
4.3 Product level process capabilities
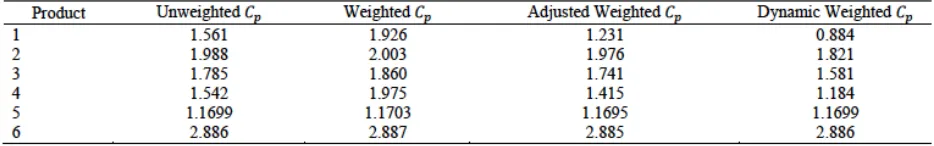
Both product level PCIs can be calculated in Excel with average, sumproduct, and sum functions. The weight of each product type is defined as the percentage of each of the quality components which is the proportion of sum of process capabilities. For example, sum of $% value for product type 1 is 7.803. If we calculate the probability sum up to 1, upper width and lower width have 0.329 and 0.305 as both values are above 2.00, indicating that these are a super level of quality components. Based on these probabilities, weighted $% for product 1 is 1.926, which is larger than the simple arithmetic mean.
With this weighted methodology, we can extend process capability values beyond the simple arithmetic mean as product level processes. However, it causes a defective product problem. Like product 1, if an inadequate quality level is accepted and sold to consumers, it means that we could not detect an unreliable product. However, if we consider all weighted means as unreliable, products which do not have extreme values like inadequate and super quality level of C values can be rejected even though the product has good quality processes.
The details of product level PCIs are presented in the table 5 and 6 including three different weighted and unweighted PCIs, $% and $%& and list of product types.
Table 5 Product level with $%
[image:22.612.80.541.273.346.2]5
Discussion
5.1 Multiple Quality Characteristics Analyses
Our research used only $%and $%& among several PCIs which have a strong relationship with the mean and standard deviation. In the future research, we can use other PCI techniques such as $%) and $%&) which are strongly related to the target value, T. Also, process capability analysis
is often mentioned with Six Sigma and the Taguchi method. For example, $%) is known as the
Taguchi capability index. We can analyze the data from this research with Six Sigma or Taguchi methods. Then we can compare and contrast the result so that we can decide which method is the most effective in the practical cases.
5.2 Sample Size
In this study, we generated a large size of the sample data so that we could simply assume the data is a normal distribution. However, we cannot always get a large number of the data in the practical world. We can test the same methodology as changing mean and standard deviation with small size of the data.
5.3 Product level Capability Analyses
We used mean and weighted mean techniques among several statistical methods. Among four different methods, dynamic weighted mean and unweighted mean have the same results in product 5 and 6 which have a small difference and the same quality levels of conditions in multiple quality characteristics. However, the products 1, 2, and 4 which have high variations among quality characteristics have low product capability values under the dynamic weighted.
Both dynamic weight and adjusted weighted method allow to detect whether individual quality characteristics have low process capability or not and how much it impacts upon the product level quality. However, the weighted mean method covers up the low capability values with the values from high quality parts.
Lastly, in further research, we can use mode and median as product level process
6
Conclusion
In this study, we defined the product quality levels on process capability indices like $%, $%*, $%+, and $%& with individual quality characteristics and $% and $%& for product level quality
processes. We have tested $% and $%& with changing mean and standard deviation values. $% does not get effected by changing mean values, but $%&does. However, when the standard
deviation values get smaller, both $% and $%& get affected in the processes.
Also, we generated sample data with large size sample so that we can simply assume our data distribution is normal, but instead of simply assuming the normality, we tested the data. The result does show the same result with changing sample mean and standard deviations on PCIs.
7
Reference
Aldanondo, Michel, Elise Vareilles, and Meriem Djefel. "Towards an association of product configuration with production planning." International Journal of Mass Customisation 3, no. 4 (2010): 316-332.
Bare, Marshall, and Jordan J. Cox. "Applying principles of mass customization to improve the empirical product development process." Journal of Intelligent Manufacturing 19, no. 5 (2008): 565-576.
Bothe, Davis R. "Measuring process capability." Techniques and calculations for quality and manufacturing engineers. Nova Iorque: McGraw-Hill (1997).
Carter, Donald E., and Barbara Stilwell Baker. CE, concurrent engineering: the product development environment for the 1990s. Addison Wesley Publishing Company, 1992. Chan, L. K., Cheng, S. W., & Spiring, F. A. 1988. “A new measure of process capability: Cpm.”
Journal of Quality Technology, 20(3).
Chen, K. S., M. L. Huang, and R. K. Li. "Process Capability Analysis for an Entire
Product." International Journal of Production Research 39, no. 17 (2001), 4077-4087. Chen, K. S., W. L. Pearn, and P. C. Lin. "Capability measures for processes with multiple
characteristics." Quality and Reliability Engineering International 19, no. 2 (2003): 101-10. doi:10.1002/qre.513.
Defective product. BusinessDictionary.com. WebFinance, Inc.
http://www.businessdictionary.com/definition/defective-product.html
(accessed: July 05, 2017).
Feller, William. An introduction to probability theory and its applications. New York: John Wiley & Sons, vol. 1. pp.221, 1950.
G. W. Dickson, “An analysis of vendor selection: systems and decisions,” Journal of Purchasing, vol. 1, pp. 5–17, 1966.
Grossman, Jane, Michael Grossman, and Robert Katz. The first systems of weighted differential and integral calculus. Rockport, MA: Archimedes Foundation, 1980.
Gujarat, Damodar N. 2006 Essentials of Econometrics. Irwin: McGraw-Hill, 3rd edition, p. 110. Hardy, G. H., J. E. Littlewood, and George Pólya. Inequalities. 2nd ed. Cambridge:
Cambridge University Press, 1988.
http://www.token.com.tw/pdf/chip-resistor/chip-resistor-hvr.pdf
Huang, W., & Kong, Z. (2010). Process Capability Sensitivity Analysis for Design Evaluation of Multistage Assembly Processes. IEEE Transactions on Automation Science and
Engineering, 7(4), 736-745. doi:10.1109/TASE.2009.2034633
Jeang, Angus. 2013 “Robust product design and process planning in using process capability Analysis.” Journal of Intelligent Manufacturing 26, no. 3, 459-70.
doi:10.1007/s10845-013-0802-6.
Johnson, Richard A. "Miller & Freund's Probability and Statistics for Engineers." Iie Transactions 33, no. 9 (2001): 823-825.
Juran, M. J. Juran’s quality control handbook. 3rd ed. New York: McGraw Hill, 1974. Kane, V.E. 1986. Process capability indices. Journal of Quality Technology 18 (1), 41–52. Kotz, S., Johnson, N.L. 2002. Process capability indices—a review, 1992–2000.
Journal of Quality Technology 34 (1), 1–19.
MONTGOMERY, Douglas C. Introduction to statistical quality control. New York: John Wiley & Sons, 1997.
Lochner, Robert H., and Joseph E. Matar. Designing for quality: an introduction to the best of Taguchi and western methods of statistical experimental design. Springer, 1990. Ouyang, L.-Y., Hsu, C.-H., & Yang, C.-M. 2013. A new process capability analysis chart
approach on the chip resistor quality management. Proceedings of the Institution of Mechanical Engineers, Part B: Journal of Engineering Manufacture, 227(7), 1075-1082. Pearn, W.L., Kotz, S., Johnson, N.L. 1992. “Distributional and inferential properties of process
capability indices.” Journal of Quality Technology 24, 216–231.
Pearn, W. L., & Wu, C. 2006. “Production quality and yield assurance for processes with multiple independent characteristics.” European Journal of Operational Research, 173(2), 637-647. doi:10.1016/j.ejor.2005.02.050
Sadeghi, Mohsen, Frédéric Noel, and Khaled Hadj-Hamou. 2009 "Development of control mechanisms to support coherency of product model during cooperative design process." Journal of Intelligent Manufacturing 21, no. 4: 539-54.
doi:10.1007/s10845-009-0237-2.
Underhill, L. G., and D. Bradfield. "Introstat, Juta and Co." Ltd: Cape Town (1998). Weber, Charles A., John R. Current, and W. C. Benton. "Vendor selection criteria and
methods." European journal of operational research 50, no. 1 (1991): 2-18.
Appendix. Changes of Sample mean and Standard Deviation for Multiple Quality
[image:28.612.94.505.212.511.2]Components
Figure A. 2 Product 1 Width
Figure A. 4 Product 2 Length
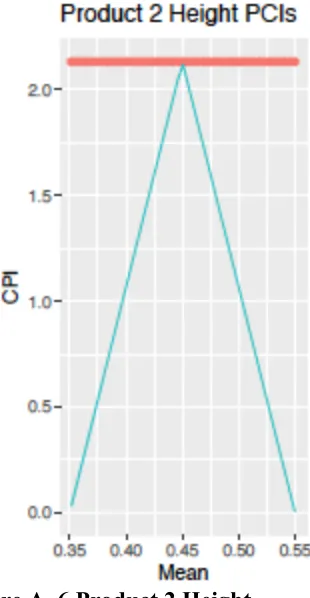
Figure A. 6 Product 2 Height
Figure A. 8 Product 2 Lower width
Figure A. 10 Product 3 Width
Figure A. 12 Product 3 Upper width
Figure A. 14 Product 4 Length
Figure A. 16 Product 4 Height
Figure A. 18 Product 4 Lower width
[image:37.612.107.259.85.371.2]Figure A. 20 Product 5 Width
Figure A. 22 Product 5 Upper Width
Figure A. 24 Product 6 Length
Figure A. 26 Product 6 Height