White Rose Research Online URL for this paper: http://eprints.whiterose.ac.uk/103119/
Version: Accepted Version
Article:
Bose, Thomas, Cuadrado, Ramon, Evans, Richard F L orcid.org/0000-0002-2378-8203 et al. (3 more authors) (2016) First-principles study of the Fe. Journal of physics : Condensed matter. 156003. pp. 1-9. ISSN 1361-648X
https://doi.org/10.1088/0953-8984/28/15/156003
eprints@whiterose.ac.uk https://eprints.whiterose.ac.uk/ Reuse
Items deposited in White Rose Research Online are protected by copyright, with all rights reserved unless indicated otherwise. They may be downloaded and/or printed for private study, or other acts as permitted by national copyright laws. The publisher or other rights holders may allow further reproduction and re-use of the full text version. This is indicated by the licence information on the White Rose Research Online record for the item.
Takedown
If you consider content in White Rose Research Online to be in breach of UK law, please notify us by
magnetic anisotropy
Thomas Bose1‡, Ramon Cuadrado1§, Richard F L Evans1,
Roman V Chepulskii2, Dmytro Apalkov2, and Roy W
Chantrell1
1Department of Physics, University of York, Heslington, York YO10 5DD, UK 2Samsung Electronics, Semiconductor R&D Center (Grandis), San Jose, CA 95134,
USA
E-mail: t.bose@sheffield.ac.uk
Abstract. We present a systematic first principles study of Fe|MgO bilayer systems emphasizing the influence of the iron layer thickness on the geometry, the electronic structure and the magnetic properties. Our calculations ensure the unconstrained structural relaxation at scalar relativistic level for various numbers of iron layers placed on the magnesium oxide substrate. Our results show that due to the formation of the interface the electronic structure of the interface iron atoms is significantly modified involving charge transfer within the iron subsystem. In addition, we find that the magnetic anisotropy energy increases from 1.9 mJ/m2 for 3 Fe layers up to 3.0 mJ/m2
for 11 Fe layers.
PACS numbers: 75.70.Cn, 75.30.Gw, 73.40.Rw, 71.15.Mb
Submitted to: J. Phys.: Condens. Matter
‡ Present address: Department of Computer Science, University of Sheffield, Regent Court, Sheffield S1 4DP, UK.
1. Introduction
Enhancing the prospect of high density magnetic data storage devices reaching market maturity requires comprehensive studies including the identification of both appropriate materials and optimized geometrical configurations. During the last decade much progress has been made in magnetic materials science to cull promising candidates from the pool of possible materials and their geometrical arrangement based on experimental [1–7] and computational [8–14] studies. Materials bearing the high potential to find application in future magnetic recording media and magnetoresistive random access memory (MRAM) devices need to exhibit a large magnetocrystalline anisotropy energy (MAE) [15].
In this regard, magnetic tunnel junctions (MTJs), for example, are under intense investigation. Material combinations such as CoFeB|MgO [7, 16–18], FeCo|MgO|FeCo [8, 19–21], CoPt|MgO|CoPt [22] or junctions containing Fe|MgO interfaces [23–27] are thought to play an important role in future data storage devices. Recently, conductance anomalies of CoFeB|MgO|CoFeB MTJs were reported [28] and the role of boron diffusion in CoFe|MgO tunnel junctions was discussed [29]. Related to the search for promising material combinations, epitaxial Co1.5Fe1.5Ge(001) electrodes were recently tested in MgO-based MTJs using spin- and symmetry-resolved photoemission [30].
code employing the SIESTA [40] framework. In particular, we show the effect of varying iron thickness on these quantities taking into account unconstrained structural relaxation of the overall Fe|MgO bilayer system. We find MAE values up to 3.0 mJ/m2 which is in agreement with the values reported in [31].
The paper is structured as follows: In section 2 the theoretical methods employed in the calculations are explained and the main density functional parameters are given. The relaxation analysis and electronic survey of each geometric configuration are described in sections 3.1 and 3.2. A layer resolved study of the magnetic moments is presented in Sec. 3.3. Subsequent, the effect of the lattice parameters and the number of Fe layers on the magnetic anisotropy is analised and interpreted in Sec. 3.4. Finally, the conclusion is given in Sec. 4.
2. Model and Computational Method
By means of DFT we investigated the geometric, electronic and magnetic properties of Fe|MgO(001) interfaces. Based on previous theoretical studies, we have located the interfacial Fe atoms directly above the oxygen atoms due to the significantly lower energy of this configuration [12, 13]. The corresponding Fe|MgO interfacial structure and the Fe as well as MgO unit cells are depicted in Fig. 1. Performing a systematic size-dependent study, we have modeled 5 different systems composed of nF e=3,5,7,9 and 11 Fe plus 5MgO planes. ThesenF eFe|5MgO-structures were repeated in the out–of–plane direction.
We have optimized each one of the geometric configurations under the conjugate gradient (CG) approximation without any constraint. The relaxations have been performed at the scalar relativistic level until the forces between atoms were less than 0.03 eV/˚A. In all cases the initial common in–plane lattice vector to perform the calculations was the bulk MgO optimized valueaM gOdue to its greater structural rigidity compared to Fe. During the relaxation process the in–plane and out–of–plane values were allowed to change. We discuss this aspect in the next section (see Fig. 2). As exchange correlation (XC) potential we employed the GGA using the Perdew, Burke, and Ernzerhof parametrization [41]. The basis set comprises double–ζ polarized strictly localized numerical atomic orbitals. For the optimization process we used up to 800 k points in the Brillouin zone. Real–space integrals were computed over a three– dimensional grid with a resolution of 700 Ry. The magnetic properties, however, are quite sensitive to these parameters. Hence we increased the number of k-points up to 9000 and the grid resolution in real space up to 1800 Ry. We have checked the convergence of results with respect to the number of k-points and grid resolution. The energy tolerance between two selfconsistent (SC) energy steps was set to ESC
tol ≤10−4eV.
1
(a) Fe|MgO slab
(100)
(010)
z,(001)
x
y
(b) coordinate system
√
2a
a a
cF e
(c) Fe unit cell
a a
cM gO
2
Mg
O
[image:5.612.107.495.92.330.2](d) MgO unit cell
Figure 1. (Color online) Geometry and structure of the Fe|MgO systems. In (a) the slab geometry is shown for 7 Fe on 5 MgO layers. The coordinate system in (b) corresponds to the Fe and MgO unit cells in (c) and (d).
3. Results and Discussion
3.1. Relaxation
in
-p
la
n
e
la
tt
ic
e
v
ec
to
r
a
[˚A
]
c/
a
-ra
tio
number of Fe layers on MgO lattice vector c/a - ratio
a(bulk)Fe a(bulk)MgO
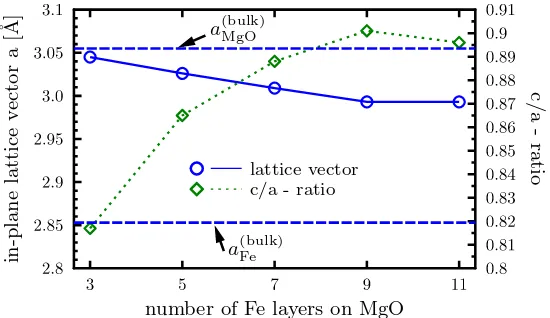
Figure 2. (Color online) In–plane (a, blue circles) and out–of–plane (c/a, green diamonds) lattice constants as a function of the number of iron layer slice. The c -values are averaged over all Fe planes. The lines are guides to the eye. Fe and MgO bulkaF e, M gO values are presented with blue dashed lines.
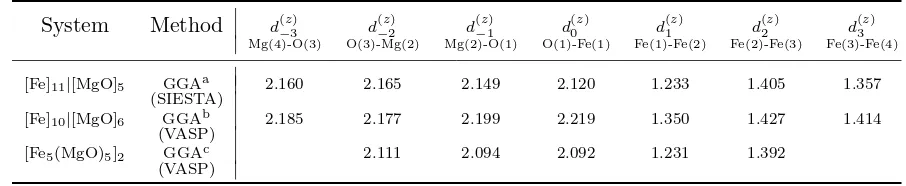
[image:5.612.157.432.478.637.2]Table 1. Distances between neighbouring layers for the 11Fe|5MgO-system compared to values from the literature. We have adopted the notation [Fe]11|[MgO]5 for our
system in this table to be better comparable to the systems studied in the references. The parameterd(kz) represents a distance perpendicular to the film plane, the number
k is only used to discriminate between the different distances. The number (i) in brackets behind the elements Mg, O and Fe denotes the plane number relative to the interface, i.e. i= 1 is the interface layer,i= 2 is the neighbouring layer and so on.
System Method d(z)
−3 d
(z)
−2 d
(z)
−1 d
(z)
0 d
(z)
1 d
(z)
2 d
(z)
3 Mg(4)-O(3) O(3)-Mg(2) Mg(2)-O(1) O(1)-Fe(1) Fe(1)-Fe(2) Fe(2)-Fe(3) Fe(3)-Fe(4)
[Fe]11|[MgO]5 GGAa 2.160 2.165 2.149 2.120 1.233 1.405 1.357
(SIESTA)
[Fe]10|[MgO]6 GGAb 2.185 2.177 2.199 2.219 1.350 1.427 1.414
(VASP)
[Fe5(MgO)5]2 GGAc 2.111 2.094 2.092 1.231 1.392
(VASP) a Our study in this paper.
b Taken from Ref. [23].
c Taken from Ref. [24].
of the system is body centred tetragonal (bct) Fe|MgO. We obtain the Fe-thickness dependent evolution of the in–plane lattice parameter a and its out–of–plane c/a counterpart as shown in Fig. 2. Starting from the optimized bulk MgO lattice constant aM gO as initial guess for the Fe|MgO lattice parameter we observe a small decrease of the in–plane lattice parameter (denoted a) when nF e=3, which is almost the same as its initial guess and is around 3.05 ˚A. Increasing the number of iron layers we observe a decrease of the in–plane value down to 3.0 ˚A for nF e=9. The largest system under study (nF e=11) exhibits no further significant change of the in–plane lattice parameter compared with nF e=9.
P
D
O
S
:
11
F
e
|
5M
gO
-s
y
st
em
energy
E
−
E
F[eV]
spin up
spin down
[image:7.612.162.430.99.410.2]E
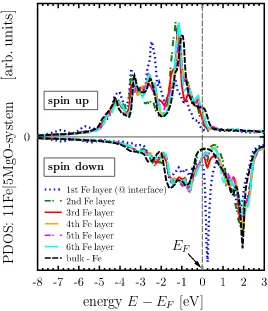
FFigure 3. (Color online) Fe spin-resolved density of states of the 11Fe|5MgO system projected on the first six Fe layers. bcc–Fe bulk density of states is also plotted in the figure (dashed black line).
To discuss the out–of–plane distances in more detail we refer to table 1. Here, we compare the Fe–O, Fe–Fe and Mg–O distances from the interface up to the fourth Fe|MgO plane with the existing literature. We observe a good overall agreement. The main differences between our values and the ones reported in the literature arise at the interface. However, if we consider planes further away from the interface the deviations become smaller. It is worth mentioning that even though the XC functional used to perform the calculations is the same (GGA) and the interface configuration is similar, the small discrepancies in the distances could be due to the different number of the Fe planes, the kind of basis used (SIESTA works with localized atomic orbitals and VASP uses plane waves) and other DFT parameters specific to each code.
3.2. Density of states
P D O S : in te rf ac e-F e-at om
energyE−EF [eV]
EF 3 Fe 5 Fe 7 Fe 9 Fe 11 Fe
(a) Fe interface layer
P D O S : 2n d -l ay er -F e-at om
energyE−EF [eV]
EF 3 Fe 5 Fe 7 Fe 9 Fe 11 Fe
[image:8.612.90.507.93.360.2](b) 2nd Fe layer
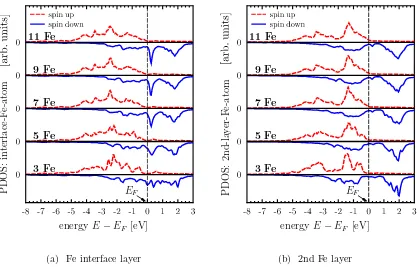
Figure 4. (Color online) (a) Density of states projected on the Fe atom located at the interface depending on number of iron layers. (b) Density of states projected on Fe atom in second iron layer depending on number of iron layers.
the bulk density of states. As we have shown in the geometric characterization in Sec. 3.1, the atoms at the interface are quite sensitive to the broken symmetry. From this observation one can expect non–conventional bulk effects in the electronic structure that cause changes in the magnetic moments and in the magnetic anisotropy of these bilayer systems. The up–/down–states are quite similar in all the Fe layers except the interface layer. The PDOS-curve representing the interface iron atom shows significant deviations in shape around the Fermi level compared to the other Fe layers. In particular, the peak just above the Fermi level for the down–states, not present in any other PDOS-plot, indicates the importance of the MgO substrate. Inspection of the Fe atoms located in Fe layers further away from the interface, a small peak at 0.25 eV can be observed. This peak, however, is much smaller than the one relating to the interface Fe atom and disappears in the bulk. Further to this, the Fe–d band is narrowed after putting Fe in contact with MgO.
P
D
O
S
:
in
te
rf
ac
e-F
e-at
om
energy
E
−
E
F[eV]
E
Fa
=
2
.
96
˚
A
a
=
2
.
98
˚
A
a
=
3
.
00
˚
A
a
=
3
.
02
˚
A
[image:9.612.161.430.99.414.2]a
=
3
.
04
˚
A
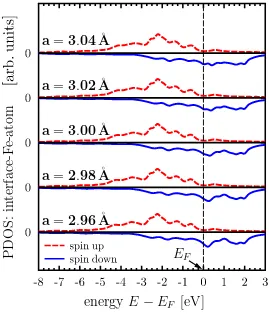
Figure 5. (Color online) Density of states of the 3Fe|5MgO system projected on Fe atom located at the interface for different in-plane lattice constants.
PDOS of the second Fe layer. As is clear from Fig. 4(b), fornFe= 3 the peak just above Ef is located at 0.5 eV and is significantly reduced in height from its value in layer 1. As the Fe thickness increases, the position of the peak moves to the same energy value of 0.25 eV as in layer 1, again with significantly reduced peak value. Considering the spin–up PDOS-curves in both Fig. 4(a) and Fig. 4(b), the alterations in shape for different number of iron layers is less significant as compared to the spin-down curves. From this observation we conclude that the presence of the Fe|MgO interface has larger effect on the spin-down than on the spin-up electrons and hence creates impact on the magnetic structure.
to
ta
l
ch
a
rg
e
Q
[e
/
a
to
m
]
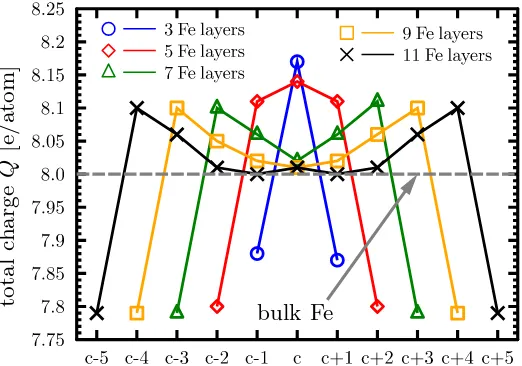
[image:10.612.160.421.95.278.2]Fe layers index related to c (c = central Fe layer) bulk Fe
Figure 6. (Color online) Net charge for different Fe thicknesses compared to the bulk Fe value of 8 e/atom. The values have been shifted to the centre of the Fe slice. The lines are guides for the eye.
We performed additional calculations which support this finding. This means that we computed PDOS-curves relating to the 3Fe|5MgO system under variation of the in-plane lattice parameter (see Fig. 5). We also observe the formation of the peak in Fig. 5 which can be more clearly identified if tetragonality is reduced, i.e. if we go to smaller in-plane lattice parameters. However, it is less pronounced compared to the larger system sizes illustrated in Fig. 4(a). The graphical depiction of the charge transfer in Fig. 6 indicates that there is another effect involved to generate the peak in the spin-down density of states discussed above. First, the Fe-interface atoms need to have the possibility to donate a minimum amount of charge. This becomes clear from the drop of the total charge of the Fe layer located at the interface when changing nFe = 3 to nFe = 5. A comparison with Fig. 4(a) (see spin-down curves for nFe = 3 and nFe = 5) reveals that the peak evolves when the drop of the total charge occurs. Second, only a small amount of charge donated by the Fe-interface atom is transferred to the oxygen. The larger amount of charge remains in the iron film. Hence, a minimum number of iron layers seems to be required such that electrons originally belonging to the Fe-interface atoms can be distributed over several iron layers. To summarize, the presence and accentuation of the peak in Fig. 4(a) is due to tetragonality change and the donation of electric charge of the interface iron atoms within the total iron subsystem.
3.3. Magnetic moments
m a g n et ic m o m en t [ µB / a to m ]
Fe layers index related to c (c = central Fe layer)
µ(bulk)Fe = 2.17µB/at.
(a) m a g n et ic m o m en t [ µB / a to m ]
number of Fe layers on MgO
Fe mag. moments at Fe/MgO-interface
[image:11.612.89.501.91.268.2] [image:11.612.90.284.96.238.2](b)
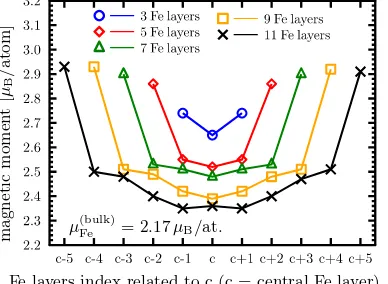
Figure 7. (Color online) (a) Layer resolved magnetic moment of iron atoms for all configurations. The values have been shifted to the centre of the Fe slice. The lines are guides for the eye. (b) Interface Fe magnetic moment for different Fe thicknesses
nF e. The solid line represents a guide for the eye. For comparison: the bulk-magnetic moment of iron isµ(bulk)Fe = 2.17µB/atom.
excess of up charge arises. We calculated the spin–resolved charges using the Mulliken population analysis [42]. Figure 7(a) depicts the layer resolved iron MM per atom for all geometries studied in this work. We find that the interface Fe atoms possess the highest MM values. If we move from the interface towards the centre of the Fe film the MM values decrease. However, the values of the central magnetic moments are still significantly larger than the Fe bulk MM, even though the values are reduced substantially compared with those at the interfaces. We also note that for the smallest configuration the dispersion in the MM values (MM-maximum minus MM-minimum) is only 0.14µB/at increasing for the other configurations up to∼0.6µB/at. In addition, we observe that the average MM value of the Fe atoms in the central iron plane decreases with increase of the number of iron layers. This is not surprising as a sufficient increase of iron planes should eventually resemble Fe bulk behaviour. Here, we observe this trend causing the magnetic moments to get closer to the bulk value, particularly in the centre of the slab. In figure 7(b) we have plotted the Fe interfacial MM values for all configurations with the aim to underline how the MM evolves as the number of Fe planes increases between the MgO material. There is a clear tendency to increase the MM for the bigger sizes. The difference between the MM values fornF e=3 andnF e=11 is about 0.2µB/at. This behavior is a consequence of the depopulation of up–states against the down ones, leading to an enhancement of the net MM of the interface Fe atoms.
3.4. Magnetocrystalline anisotropy energy
numerical values seems to be reasonable.
M
A
E
/
AF
e
m
J
/
m
2
M
A
E
/
V
F
e
M
J
/
m
3
number of Fe layers on MgO
MAE/AFe
[image:13.612.157.427.132.292.2]MAE/VFe
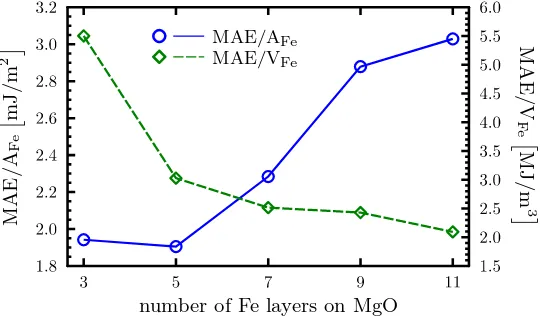
Figure 8. (Color online) Magnetic anisotropy energy values, MAE/AFe(blue circles)
and MAE/VFe(green diamonds), as function of number of Fe layersnF e. For a better comparability with other work we note that 1 mJ/m2 is equivalent to 1 erg/cm2, and
1 J/m3is equivalent to 10 erg/cm3.
4. Conclusions
In the present paper we have studied the geometry, electronic structure and magnetic properties of nF eFe|5MgO configurations (nF e=3,5,7,9,11) by means of first principles fully relativistic calculations. The use of metastable geometries is of paramount importance in magnetism, as it will influence important physical quantities such as magnetic moments or magnetic anisotropy. To this end we performed full relaxation of each configuration employing the CG method. Due to the different in–plane lattice constants of Fe and MgO we used the optimized MgO value as initial guess for both. The resulting out–of–plane values changed for each material, i.e. cF e6=cM gO. This has an important consequence for the anisotropy values that are influenced not only by the number of Fe layer but also by the geometry of the system as explained in Sec. 3.4. The magnetic moments are higher at the interface reducing their values moving inwards to the centre of the bilayer. In general, the magnetic moment in the centre is larger than the bulk value of 2.17µB per atom. Furthermore, the magnetic anisotropy energy increases its absolute value with the Fe thickness, however, the MAE per area seems to reach a plateau with value ≥3.0 mJ/m2. The reason for this effect is that only the on–site Fe values close to the interface contribute significantly to the total MAE. Hence, as the Fe subsystem increases in size, the centre of the material resembles the Fe bulk. For sufficiently large iron thicknesses the contribution to the MAE stemming from the centre is negligible and comparable to bulk Fe where it ranges in the order of µeV.
analysis of the electronic structure, magnetic moments and charge transport provides important new insight for employing Fe|MgO bilayer systems in future data storage de-vices. We hope our work further stimulates experimental and theoretical studies aiming at the understanding and development of next generation technologies.
Acknowledgments
The authors gratefully acknowledge the financial support from the Samsung Global MRAM Innovation (SGMI) programme.
References
[1] Faure-Vincent J, Tiusan C, Bellouard C, Popova E, Hehn M, Montaigne F and Schuhl A 2002Phys. Rev. Lett.89(10) 107206 URLhttp://link.aps.org/doi/10.1103/PhysRevLett.89.107206
[2] Andersson G, Burkert T, Warnicke P, Bj¨orck M, Sanyal B, Chacon C, Zlotea C, Nordstr¨om L, Nordblad P and Eriksson O 2006 Phys. Rev. Lett. 96(3) 037205 URL
http://link.aps.org/doi/10.1103/PhysRevLett.96.037205
[3] Endo M, Kanai S, Ikeda S, Matsukura F and Ohno H 2010 Appl. Phys. Lett. 96 212503 URL
http://scitation.aip.org/content/aip/journal/apl/96/21/10.1063/1.3429592
[4] Nistor L E, Rodmacq B, Auffret S and Dieny B 2009 Appl. Phys. Lett. 94 012512 URL
http://scitation.aip.org/content/aip/journal/apl/94/1/10.1063/1.3064162
[5] Katayama T, Yuasa S, Velev J, Zhuravlev M Y, Jaswal S S
and Tsymbal E Y 2006 Appl. Phys. Lett. 89 112503 URL
http://scitation.aip.org/content/aip/journal/apl/89/11/10.1063/1.2349321
[6] Chiang Y F, Wong J J I, Tan X, Li Y, Pi K, Wang W H, Tom H W K and Kawakami R K 2009
Phys. Rev. B 79(18) 184410 URLhttp://link.aps.org/doi/10.1103/PhysRevB.79.184410
[7] Ikeda S, Miura K, Yamamoto H, Mizunuma K, Gan H D, Endo M, Kanai S, Hayakawa J, Matsukura F and Ohno H 2010 Nat. Mater. 9 721–724 ISSN 1476-1122 URL
http://dx.doi.org/10.1038/nmat2804
[8] Zhang X G and Butler W H 2004 Phys. Rev. B 70(17) 172407 URL
http://link.aps.org/doi/10.1103/PhysRevB.70.172407
[9] Turek I, Kudrnovsk´y J and Carva K 2012 Phys. Rev. B 86(17) 174430 URL
http://link.aps.org/doi/10.1103/PhysRevB.86.174430
[10] Aas C J, Hasnip P J, Cuadrado R, Plotnikova E M, Szunyogh L, Udvardi L and Chantrell R W 2013
Phys. Rev. B 88(17) 174409 URLhttp://link.aps.org/doi/10.1103/PhysRevB.88.174409
[11] Delczeg-Czirjak E K, Edstr¨om A, Werwi´nski M, Rusz J, Skorodumova N V, Vitos L and Eriksson O 2014 Phys. Rev. B 89(14) 144403 URL
http://link.aps.org/doi/10.1103/PhysRevB.89.144403
[12] Cuadrado R, Klemmer T J and Chantrell R W 2014 Appl. Phys. Lett. 105 152406 URL
http://scitation.aip.org/content/aip/journal/apl/105/15/10.1063/1.4898574
[13] Cuadrado R and Chantrell R W 2014 Phys. Rev. B 89(9) 094407 URL
http://link.aps.org/doi/10.1103/PhysRevB.89.094407
[14] Nakamura K, Ikeura Y, Akiyama T and Ito T 2015 J. Appl. Phys. 117 17C731 URL
http://scitation.aip.org/content/aip/journal/jap/117/17/10.1063/1.4916191
[15] Chappert C, Fert A and Van Dau F N 2007 Nat. Mater. 6 813–823 ISSN 1476-1122 URL
http://dx.doi.org/10.1038/nmat2024
H D, Matsukura F and Ohno H 2011 J. Appl. Phys. 109 07C712 URL
http://scitation.aip.org/content/aip/journal/jap/109/7/10.1063/1.3554204
[17] Yakata S, Kubota H, Suzuki Y, Yakushiji K, Fukushima A,
Yuasa S and Ando K 2009 J. Appl. Phys. 105 07D131 URL
http://scitation.aip.org/content/aip/journal/jap/105/7/10.1063/1.3057974
[18] Wang W X, Yang Y, Naganuma H, Ando Y, Yu R C and Han X F 2011Appl. Phys. Lett.99012502 URLhttp://scitation.aip.org/content/aip/journal/apl/99/1/10.1063/1.3605564
[19] Bonell F, Hauet T, Andrieu S, Bertran F, Le F`evre P, Calmels L, Tejeda A, Montaigne F, Warot-Fonrose B, Belhadji B, Nicolaou A and Taleb-Ibrahimi A 2012Phys. Rev. Lett.108(17) 176602 URLhttp://link.aps.org/doi/10.1103/PhysRevLett.108.176602
[20] Andrieu S, Calmels L, Hauet T, Bonell F, Le F`evre P and Bertran F 2014Phys. Rev. B 90(21) 214406 URLhttp://link.aps.org/doi/10.1103/PhysRevB.90.214406
[21] Zhang J, Franz C, Czerner M and Heiliger C 2014 Phys. Rev. B 90(18) 184409 URL
http://link.aps.org/doi/10.1103/PhysRevB.90.184409
[22] Kim G, Sakuraba Y, Oogane M, Ando Y and Miyazaki T 2008Appl. Phys. Lett.92172502 URL
http://scitation.aip.org/content/aip/journal/apl/92/17/10.1063/1.2913163
[23] Feng X, Bengone O, Alouani M, Leb`egue S, Rungger I and Sanvito S 2009Phys. Rev. B 79(17) 174414 URLhttp://link.aps.org/doi/10.1103/PhysRevB.79.174414
[24] Yang H X, Chshiev M, Kalitsov A, Schuhl A and Butler W H 2010Appl. Phys. Lett. 96262509 URLhttp://scitation.aip.org/content/aip/journal/apl/96/26/10.1063/1.3459148
[25] Nakamura K, Akiyama T, Ito T, Weinert M and Freeman A J 2010Phys. Rev. B 81(22) 220409 URLhttp://link.aps.org/doi/10.1103/PhysRevB.81.220409
[26] Lambert C H, Rajanikanth A, Hauet T, Mangin S, Fullerton E E and Andrieu S 2013 Appl. Phys. Lett. 102 122410 URL
http://scitation.aip.org/content/aip/journal/apl/102/12/10.1063/1.4798291
[27] Hallal A, Yang H X, Dieny B and Chshiev M 2013 Phys. Rev. B 88(18) 184423 URL
http://link.aps.org/doi/10.1103/PhysRevB.88.184423
[28] Ringer S, Vieth M, B¨ar L, R¨uhrig M and Bayreuther G 2014 Phys. Rev. B 90(17) 174401 URL
http://link.aps.org/doi/10.1103/PhysRevB.90.174401
[29] Mukherjee S, Knut R, Mohseni S M, Anh Nguyen T N, Chung S, Tuan Le Q, ˚
Akerman J, Persson J, Sahoo A, Hazarika A, Pal B, Thiess S, Gorgoi M, Anil Kumar P S, Drube W, Karis O and Sarma D D 2015 Phys. Rev. B 91(8) 085311 URL
http://link.aps.org/doi/10.1103/PhysRevB.91.085311
[30] Neggache A, Hauet T, Bertran F, Le F`evre P, Petit-Watelot S, Devolder T, Ohresser P, Boulet P, Mewes C, Maat S, Childress J R and Andrieu S 2014 Appl. Phys. Lett.104 252412 URL
http://scitation.aip.org/content/aip/journal/apl/104/25/10.1063/1.4885354
[31] Yang H X, Chshiev M, Dieny B, Lee J H, Manchon A and Shin K H 2011 Phys. Rev. B 84(5) 054401 URLhttp://link.aps.org/doi/10.1103/PhysRevB.84.054401
[32] Baumann S, Donati F, Stepanow S, Rusponi S, Paul W, Gangopadhyay S, Rau I G, Pacchioni G E, Gragnaniello L, Pivetta M, Dreiser J, Piamonteze C, Lutz C P, Macfarlane R M, Jones B A, Gambardella P, Heinrich A J and Brune H 2015Phys. Rev. Lett. 115(23) 237202 URL
http://link.aps.org/doi/10.1103/PhysRevLett.115.237202
[33] Niranjan M K, Duan C G, Jaswal S S and Tsymbal E Y 2010 Appl. Phys. Lett.96222504 URL
http://scitation.aip.org/content/aip/journal/apl/96/22/10.1063/1.3443658
[34] Maruyama T, Shiota Y, Nozaki T, Ohta K, Toda N, Mizuguchi M, Tulapurkar A A, Shinjo T, Shiraishi M, Mizukami S, Ando Y and Suzuki Y 2009Nat. Nanotechnol. 4158–161 ISSN 1748-3387 URLhttp://dx.doi.org/10.1038/nnano.2008.406
[35] Wang W G, Li M, Hageman S and Chien C L 2012 Nat. Mater.11 64–68 ISSN 1476-1122 URL
http://dx.doi.org/10.1038/nmat3171
[36] He K H, Chen J S and Feng Y P 2011 Appl. Phys. Lett. 99 072503 URL
[37] Duluard A, Bellouard C, Lu Y, Hehn M, Lacour D, Montaigne F, Lengaigne G, Andrieu S, Bonell F and Tiusan C 2015 Phys. Rev. B 91(17) 174403 URL
http://link.aps.org/doi/10.1103/PhysRevB.91.174403
[38] Cuadrado R and Cerd´a J I 2012 J. Phys. Cond. Mat. 24 086005 URL
http://stacks.iop.org/0953-8984/24/i=8/a=086005
[39] Cerd´a J, Van Hove M A, Sautet P and Salmeron M 1997Phys. Rev. B 56(24) 15885–15899 URL
http://link.aps.org/doi/10.1103/PhysRevB.56.15885
[40] Soler J M, Artacho E, Gale J D, Garc´ıa A, Junquera J, Ordej´on P and S´anchez-Portal D 2002J. Phys. Cond. Mat.142745 URLhttp://stacks.iop.org/0953-8984/14/i=11/a=302
[41] Perdew J P, Burke K and Ernzerhof M 1996 Phys. Rev. Lett. 77(18) 3865–3868 URL
http://link.aps.org/doi/10.1103/PhysRevLett.77.3865
[42] Mulliken R S 1955 J. Chem. Phys. 23 1833–1840 URL
http://scitation.aip.org/content/aip/journal/jcp/23/10/10.1063/1.1740588
[43] Chepulskyy R, Apalkov D, Khvalkovskiy A, Butler W, Ahn H and Krounbi M January 14-18, 2013 Separate contributions into perpendicular magnetic anisotropy of Fe—MgO interface from first principles 12th Joint MMM/Intermag Conference (Chicago, Illinois, USA)