COMMISSION OF THE EUROPEAN COMMUNITIES
Directorate-General for Fisheries
Regional, Socio-Economic Study
in the Fisheries Sector
ITALIA
Liguria, Toscana, Lazio, Campania, Calabria
XIV/418/92
COMMISSION OF THE EUROPEAN COMMUNITIES
Directorate-General for Fisheries
Regional, Socio-Economic Study
in the Fisheries Sector
ITALIA
Liguria, Toscana, Lazio, Campania, Calabria
MAIN CONTRACTOR
PRINCIPAL CONTRIBUTORS
lstituto ricerche economiche per lapesca e l'acquacoltura (JREPA) Via B. Croce, 35
I-84121 Salerno
Guido CELLA Lucio LABANCHI Vincenzo PLACENTI Giovanni SALERNO Massimo SPAGNOLO
ABSTRACT
Lo studio concerne sei regioni amministrative italiane che presentano piu di 2 OOO km di caste, lunge le quali sono dislocati 289 punti di sbarco. La flottiglia peschereccia in attivita si compone di 5 755 imbarcazioni, per un totale di 57 314 TSL; la forza lavoro comprende 13 233 marittimi
(dicembre '89).
Il tipo di pesca predominante
e
quello praticato con pescherecci da traino. I battelli impiegati in tale comparto rappresentano rispettivamente il 50% della stazza lorda, i l 36% delle catture ed il 51% delle vendite sull'intera zona in parola. Il potenziale produttivo locale dell'acquicoltura non viene pienamente sfruttato per problemi amministrativi e tecnici. L'acquicoltura della zona costituisce attualmente il 10% (in termini di volume e valore) della produzione nazionale e occupa circa 500 persone. Quanta all'industria di trasformazione, non vi saranno miglioramenti della produzione e dell' occupazione f intanto che non verra data un nuovo orientamento alla politica strutturale e di mercato (PCP). Questo comparto da lavoro a circa 8 100 persona, ma peril future si teme una progressiva riduzione di manodopera.Vi sono 57 porti nazionali attrezzati per i pescherecci. Date le condizioni delle strutture portuali nell'area in esame, l'investimento necessario per attrezzare i porti di queste regioni ammonta a circa 26 Mio di ECU. Nella zona operano inoltre 25 mercati; le lore dimensioni strutturali costituiscono tuttavia un ostacolo all'incremento delle vendite e del livello di occupazione.
In termini di rapporti intersettoriali, i collegamenti diretti fra la pesca e le attivita connesse si distinguono per la lore capillarita. L'occupazione totale indotta nell'insieme delle attivita economiche connesse (250) ammonta a 11 OOO unita (inclusi i commercianti al minute) a fronte di 17 OOO pescatori.
Non
e
possibile affermare che esistono in questa area "zone geografiche altamente dipendenti dalla pesca" che· oltrepassino i confini delle unita amministrative locali (comuni) in cui sono svelte le attivita di pesca. Si pua tuttavia ragionevolmente supporre che tali zone siano distribuite un po' ovunque sull'arco dell'intera area e a cavallo delle singole regioni amministrative.ABSTRACT
The area of study is composed by six Italian administrative
regions which have more than 2,000 km of coastline, along which
there are 289 landing places. The fishing fleet operating is
composed of 5,755 boats with 57,314 GRT. The labour force was
made up of 13,233 professional seamen (12/89).
The catching sector is dominated by trawler fishing. Trawler boats account for 50%, 36% and 51% of GRT, catch and sales of the total area respectively. The area's productive potential of the aquaculture sector is not exploited to the full due to administrative and technology difficulties. Aquaculture current
production in the area accounts for 10% (in terms of volume and
value) of the national totals and employment in aquaculture is around 500 units. In the processing industry one observes that as long as structural and market policy (CFP) does not change direction, the sector cannot evolve in a positive manner both with regard to production and to employment. Around 8,100 people
are employed in this subsector and one may expect a steady
reduction in manpower in the industry in future.
There are 57 national ports equipped for fishing boats.
Given the conditions of ports structures in the area under study, the investment necessary to equip fishing ports comes to around
26 million ECU. There are also 25 fish markets operating in the
area. Current dimensions of the structure of the fish markets represent an obstacle to increasing the quantities sold and the level of employment.
In terms of sectorial interrelations the direct links between fishing and related activities are distinguished by their "pervasiveness". The total induced employment in all (250) related economic activities ace-aunt for 11,000 units (retailers
included) related to 17,000 fishermen at sea.
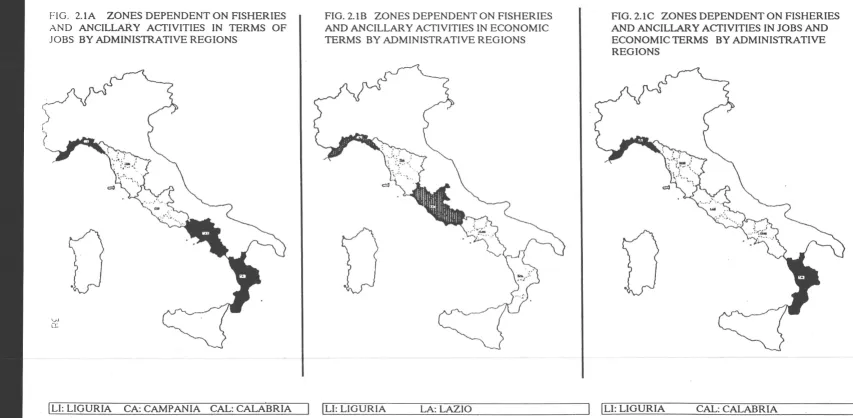
In the area, one cannot assert that there exist "geografical
zones higly dependent on fisheries" which go beyond the
confines of the local administrative unit (comune) in which fishing is carried out. It is not unreasonable to suggest that, there are "zones higly dependent on fisheries" distributed in "patches" across the entire area and across the individual administrative regions.
The analysis would suggest an investment policy directed
towards a small change in the structure of intermediate and final
consumption in other sectors I such as to aosorb the expected
ABSTRACT
L'etude porte sur une zone comprenant six regions administratives
italiennes qui comptent plus de 2.000 km de cotes, le long desquelles se trouvent 289 lieux de debarquement. La flotte de peche y comprend s. 755 bateaux total is ant 57. 314 TJB. La main-d'oeuvre y comptait 13. 233 mar ins professionnels en decembre 1989.
La peche est assuree essentiellement par des chalutiers qui representent
SO% des TJB, 36 % des captures et 51 % des ventes de la zone. Le potentiel de production de l'aquaculture n'y est pas exploite integralement en raison de difficultes administratives et technologiques. La production aquacole actuelle y represente 10 % (en volume et en valeur) des totaux nationaux et quelque 500 personnes travaillent dans l'aquaculture. Dana le secteur de la transformation, on observe qu' a defaut de changement des politiques structurelles et de marche (PCP), ni la production, ni l'emploi ne pourront se developper. Environ 8 .100 personnes travaillent dans ce sous-secteur et on peut s' attendre
a
une reduction continue de la main-d 'oeuvre.Il existe tenu de
57 ports nationaux equipes pour lea bateaux de peche. Compte
l'etat des infrastructures portuaires de la zone etudiee,
l'investissement necessaire pour equiper lea ports de peche s'eleve a pres de 26 millions d'ecus. Il existe egalement 25 criees dans la zone. Leurs dimensions actuelles constituent un obstacle a l'augmentation des ventes et de l'emploi.
En termes de correlations sectorielles, les liens directs entre la peche et lea activites connexes sent tres importants. Au total, on compte 11.000 emplois induits dans l 'ensemble des activites economiques connexes ( 250) pour 17.000 dans la peche maritime.
on ne peut pas affirmer qu' i l y a "des zones geographiques fortement dependantes de la peche" qui depassent les limites de l 'unite locale
administrative (commune) ou la peche est pratiquee. Il n'est pas
deraisonnable de penser qu'il existe "des zones fortement dependantes de la peche" <;a et la dans la zone et lea differentes regions administratives.
CONTENTS OF THE SOCIO-ECONOMIC STUDY OF THE AREA I.1
ABSTRACT
GENERAL DESCRIPTION OF THE AREA OF STUDY I.1 . . . Pag. 1
CHAPTER 1: DESCRIPTIVE ANALYSIS OF THE SECTOR
IN AREA I . 1 . . . . . . . . . " 3
1. 1 THE FISHING FLEET. . . . " 3 1 . 2 AQUACULTURE. . . . " 12 1.3 THE FISH PROCESSING INDUSTRY . . . " 16 1.4 SUPPORTING SECTORS, DISTRIBUTION AND RELATED
SECTORS. . . . " 21
CHAPTER 2: THE IDENTIFICATION AND CHARACTERISTICS OF ZONES HIGHLY DEPENDENT ON FISHERIES AND
ANCILLARY SECTORS IN AREA I. 1. . . . 11 31
2 . 1 INTRODUCTION. . . . . . . 11 31
2.2 RELATIVE DEPENDENCE AT THE LEVEL OF
ADMINISTRATIVE REGIONS . . . ·. . . . . . 11
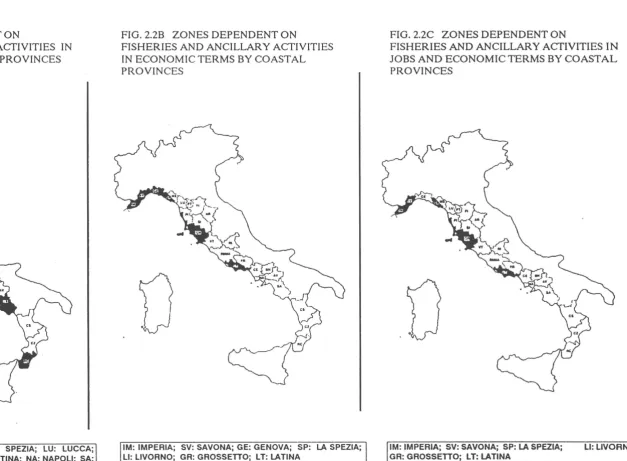
33 2.3 RELATIVE DEPENDENCE AT THE LEVEL OF
ADMINISTRATIVE PROVINCES . . . 11 34
2.4 CONCLUDING COMMENTS AND PROPOSALS .... ~· ... 11 35
CHAPTER 3 ANALYSIS OF THE SOCIOECONOMIC IMPACT OF CFP .. 11
40
3.1 COMMUNITY POLICY ON FISHING . . . 11
40 3.2 NATIONAL POLICY AND THE DEVELOPMENT OF
THE SECTOR. . . . . . . 11
41 3 . 3 THE RESULTS ACHIEVED. . . . . . . 11
4 2
CHAPTER 4 RECONVERSION ACTION UNDERTAKEN BY THE EEC .... 11 43
4.1 THE APPLICATION OF COMMUNITY RECONVERSION
PROGRAMMES IN ITALY . . . " 43 4.2 POSSIBLE ANALOGIES WITH, AND APPLICATIONS TO,
THE FISHERIES SECTOR. . . . 11
4 4
CHAPTER 5 CONCLUSIONS: EMPLOYMENT OPPORTUNITIES IN FISHING AREAS AND THE IDENTIFICATION OF
SUPPORTING MEASURES. . . . 11
GENERAL DESCRIPTION OF THE AREA OF STUDY "I.1"
The five Italian administrative regions (Liguria, Tuscany, Latium, Campania, and Calabria) which are considered in this study have more than 2,000 km of coastline, along which there are 289 landing places. The Italian fishing sector is characterised by the large number of landing sites and their nearness to each other {roughly 8 km). The fishery has much diversity both in terms of the peculiarities of the local fleets and the equipment employed. In this context, the analysis cannot but draw attention to the geographical distribution of the fleet and the different types of fishing gear employed {see table 1.A and fig. 1.A).
To this end, the study has been conducted using all the available sources of information at differing levels of geographical and technical disaggregation. The most recent ISTAT (Central Statistical Institute) statistics provide a picture of the geographical location of the fleet. As regards information connected to the different fishing techniques and the related economic analysis, data was employed from IREPA studies and, in particular, from the systematic compilation of fishing indicators commissioned by the Italian Ministry for the Merchant Navy. No data were available on part-time employment.
TAB. 1.A FISHING ACTIVITY IN AREA 1.1 • 1989
MARITIME BOTTOM PEUGIC PURSE· SEINER LONG· Ul'iER GILL-NET DREDGER OTIIER MULTIPLE TOTAL
DISTRICT AND TRAWLER TRAWLER METHODS PURPOSE
COAST VESSEL
N. GRT N. GRT N. GRT N. GRT N. GRT N. GRT N. GRT N. GRT N. GRT
IMPERIA 27 797 . 5 170 I 2 69 200 6 37 100 563 208 1770
SAVONA 13 302 14 310 4 15 119 276 1 2 8 22 192 924 351 1851
GENOVA 48 1083 21 267 24 64 97 2.39 38 130 160 665 358 2449
LASPEZ.IA 28 443 13 149 3 17 43 108 57 134 53 438 197 1288
LIGURIAN 116 2'25 SJ 11% 3:? 98 J:?8 823 I 1 109 323 SOS :?590 1144 7358
VIAREGGIO 76 2780 3 99 7 527 I 5 67 171 4 8 83 1884 241 5473
LIVORNO 134 4783 6 ) ~ 2 4 329 1138 I 21 38 125 118 599 628 6857
PORTOFERR. 6 146 15 817 4 "8 34 118 I I 2 9 83 601 145 1741
M.CARRARA 2 25 13 17 18 33 21 54 54 130
UPPER THYRR. 118 7734 3 99 :?JI 1531 7 S7 443 1445 1 l:? 61 175 305 3138 1068 14:?0I
CIVITAVECC 21 999 • I 2 21 68 433 24 90 115 1544
ROMA 82 5851 0 712 224 869 14 86 2 16 133 788 465 8322
GAETA 66 1927 s 206 I 9 284 1210 4 63 14 206 120 1145 494 4765
MEDIUMTHYR 169 8777 17 940 1 9 576 :?512 18 148 16 111 177 1023 1074 1'631
NAPOLI 25 677 49 813 30 96 218 ~ 26 145 74 438 156 629 578 3638
TORRED.G. 47 Z252 I 5 54 140 2 4 1 2 70 271 175 2675
CASTELL D.S. 15 66. JS 733 2 4 64 2.50 4 32 8 59 87 587 198 1730
SALERNO 58 996 30 3470 g 34 384 1223 1 10 14 158 168 1721 663 7612
VIBO V ALI--.N. 12 471 5 70 2 10 51 164 4 19 134 802 214 1536
REGGIO CAL 7 173 7 33 17 28 100 253 SS 170 205 940 391 1596
LOWERTHYR. 164 '634 109 5118 60 177 877 :?871 33 191 15' 844 8:?0 4951 1:?19 18786
TOTAL ITALY 3834 143745 86 5!81 434 11854 474 3351 5198 17778 527 5:?17 769 4430 7lll 70501 18433 !63164
Source: 1.5.T AT.
jFIG.1.1 AREA 1.1 BY ADMINISTRATIVE REGION AND PROVINCE
I
I
TOSCANACHAPTER 1 DESCRIPTIVE ANALYSIS OF THE SECTOR IN AREA I.1
1.1 THE FISHING FLEET
1.1.1 The current state of the fishing fleet
The fishing fleet in area I.1 operating on December 31, 1989, was composed of 5,505 boats with the total gross tonnage of 54,976. The labour force was made up of 13,233 professional seamen corresponding to 24% of the respective national totals. Gross sales were 273,525 thousands ECU which, net of intermediate goods, gave a value added equal to 19 5, 552 thousands ECU ( see table 1.1.1 and 1.1.2).
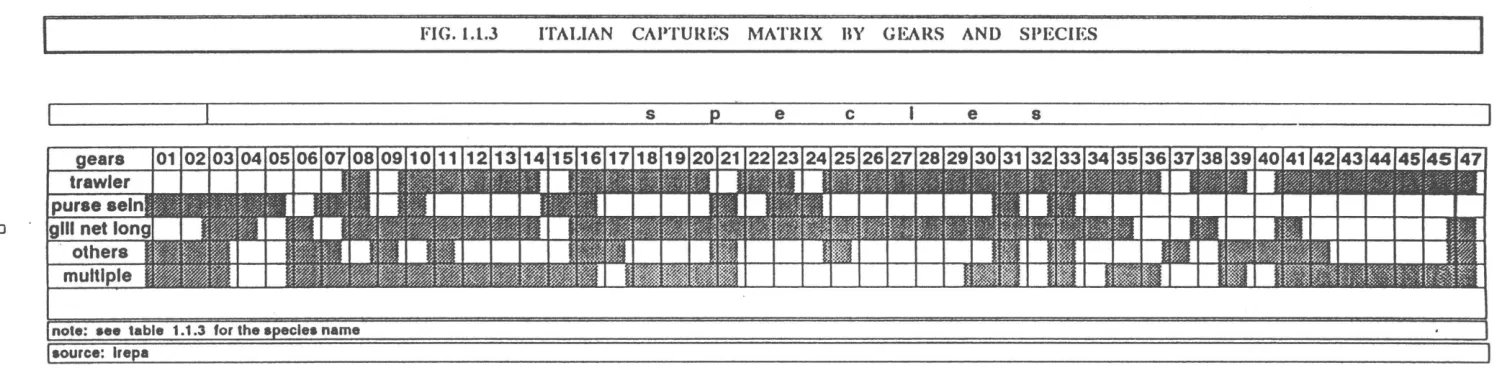
When compared to the national situation the Tyrrhenian fleet presents a number of points of difference. Indeed, on one hand the structure of the Tyrrhenian fleet and its manpower make up 22% and 24% of the relevant national totals whilst, on the other, the volume caught and their sale make up 15% and 19% of the national totals respectively. Figures of volumes of landings by species in the administrative regions and total area, are reported in table 1.1.3. Landings by gears per regional coastals are reported in table 1.1.3A and the prevailing captures by species and gears in the area are drafted in fig. 1.1.3.
1.1.2 Types of fishing gear
Ligurian and Tyrrhenian sea fishing have typically Mediterranean characteristics with a predominantly artisanal organisational structure. The form of organisational structure chosen is the result both of the desire to protect against the substantial variations in the biomass of certain types of fish and of the desire for greater flexibility and diversification in fishing in order to ensure stability in the volumes of the catch, and therefore, of incomes. In this context, the artisanal boats exploit, on one hand, the capability to adapt equipment to the seasonality of the species fished and, on the other, the ability to operate at sales levels of under 130,000 ECU. According the results of the IREPA' s sample survey ( 1986/87 and 1989), tables 1.1. 4 and 1.1. 5 provide some statistics on the fishing gears employed and their cost. In this context statistics are not consistant with official data for the same years.
Trawlers are the most common type of· vessels used for fishing along the Ligurian and Tyrrhenian coasts. These boats account for -50% of the gross tonnage of the area. The importance of trawling
Is
further reinforced when one considers that many of the boats included in the multiple purpose category frequently trawl. The IREPA observatory reports that during 1987 on average trawling accounts for -36% of the total catch. The fish caught in this way are of variable quality and mostly fall into the category of "other fish". Crustacea and molluscs make up, in roughly equal measure, the rest of the catch. Proceeds of this group make up 51% of the area's total.The average trawling operator is characterised by gross sales of 123, OOO ECU and operating costs equal to .:.50% of the
total. Labour costs, principally the salaries of the boats'
crews, come to ~38% of sales leaving a profit margin of 12%.
The average boat owner is also part of the crew and earns
roughly 23, OOO ECU per annum made up of the profits and his
salary as a crew member.
Boats employing purse-seiner gears make up 13% of gross
tonnage. This fleet was largely concentrated in Campania where it
makes up 68% of the gross tonnage due to the tuna fishery of
Salerno.
Purse-seiner fishing is characterised by its markedly seasonal nature and by a high level of technical efficiency (over
4,900 kg/GRT) . Indeed, notwithstanding the low tonnage of the group, purse-seiner fishing accounts, on average, and with a high
degree of year to year variation, for ~43% of the area's total
catch. Two-thirds of the fish caught are small pelagic species, mainly sardines and anchovies and, given the low price of these species, the contribution of the group to sales is brought down to -16%.
- In spite of this the average annual income of a boat owner
who is also a crew member is around 31,000 ECU, the highest
income of all fishing gears in the area. This is due to the low
operating costs which make up 31% of sales. The remaining value
added, necessary to pay crews and to reward capital are high.
Crew salaries make up 41% of the total whilst 28% goes in the way
of profits (see tables 1.1.4 and 1.1.5).
The gill-netters and long-liners group, are the most
traditional method employed by Italian fishermen. It makes up 16%
of the area's tonnage, and, given the corresponding national
figure of 7%, there is evidently a preponderance of this method
along the Tyrrhenian coast.
Gill-netters account for 12% of the catch and 24% of sales.
The target of gill-net fishermen is largely composed of the high
value species, the sale of which to final consumers is often carried out by the fishermen themselves. The average income of
fishermen in this category is around 10, OOO ECU per annum
although there are marked regional differences in this figure. Fishing is usually undertaken by the boat owner alon~. Sometimes an additional person is taken on board, al though the
remuneration of such "crew" makes up just 18% of sales. Rather
more important are the operating costs. of which social
contribut~on_s_ make up. a_ substantia.~ _,pa+t~··cO,v,er.all, , these .costs account .. for .$3% . of total sales, the . hi°ghes't .p.er'cenfage. of all fishing gears considered.
Finally, even with the peculiar cost structure, the level of profits at 29% of sales is in line with other fishing gears. However, in absolute terms, incomes are at the limit of what is economically and socially viable {see tables 1.1.4 and 1.1~5).
Boats employing multiple purpose gears m·ake up the second
largest group in terms of tonnage, accounting for 20% of the
total. At the local level, these are characterised by a high degree of technical, economic and social heterogeneity.
The impact of this type of fishing gear is estimated as 7%
of the catch and 8% of gross sales which, on average, is equal to
34,500 ECU per boat. Sales are divided up as follows: 48% go on operating costs, 37% on labour and boat owners receive, on average, around 11,380 ECU (see tables 1.1.4 and 1.1.5).
The modernisation of the fleet, through the restructuring of hulls and engines and the reduction in the intensity of fishing are the principal objectives adopted in Italy for the period 1992-1994.
The modernisation of the fleet was necessary since the average age of boats in the Italian fleet is around 20 years, most of which were constructed before the mid-1970's. Similarly, in the area under study, 59% of the boats - corresponding to 60%
of GRT - are over 15 years old and 46% of boats - 47% of GRT
-were constructed over 20 years ago. Just 25% of the fleet - 24%
of GRT - has been constructed in the last ten years and over a third in the last fifteen (table 1.1.6).
Accordingly, maintainance work has become the means to counteract the obsolescence of the fleet. The IREPA (1985) observatory reports that during early '80 around one half of boats have been renovated in at least one of their principal components. If, on the one hand, renovation has, for the most part, taken the form of the substitution of engines, on the other, lately there has been a change in direction. Indeed, in recent years, even if almost half the fleet has changed its engine, more emphasis is beginning to be put on the modernisation of preservation and electronic equipment. This phenomenon may be understood in relation to the necessity to improve the quality of fish brought ashore in order to receive better prices for the catch and the need to improve fishing efficiency in the light of the reduction in the stock of fish available.
As regards the reduction in fishing intensity through a
reduction in the overall tonnage and the KW .of engines, it is
worth nothing that the objectives specified in the 1987-1991 orientation programme were, for the part, achieved.
In this context, the current directives envisage modest reductions in tonnage and engine power with a particular concentration on the reduction of the fishing intensity of trawlers. Indeed, these boats represent the largest component of the fleet {in terms of fishing hours, tonnage and horsepower) and are the fishi·ng · subsector · mos·t -in need of rationalisati·on.
In this sense, the current regulations, whilst leading to a reduction in the tonnage of trawlers, have not exhausted their role. In particular, current policies points to the necessity of reallocating boats employing inefficient fishing gears to more efficient ones.
Technological innovation adopted in the area has been concerned with the mechanisation of net hauling and the preservation of the catch. Little or nothing has been done to maintain the sector's dwindling workforce (particularly the young) caused by the poor working conditions facing, above-all, the non-boat owning crew members.
A first step towards overcoming this problem would be an acceleration of the process of renewal of the fleet in order to both improve working conditions and increase the earnings of individual boats. Organisationally, this implies a reallocation of the fleet between the various fishing gears. From this point of view, the reduction of the trawling fleet in area I.1 is one of the main priorities. In this way, a reallocation of the fleet will benefit both the stock of fish and the earnings of fishermen.
TAB. 1.1.1 STATISTICS ON FISHING ACTIVITY IN
AREA 1.1 (1989)
REGIONS N. GRT FISHERMEN CATCH (tons)
Lh?uria 1,144 7,358 2,293 11,899
Toscana 1,068 14,201 2,999 7,312
Lazio 1,074 14,631 2,114 21,220
Camoania 1,614 15,654 4,070 10,195
Calabria (*) 605 3,132 1,757 3,892
AREA I.l 5,505 54,976 13,233 54,518
ITALY I 18,433
l
263,164l
54,4soI
360,962 (*) Excluded Crotone coastal deoartmentSource: l.S.T.A.T.
AREA 1.1 : FINANCIAL DATA TAB. 1.1.2 ON THE FLEET BY REGION
('OOO ECU - 1989)
REGIONS PROCEEDS COSTS GVA
Lh?uria 62,074 15,481 46,875
Toscana 37,713 12,023 25,861
Lazio 105,757 27,906 78,331
Camoania 41,ns 15,883 26,081
Calabria(*) 26,206 7,921 18,404
TOTALI.l 273,525 79,214 195,552
TOTAL ITALY 1,458,848 402,067 1,063,401
TAB. 1.1.3
LANDINGS VOLUMES BY SPECIES AND ADMINISTRATIVE REGIONS IN AREA 1,1 (tons) • 1989
SPECIES LIGURtA TOSCANA LAZIO CAMPANIA CALABRIA AREA J.1 TOTAL ITALY
Anchovy 1274,2 1228,2 682,9 1177,2 375 4737,5 1886i,6
2 Sardine 839,4 508,7 877,5 743,4 662..l 3631,3 45681,3
3 Mackerel 229,7 226,9 181, 1 262,5 115 1015,2 3991,7
4 Tuna 24,2 0,3 168,9 95,6 69,2 358,2 2381,4
5 Horn fish 29,6 3,8 43 105,3 31,5 213.2 421,7
6 Eel 4,9 150,1 21,4 33,5 3,4 213,l 866,8
7 Frigate •aclterel 90,4 34,5 14,5 41,3 83,7 264,4 489,7
8 Bogue 719,6 468,4 252 236,7 344,8 2021,5 4956
9 Gurnard 147,7 168,9 238,7 163,7 109,2 828,2 5818,9
10 Mullet 242, 1 391,3 236,2 383 169, 1 1421,7 4719,4
11 Grouper 24,3 18 200,9 61,6 19,4 324,2 3347,9
12 Dogs tHth 66,2 48,7 542,6 195,S 23,2 876,2 4458,8
13 Gobby 21,5 28,9 80,2 85,4 18,7 234,7 2315,3
14 Sand saa l t 18,5 38, 1 21,4 14,1 11,4 103,5 2301, 1
15 Garrick 36 88,9 143,9 143,7 59,3 471,8 1562,4
16 Cockrel 211,2 65,4 179,2 98,8 95,8 650,4 1493,6
17 Hake 367,8 262 961,6 371,2 305,5 2268, 1 25376,4
18 Croaltar 56, 1 48 251,6 29 19,2 403,9 1510
19 Gllthead seabrea• 75,2 163,1 287,5 93,7 17, 1 636,6 2285,1
20 Red seabru• 825,6 41,8 122,1 102.s 58,7 1150,7 2948
21 Bonito 109 99,3 118,9 130, 1 127,2 584,5 1315,9
22 Saooth hou,id 80, 1 66,6 327,9 44, 1 12,1 530,8 4733
23 Blue whiting 183,9 47 274,8 49,9 79, 1 634,7 2606,6
24 Sword-fish 65,9 18 156,9 96,9 177,4 515, 1 2210,9
25 Angler 108,2 42,2 172,6 51, 7 56,3 431 2756, 1
26 Ray 39,3 58,3 134,9 49,9 32,8 315,2 2809, 1
27 Turbot 54,9 59,2 205,7 96,9 89,S 506,2 2928,9
28 White bru11 141,6 67,8 312,4 159,3 22, 1 703,2 2236,9
29 Sole 68, 1 105,6 466,9 134,6 23,1 799 5953,2
JO Sea bass 33,l 107 592,3 141,4 57,7 931,7 3010,2
31 Horse ,uckar-a l 448,6 247,2 463,9 359,3 213,6 1732,6 8719,2
32 Red mul Lat 314,2 248,8 749, 1 807,3 270,7 2390,1 9283,8
33 Other spec i u 1215,5 997,9 3874, 1 1701,2 1094,7 8883,4 41805,9
34 Squid 162 82.9 1080,1 168 170,5 1663,5 8649, 1
35 Octopus 261,7 292,8 771,3 481,1 213,3 2020.2 11595,9
36 Cuttlefish 224 157,8 1642,3 288,9 203,9 2516,9 11005,4
37 Mussel 1922,5 31,5 669, 1 75,6 65,3 2764 19748,3
38 Horned octopus 240,9 46,2 122.4 33 111,8 554,3 2375,3
39 Squid·Todar-od•s 207,5 89, 1 180,2 98 115, 1 689,9 8365,5
40 Clam 9,5 33,3 651,2 51,6 20,9 766,S 28919,6
41 Other species 249,5 112,9 1136,1 256,3 121. 9 1876,7 19596,9
42 Lobster 42,4 39 143,6 26 1. 9 252,9 761,6
43 White shri11p 20,5 33,2 430,5 109.6 67,2 661 9177, 7
44 Red-shrimp 93,4 20.8 217.3 81,6 38,7 451 ,8 3091,6
45 Squilla •antis 65.2 86,6 227,8 62,4 26,5 468,5 3476, 1
46 Norway lobster- 86,3 41,3 178,7 52 42,7 401 3982.4
47 Other speci,s 147,2 95,2 412 150,1 93 897,5 4060,7
GENERAL TOTAL 11899,4 7311,5 21220,2 10194,5 6141,2 56766,8 360962,9
Source: I.S.T.A.T.
TAB. 1.1.3A • LANDINGS BY GEARS AND BY ADMINISTRATIVE REGIONS JN AREA I.1 (VOLUME IN TONS, X TOTAL ITALY• 100)
REGIONS TRAWLER PURSESEtNER G!LLNETTER OTHERS POLYVALENT TOTAL
TONS X TONS X TONS
"
TONS X TONS X TONS XLt GURU 2997 0,58 9430 1,83 744 0, 14 206 0,04 1364 0,26 14741 2,16
TOSCANA 6221 1,21 1S39S 2,99 903 0, 18 (.) (·) 1021 . o. 2 21540 4,57
LAZIO 13786 2,68 167 0,03 5248 1,02 608 0, 12 (.) (.) 19809 3,85
CAHPANtA E CALABltlA 7090 1,38 10932 2.12 3234 0,61 c·> (.) 3666 o. 71 24922 4,84
AREA 1.1 30094 5,8S 35924 6,97 10129 1,97 1628 0,16 6051 1, 17 83012 16, 12
TOTAL ITALY 271935 52,83 51678 10,43 19172 7,61 66890 13 83056 16,14 514711 100
(•) Not availabla
'1J
gears trawler puraesein glll net long
others multl_ele
note: aee table 1.1.3 for the apecle• name
( aource: lrepa
FIG. l.l.3 ITALIAN CAPTURES MATRIX BY GEARS AND SPECIES
[image:20.1008.203.954.198.387.2]TAB. 1.1.4 AREA 1.1: DATA ON THE FISHING FLEET BY TYPE OF GEAR (1986/1987)
1YPEOF GRT CATCH (mt) CATCII/GRT (kg) PROCEEDS PROCEEDS/GRT <Ecu '000) (Ecu 'OOO) VESSEL
(a) (b) (c) =(b/a) (d) (e) =(d/a)
Trawler 27,350 30,094 1,100 158,670 5.801
Purseseiner 7,315 35,924 4,911 48,169 6.585
Gillnetter 8,848 10,129 1,145 74,548 8.425
Others 911 814 894 2,206 2.422
Polvvalent 10,820 6,051 559 26,149 2.417
AREA 1.1 55,244 83,012 1,503 309,742 5.607
TOTAL ITALY 263,606 514,731 1,953 1,624,759 6.164
Source: (a) based on 1ST AT figures: (b) and ( d) IREP A's Fishing Fleet Observatory
TAB. 1.1.5 AREA 1.1: SAMPLE AVERAGE PROFITS AND COSTS BY
FISHING GEAR (ECU 1989)
ITEM TRAWLER PURSESEINER GILLNETTER OTHERS POLYVALENT
GROSS RECEIPTS 123,000 114,000 . 19,450 - 34,500
% RUNNING COSTS 50 31 53 - 48
% l.AUOUR COSTS 38 41 18 - 27
% PROFITS (1) 12 28 29 - 25
A VERA GE OWNER 23,000 31,300 9,500 11,380
EARNING
-Source: I.R.E.P.A.'s Fishing Fleet Observatory
~ ~
TAB. 1.1.6 REGIONAL DISTRIBUTION OF THE FLEET BY AGE OF VESSELS
(NUMBER AND GRT' - AREA 1.1
ZONE 0-4 5-9 10-14 15-19 20-24 > 25 UNKNOWN TOTAL %
LIGURIA 44 219 154 128 141 442 16 1144 20
TOSCANA 72 184 177 115 117 327 76 1068 19
LAZIO 73 171 134 160 199 317 20 1074 19
CAMPANIA 139 334 250 214 187 471 19 1614 27
CALAHIUA 61 115 122 107 149 284 17 855 15
%A l.1=100 7 18 14 12 14 32 3 . .
TOTAL 389 1023 837 724 793 1841 148
5755
NUMBER .
LIGURIA 369 1444 899 635 956 3010 45 7358 12
TOSCANA 1885 2753 1176 1445 2086 4716 140 14201 25
LAZIO 829 1329 1357 1370 4750 4774 222 14631 26
CAMPANIA 1224 2294 3880 3352 1643 3154 107 15654 27
CALABRIA 617 864 1004 764 942 1220 59 5470 10
%AI.l=l00 9 15 15 13 18 29 1 . .
TOTALGRT
4924 8684 8316 7566 10377 16874 573 57314
(*) .
Source: Our processing on I.S.T.A.T. data '89 .
1.2 AQUACULTURE
1.2.1 The principal productive.sectors
Aquaculture has developed following the national pattern. During the 1970's, emphasis was still placed on the breeding of fish in "fish valleys" which today cover 7,463 hectares. In 1990, in the area I .1, there were 49 establishments and total trout production was 1,765 tonnes corresponding to a value of 4.7 million ECU. The production of euryhaline species in salt-water has concentrated on the rearing of eels, sea-bream and sea-bass. Forty-four establishments are registered with API {Italian Association of Fish-Farmers), of which 26 farm eels. In 1990, these establishments employed 483 workers produced 755 tonnes of fish for a value of around 9 million ECU ( see tables 1. 2 .1, 1.2.2, 1.2.3, 1.2.4, 1.2.5).
In this context, traditional eel production is now accompanied by the recently developed farming of more expensive species {namely, sea-bream and sea-bass). As such, this is a sector in evolution. On the one hand, eel farming is relatively stable whilst sea-bream and sea-bass farming is going through a phase of growth with better future prospects, even if these are conditioned by the speed of technological innovation and international competition.
Mussel farming, on the other hand, ·is in continual expansion, even if this has slowed down in recent years. In 1990 12,450 tonnes were produced, corresponding to a value of over 12 million ECU.
1.2.2 Trout farming
In area I.1 there are 49 trout farms, of which the majority (30) are concentrated in Tuscany. Seven more farms are present in Latium reinforcing the picture of the prevalence of such farms in central Italy. Indeed the remaining 12 farms which are distributed across the remaining three regions contribute just 8% of the supply of trout provided by the area.
The greater part of trout production is sold on the domestic market with a relatively small part being exported. Trout consumption is encouraged both by the constancy of the supply and
·its competitive price with respect to other fish. Technological deyelopments. in the . last ten .-y.ears _,have been <;;on:qe.;~tra_.ted on improving the yield from trout-feed and resolving technical problems of the farms and trout farming is now amongst the most productive forms of aquaculture in Italy. Technological development in trout farming is currently concerned with experimentation in new techniques for resolving problems of pathology and with reducing the cost of foodstuffs. Froin this point of view, the relatively small size of firms does not allow the exploitation of potential economies of scale which might be expected.
Trout farming is typically carried out as a family business covering, on average, an area of two hectares with limited access to technological and financial resources. The main aim of this
form of organisation is the reduction of the costs of production and of the riskiness of capital investment. Production workers are an integral part of the nuclear family and normally comprise
no more than four persons. At the same time, productive
techniques are developed at the level of the individual farm and there is limited circulation of information amongst farms.
1.2.3 Mussel farming
Mussel farming is undertaken in sheltered areas with. an average level of eutrophy. There are 12 establishments in Liguria and Latium. It is true that, until 1970, the Campania region also had a sizeable mussel production which, however, was almost completely eradicated after the cholera crisis. Total production comes to around 12,000 tonnes per year, of which over 50% comes from Ligurian establishments in the area of La Spezia. The value of production, given a price of around 1,000 ECU per tonne, is roughly 12 million ECU.
Mussel production is almost entirely destined for the domestic fresh fish market with a small percentage going to the processing industries. In particular, supply is sufficient to entirely satisfy demand in the spring and summer periods, whilst in the autumn and winter months, the high demand is mostly satisfied by imports.
The simplicity of cultivation techniques has allowed the wide diffusion of mussel farming. The productive model employed in the Tyrrhenian area is of two types: fixed and floating. The first is found in areas characterized by shallow water in which the Mussel-lines are attached to poles sunk into the sea-bed. The second method employs a cable kept on the surface by buoys to which are attached the Mussel-lines.
In general, the establishments are organised as cooperatives and provide a viable alternative to crewing on fishing boats.
The establishments cover a minimum area of 1,500 square metres and the sector has developed in areas traditionally dedicated to this activity, and thus enterprises are able to exploit the existing technology.
1.2.4 The farming of euryhaline species
·The· La:rming of- these · speci·es is carried out at 44 -establishments in the area, of which 26 produce eels even if many do so on a small scale, and the remaining 18 are devoted to the farming of sea bass and sea bream. Also in the latter case there is a need to distinguish between family enterprises operating on a very small scale and whose objective is to increase incomes largely derived from other sources, and those establishments devoted entirely to fish production.
The sector concerned with eel farming, even if traditionally linked to fresh water "vallicoltura", has provided the productive structure which has allowed the development of the intensive farming of salt-water fish. It should be emphasised, however, that the take-off of productive activity in this area, as in the
rest of Italy, has only been made possible by the introduction of Community regulations which have provided financial incentives for the setting up of the productive apparatus on an industrial scale which would not otherwise have been possible, given the economic risks and the physical characteristics associated with animal production in its experimental phase.
Currently, production of euryhaline species in this area has reached 755 tonnes per year. Tuscany and Latium are the regions with the highest concentration of farms accounting for 90% of the area's production both in terms of quantity and in terms of value.
Apart from the traditional valley farming, eel farmers have recently developed intensive farming techniques. In particular, in Latium, the presence of 1,618 hectares of valley and 11 intensive farms have allowed the creation of a solid productive structure. In 1990, regional production reached 220 tonnes destined principally for the domestic market which is characterised by the seasonal nature of demand, concentrated around the Christmas period.
From the technological point of view, this section is going through a period of transition due to the diffusion of intensive farming techniques. Family farms make up the majority of productive units and operate in areas of up to 15, OOO square metres and employing 3-4 workers.
Sea bass and sea bream farming has not yet fully exploited its potential, given the relatively recent introduction of intensive farming techniques. There are currently 17 establishments, 8 of which are in Tuscany. Thanks to the particular characteristics of the water, Tuscan farms produce 250 tonnes of sea bass, 100 tonnes of sea bream, 60 of mullet and 55 of eels. These figures, drawn from official sources make Tuscany the principal producing region in the country.
The insufficiency of newly hatched fish is still creating uncertainty to farmers even if many have opted for the introduction of hatcheries on their farms. At present, there are 3 hatcheries operating in Tuscany able to produce 360,000 newly hatched sea bass and 80,000 sea bream. At an experimental level, newly hatched sole and white bream are also being produced. The production of newly hatched fish is not sufficient to satisfy the needs of the fish farmers.
The market for both types of fish have the similar characteristics. 80% of - production is sold directly to wholesalers whilst the rest goes to restaurants. Export of these species is virtually non-existent, conversely the importation of these types of fish from other Mediterranean countries is carried out on a massive scale. The price of imported fish is highly competitive in relation to the internally produced stock. As a result, the reduction in the risk faced by producers in this sector is subordinated to the need to reduce costs of production.
Employment in productive activity is relatively low. Indeed, on the larger farms, which are typically joint-stock companies, the average number of employees is 7. In the case of the smaller family enterprises, for ·whom fish farming is not the principal activity, there are no more than 4 employees for each productive unit.
...
Ul
TAB. 1.2.1
ZONE I.IGUIUA TOSCANA 1..AZIO CAMPANIA CAI..ARRIA
SUH TOTAi. i.i
·roTAI. ITAl.Y
Source: A.P.I.
TAB. 1.2.2
ZONE UGURIA TOSCANA I.AZIO CAMPANIA CAL-\URIA SUB TOTAL l.l
(a)
TOTALITALY
(b) Source:
REGIONAL DISTRIBUTION OF FISH FARMING REGIONAL PRODUCTION OF EURYHALINE ESTABLISHMENTS IN AREA 1.1 (1990) TAB. 1.2.3 SPECIES BY INTENSIVE METHODS IN AREA
TROUTS t-:URYIIAI.INI• MUSSEIS OTJmRS sun TOTAi. VAi.i.i (IIA) SPP.
3 2 5 3 13
1.1 (IN TONS.\
ZONE Sl!.A HASS SI,:,\ EEL MUI.U., TOTAL HREAM
30 20 2 52 5410 I.IGURIA 10 40 50
7 18 6 3 34 1618 TOSCANA 245 105 55 60 465
5 2 ! 1 1 9 435 I..AZIO 220 220
4 2 6 CAMl'ANIA 10 10
49 44 12 9 114 7463
562 185 280 258 1285 63485. CAI.AIIRIA
10 10
TOTAi. i.i 255 145 295 60 755
I Associazione Piscicoltori ltaliani) Source: I.R.E.P.A. estimate
REGIONAL DISTRIBUTION OF REGIONAL DISTRIBUTION OF AQUACULTURE
AQUACULTURE AND VALLICULTURE TAB. 1.2.4 PRODUCTION IN TERMS OF VALUE IN AREA 1.1
PRODUCTION IN AREA 1.1 ITONS. 1990L TROUTS J-:URYIIAI.INI MUSSELC, Al.I.
Sl'I' . TROUTS
IWRYIIAI.INE
MUSSEIS Al.I,
ZONE s1•1•.
50 6.800 6.850 ECU ECU ECU 'OOOECU
1.080 465 1.545 I.IGlllUA 767.113 6.569.630 7.337
560 220 2.800 3.580 TOSCANA 2.832.400 6.068.000 8.900
75 10 2.850 2.935 LAZIO 1.578.800 1.875.165 2.753.740 6.208
50 10 60 CAl\tl'ANIA 211.120 91.770 2.802.911 3.106
1.765 755 12.450 14.970 CAlAIIIHA sun 140.965 85.200 226
TOTAi. i.i /II) 4.763.285 8.887.248 12.126.281 25.777 35.000 1.900 95.000 132.550
(a) I.R.E.P.A. estimate (b) I.C.R.A.P.
TOTAi. ITAI.Y (h) 104.904.275 64.122.738 84.906.897 253.934 Source: (a) I.R.E.P.A. estimate
(b) I.C.R.A.P.
TAB.· 1.2.5 AREA 1.1: EMPLOYMENT IN AQUACULTURE BY REGION
ZONE TROUT EURYIIALINE EEL MUSSELS OTHERS TOTAL SJ>P.
I.IGUl~IA 12 7 4 15 9 47
TOSCANA 120 56 48 6 • 230
LAZIO 28 49 44 18 9 148
CAMPANIA 20 8 3 3 34
CAI.AHRIA 16 8 24
TOTAi. l.l 196 112 112 36 27 483
1.3 THE FISH PROCESSING INDUSTRY
1.3.1 Overview of the fish processing industry
The structure of the industry concerned with processing fish is divided into differentiated sections. On the one hand there is a section consisting of small-scale artisanal production while on the other there is a truely industrial sector.
The latter, in line with the general stra~egy of industrial concentration characterizing the entire foodstuffs industry, is going through a process of concentration based both on commercial strategy ( the acquisition of bigger market shares in certain products) and financial strategy (the buying up of existing productive units with diversified lines of production). The phenomena of the specialization and the vertical integration of production is increasingly evident.
Quite apart from the economic consequences of these
developments, one observes a slow process of restructuring and rationalization which cannot but have an important influence on the future development of, and employment in, the sector. The driving force behind these changes are trends in consumption
subject to the constraints of providing primary goods,
international trade and tariff and regulatory policy.
On the basis of data produced by ANCIT~ domestic consumption in Italy in 1990 was 1384 million ECU. When compared with the corresponding total for 1983 of 530 million, this figure gives us a precise measure of the important role played by consumption in the sector. The figure for domestic consumption is comprised of 945 million ECU spent on domestic production (equivalent to 144300 tonnes) added to 439 million ECU of net imports. Exports equal to 56 million ECU represent 10% of the normalized balance of payments and are equally insignificant when seen against the imports of 495 million ECU. Furthermore, to the cyclical nature of exports is added the trend towards growth in imports ( see table 1. 3. 1) .
The progressive liberalization of the Community market, following the end of the period of protectionism in 1985, has given a stimulus to the import of both raw materials and goods for final consumption to such an extent that i t is now at a level of 52% of domestic production and 36% of total consumption. Furthermore, the enhanced competitiveness of imported products has slowed down price increases to such an extent that· these no longer cover increases in the cost of labour on the domestic market.
Even so, sustained by increased consumption, domestic
production continues to grow steadily {at an average rate of 10% p.a.}. Around 6,800 people work in the industrialised part and over 1,300 are employed in the artisanal segment. As is well known, however, overall employment depends on the degree of capacity utilisation of the industry which, in the case under consideration, is relatively low with respect to other industrial sectors and has been in steady decline since 1987, reaching an all time low of 58% in 1990. Therefore, ceteris paribus, one may expect a steady reduction of manpower in the industry in the future (see table 1.3.1}.
With regard to this last point, it is relevant to note that degree of capacity utilisation is accompanied by constancy in gross fixed investment. That is to say, notwithstanding the excess of unused capacity present in the processing industry, the nature of gross fixed investment has not been altered in the slightest. Industrial policy based on the direct substitution of depreciating capital stock has thus replicated the existing structural deficiencies without taking account of changing economic trends. Over the last decade the policy of simply substituting worn out equipment has not altered the productivity of either labour or capital. Thus, entrepreneurs have simply responded to market pressures by sustaining the status quo, investment being simply a response to physical deterioration of the capital stock of the industry, without adapting to external conditions (i.e. laws, and the loss of competitiveness).
This defensive strategy has had the support and
encouragement of EEC structural policy which has only recently begun to reward investment aimed at increasing productivity, so as to partially compensate for the rising (relative) cost of labour. Thus, the impact of Community policy in the form of its structural policy has been the maintainance of the existing levels of production and employment, without, however, tackling the existing structural problems and without a policy of orientation to prepare for the unification of Community markets.
A relative growth in competitiveness is not common to all sections of the fish processing industry and does not depend
-exclusively on the nature of gross fixed investment. Specific productive subsectors respond differently to market conditions, with the only common factor being the dependence on foreign provision of raw materials. Going beyond problems of individual subsectors, it should be stressed that the principal problem of the processing industry is the lack of competitiveness of Italian production with respect to foreign producers caused by the high cost of labour. Given that the processing industry is invariably "labour intensive" it is clear that, as long as the domestic product supplied is similar to, and in competition with, that provided by foreign producers, the conditions for a growth in employment do not exist and domestic demand "is destined to be increasingly satisfied by foreign production. Furthermore, as long as structural and market policy (CFP) does not change direction, the sector cannot evolve in a positive manner both with regard to production and to employment (see fig. 1.3.1 to fig. 1.3.6).
1. 3. 2. The fish processing industry in the area and principal productive subsectors.
Tuna processing, represents the largest subsector 'in the area. Local production amounts 27.000 tons (1990) while 430 workers are employed. To increase flexibility and reduce financial costs factories are now also employing about 20% part time workers in order to meet demand just in time and to reduce In the whole area there are 6 canning factories. In Calabria there are 3 small/medium size factories ,in Campania there are 2
plant, of which one is among the largest in Italy with a
production of 13.219 tons. In. Lazio there is 1 large factory
and 1 small canning factory is located in Tuscany. In Liguria there is no tuna in oil production. Since italian catch of tuna is virtually non existent (3./4.000 tons) if compared with the total tuna processed in the Country (140.000 tons) i t is evident that there is no link between the catching and canning sector and no direct induced employment can be foreseen.
The sardine in oil processing industry (around 3.000 tons
and 220 workers in the area under study) has a different
structure since it is vertically integrated with the catching sector and i t is able to take advantage of the existing EEC market rules since the raw material is supplied by italian O.P.'s. They are also concentrated in Lazio (2) and Tuscany (1). Notwithstanding the level and type of gross fixed investment undertaken in the last decade, problems related to domestic demand and international competitiveness are threathening
employment in both the industrial sector and in related fishing
activities.
Firms involved in the anchovy processing industry are concentrated in Campania, in the Salerno Province, even if some
others are located in Liguria. More than 30 factories are
actually active in the area and most of thein are real family business. The size of the factories is determined by the high level of flexibility needed by this production, since periods of
intense activity follow periods where activity is reduced to
nothing and workers are involved with other, not necessarily fish based, productions. The value of the production is high if compared with other products. The unit value of anchovies in oil
is about 25.000 Lit/kg, while tuna reaches only 8.000 Lit/kg.
During 1990, anchovy processed production re.ached about 10. 500 tons, while there were about 500 workers employed.
Factories processing non frozen products are also important either for the value of the production and in terms of employment. Production is distributed along the west coast
and, once again, most of the productive units are family
business. Most of the raw material used for the process is
imported {squid, cuttle fish, molluscs, octopus etc), even if
some species are supplied from local sources (mackerel, eel,
tuna, swordfish, pilchards) and from import {molluscs, squid,
cuttle fish, etc.). Production in the area amounts to 2.000 tons and employment reaches 80 workers.
As regard frozen fish products, there are quite a few factories {20), generally small, and they are disseminated all along the coast. Production is sold to the four or five leading brands
operating in the sector which have a market share of
approximately 80%. The remaining 20% is marketed directly by
producers. Thus, with regard to intersectoral dependence one needs to be careful in identifying areas which are "heavily dependent on fisheries", with the resultant employment effects. The presence of freezing plants provides an indication of this dependence. However, the sector is so small {no more than 3% of domestic production) that one may say that there are no areas "heavily dependent on fisheries" which cannot absorb the negative effects on fishing activities of possible restrictive policies.
~
\,,0
TAB. 1.3.1 PRINCIPAL INDICATORS FOR THE PROCESSING INDUSTRY - 1983/1990
YEAI( ( JI (2) fl) ._81 (51 -1~L 171 _lfil_ -121_ U!~L
1~83 384 26 173 ·146 530 87000 7 63 6600 11.11
1984 458 32 226 ·194 652 95100 10 64 6500 10.44
l98S 569 50 309 ·260 828 107600 13 65 6700 12.00
1986 101 49 316 ·267 975 120500 17 68 6800 5.00
1987 823 39 416 .377 1200 130500 17 70 6900 7.30
1988 854 45 430 .385 1239 129110 19 65 7050 8.05
1989 910 59 460 ·401 1312 137400 15 63 7100 7.34
1990 945 56 495 .439 1384 144300 12 58 6800 5.34
PI National ~roduction value at market ~rkc (million ECU}
(21 Ex~ort v.slue at market ~rice {million ECU)
131 lm~ort value at market ~rice {million ECU}
141 lnbalance commercial trade at market ~rice (million ECU}
151 Net consum~tion at market ~rice (million ECU)
161 Production (tons.)
171 Gros investments {million ECU)
181 Average ex~loita1ion of firms (%}
191 N. of workers
I IOI Annual variation of the lahour cost's ('Y.,) f 11 I Annual variation of produclion prkcs ('Yt.) Source: dahoration on ANCIT data
( 11 I
13.00 19.00 24.00 24.00 16.50 4.00 6.58 3.6-1
... .--3
•
p-~ CD
.
WA
• "<
PRODUCTION. IMPORTS, EXPORT, NET CONSUM.
P'IIOCIUIN8 INOU8TIIY
1080
100
Iii- .. --C> - - -..a ... -380 .. D--• - D"'
• o·
O'---'
1H3 tH4 1988 1988 11187 19H 198' 1980
- P'IIOOUCTION ...U.UI + IXP'OJIT - NIT CONIUMP'TION o-IIIP'OIIT
1,1e.u.11
LABOUR COSTS ANO PRODUCTION PRICE PROCESSIHO INDUSTRY
Annual nrlatlon (1.l
23
18
13
8
3'--- - - - ---' 1983 1984 19H 1988 11187 1988 1188 1990
I -
LABOUR COST + PRODUCTION PRICEl
lfle. U.3)EMPLOYMENT ANO PRODUCTION PROCESSING INOUSTA'f
Number Tona hllouMndal
148
1080
138
' ,... ~ -l ..,_ . ~) ~
HOO 128
..
118 8750 toe HOO H 8480 H11183 1984 19H 1988 1987 tllH teat 1HO
-EMPLOYEE .,. PAOOUCTION
l
" • · U.11Source: Our processinq on ANCIT data
20
VALUE OF IMPORTS AND PRICE VARIATION
P'IIOCH-8 INOU8Tll"t
Minion ECU
+-·· ----+ 23 480 18 380 13 280 8 ...
1~ 3
11183 1tl4 11H 1988 1987 1988 11H 1HO
I -
IMP'OlrT ...U.UI ··+·· P'IIICI WJIIAl'IONI
1,1e.u.21
EMPLOYMENT,.CAPACITY UTILIZATION OF FIRM
P'IIOCl881N8 INOUaTll"t
Humber ... , . (1,) 18
7060
+ 70
HOO
..
+
..
ea 8780 ++
eo HOO
8480 H
1983 1984 1188 1H8 11187 1988 1989 1HO
I -
IMP'L0¥11 ., · EXP'LOITATION o, ,. ....I
1,1a. U.4)
GROSS FIXED INVEST .,CAPACITY UTILIZATION
l'IIOCIUIN8 INOUaTIIY
Mllllon ECU .-...,age C1")
2 0 , - - - -~---~1e
10 18 18
..
10 toa ae
'883 11114 11185 . . . 1187 11188 111H 18'0
I -
8ll088 INYl8TMINT'·., IXP'LOIT.VION ,. ...1.4 SUPPORTING SECTORS, DISTRIBUTION AND RELATED SECTORS
1.4.1 Fishing ports
In area I.1 there are 57 ports which are currently equipped for fishing boats. Indeed, the majority of fishing ports are not sufficiently equipped to provide the range of services necessary to rationalise and improve the conditions for the unloading and first sale of the catch.
A study commissioned by the Ministry for the Merchant Navy has compared the existing state of affairs as regards the equipping of fishing ports with what would be theoretically optimal. As a result i t has been possible to identify the financial requirements necessary to improve conditions regarding fishing and the unloading of the catch.
In the present case, given the conditions of port structures in the area under study, the investment necessary to equip fishing ports comes to around 26 million ECU. More than 50% of this would be necessary to equip ports in Campania and Calabria
(7.9 and 6.7 million ECU, respectively). In the former,
investment is necessary to provide equipment concerned with production, whilst in the latter, equipment is necessary for safety reasons.
It should be emphasised, however, · that the total sum required in the area is only 16% of that required for the whole of Italy. In particular, the majority of the expenditure is necessary to improve the safety of ports in the area. Indeed, investment in safety equipment in area I.1 represents 20% of the total required for Italy as a whole (table 1.4.1). The dynamics of employment in this sector is dealt with in step 1.4.3 ..
1.4.2 Commercial channels
The unloading of the fishermen's catch is extremely
fragmented there being 289 unloading points in the area. At the commercial level, the numerous landing-places translates itself into a segmentation of distribution channels. On the one hand, there are fish markets institutionally set up in order to bring together demand and supply. On the other, private operators, quite different in function and scale from the institutional markets, have the task ··of distributing fresh fish throughou-t the area. These operators are concerned exclusively with the sale of fresh fish unloaded by the fleet. Indeed, if one excludes sardine fishing, most of the fish caught in the area is not processed or conserved, but is sold fresh. In this context, distribution of the catch is limited to the province or, at most, the region. The sale to final consumers is carried out by specialised fishmongers which even today, notwithstanding large-scale investment in this sector by the bigger distributors, remains the principal channel for the sale of fresh fish.
The result of this fragmented distribution system is a complicated and crowded web of commercial flows which, as well as resulting in the duplication of intermediaries, is the cause of the lack of transparency of the market.
Fish markets
This analysis of fish markets in area I.1 is based on data available which relate to ten of the twenty-five markets in the area under study. The evaluation of the data, apart from drawing attention to the technical and economic indicators relating to the markets, is concerned with the analysis of average (sample) values of structural parameters (see tab. 1.4.2).
Such an analysis shows that the current dimensions of the structure represent an obstacle to increasing the quantities sold. Given the productive potential of the area, the markets' dimensions are in line with the quantities passing through them.
From this point of view, the current scale of operations represents a physical obstacle to increasing in the quantities sold in fish markets. In contrast, the presence of "off-the-market" sales, estimated as representing 3 0% of market sales, provide the possibility for increasing fish sales. In this
context, the possibility to exploit the potential that a
reduction in "off-the-market" sales would represent is conditional on, on the one hand, an expansion of existing structures and the construction of new public commercial complexes and, on the other, the capacity of markets to provide additional services above and beyond the sale of produce.
The level of employment in these structures is constrained by the level of trade carried out therein. Indeed, apart from the indispensible minimum employment necessary for the normal carrying out of market operations, expansion of the workforce must occur in the auxiliary services which aid the smooth running of the market. Thus, the existence of structures of dimensions comensurate to potential supply and demand in the area would encourage the allocation of fish through institutional channels and the induced employment in the sector.
Wholesale
Given the evident shortcomings of the fish markets, private wholesalers have assumed a neccesary role in the distribution and sale of fish.
In area I.1, there are over 1,300 registered wholesalers (equal to 30% of the national total) whilst those who are effectively operative are no more than 500 (35% of the national total). Thus, effective fish wholesalers make up 38% of those registered. Even though these figures refer to the Census of 1981 the picture is still valid.
With regard to area I. 1, a previous examination of the density of the ea tch ( in terms of value) and the density of wholesale outlets by region, controlling for population density,
suggests a close link between the location of wholesalers and fishing areas that goes beyond simple regional disparities and is attributable to the uneven distribution of fishing activities. This variation in density is due to the relative weight of inland areas with respect to coastal ones (see, for example, Liguria compared to the other reg ions) and the 1 imi ted. range of activity of wholesalers who do not generally extend beyond the boundaries
of single provinces, whether they are acting as receivers of fish direct from fishermen, supplying final consumers or commercial
outlets. .
A quick look at the map of the provinces provided in figure
1. 4 is sufficient to verify the unequal distribution of fish
wholesalers with the highest concentration being found in coastal provinces. 80% of wholesalers operate in coastal provinces with only 20% operating in inland provinces.
Another aspect of the fish distribution network is the dichotomy between small and large firms, with a clear prevalence of the former. 75% of firms employ between one (proprietor) to five persons; just 2. 2% of wholesalers employ more than 20 persons.
There is also a marked tendency towards specialisation in on~ form of product (fresh, frozen or processed) which reflects the lack of dynamism of the family business which tend to be as lacking in any desire to diversify as they are in technical and managerial skills. This has consequences for consumption in as much as the specialisation of suppliers tends to shrink the consumers' preferences and thus acts as an obstacle to future evolution of the market. Diversification is also lacking in the prevelant types of activity. Few wholesale firms also undertake the related activities such as decapitation, gutting or packing or have been vertically integrated with retail outlets.
1.4.3 Related activities
In Italy, the productive units involved in all economic activities are ov~r 3.5 million firms employing around 17 million people. In the area under consideration there are almost one
million firms with over 4.7 million employees.
Necessarily limited to a qualititative and quantitative analysis of the existing sectoral links, the starting point is the identification of categories of economic activity that
interact with the fisheries. We have used an Input-Output matrix
for Italy, broken down into 92 branches of economic activity, which identifies both the origin of inputs and the destination of output from fisheries. On the basis of this matrix, we have
identified the corresponding activities branches to the
individual activities ea tegory, more than 500. More than 250 business typBs relate4 to fishery have been identified and finally related to the 17 activities branches related to the regional matrix.
In Italy the analysis may, in this way, be narrowed down to a consideration of 1. 2 million firms with around 8 .1 million
employees. In the case of area I. 1, the relevant population
consists of roughly 230,000 firms (around 20% of the areas total) employing a workforce of roughly 2.5 million equal to around 50%
of total employment in the area (see table 1.4.3).
The analysis is carried out using regional input-output tables which divides economic activity up into 17 branches (see appendix 1) .
The regional tables include the relevant subsectors, namely fish farming, fish processing, fishing ports, distribution (wholesale