CONCISE REPORT
High frequency of antidrug antibodies and
association of random drug levels with ef
fi
cacy in
certolizumab pegol-treated patients with rheumatoid
arthritis: results from the BRAGGSS cohort
Meghna Jani,
1,2John D Isaacs,
3Ann W Morgan,
4Anthony G Wilson,
5Darren Plant,
6Kimme L Hyrich,
2,6Hector Chinoy,
1,6Anne Barton,
1,6on behalf of BRAGGSS
Handling editorTore K Kvien ▸Additional material is published online only. To view please visit the journal online (http://dx.doi.org/10.1136/ annrheumdis-2015-208849).
For numbered affiliations see end of article.
Correspondence to Professor Anne Barton, Arthritis Research UK Centre for Genetics and Genomics, Centre for Musculoskeletal Research, Institute of Inflammation and Repair, University of Manchester, Manchester Academic Health Science Centre, Stopford Building, Oxford Road, Manchester M13 9PT, UK; anne.barton@manchester.ac.uk
HC and AB joint last authors.
Received 1 November 2015 Revised 30 March 2016 Accepted 6 May 2016 Published Online First 31 May 2016
To cite:Jani M, Isaacs JD, Morgan AW,et al.Ann Rheum Dis2017;76:208– 213.
ABSTRACT
Objectives To evaluate (i) the association between random certolizumab drug levels, antidrug antibodies (ADAbs) and treatment response in patients with rheumatoid arthritis (RA); (ii) longitudinal factors associated with ADAbs and certolizumab drug levels.
Methods This prospective cohort included 115 patients with RA treated with certolizumab. Serum samples were collected at 3, 6 and 12 months following treatment initiation. Drug levels and ADAbs were measured using ELISA and radioimmunoassay, respectively, at 3, 6 and 12 months. Disease Activity Score in 28 joints (DAS28) were measured at each visit and 12 months European League Against Rheumatism (EULAR) response was calculated. Patient self-reported adherence was collected longitudinally. Ordinal logistic regression and generalised estimating equation were used to test the association: (i) between drug levels, from serum sampled and treatment response; (ii) between ADAbs and drug levels; (iii) patient-centred factors and drug levels.
Results ADAbs were detected in 37% (42/112 patients by 12 months). The presence of ADAbs were significantly associated with lower drug levels over 12 months (β=−0.037, 95% CI−0.055 to 0.018, p<0.0001) but not independently with 12 months EULAR response (β=0.0013 (95% CI−0.0032 to 0.00061), p=0.18). Drug level was associated with 12 months EULAR response (β=0.032 (95% CI 0.0011 to 0.063), p=0.042). In the multivariate model, ADAb level and adherence were significantly associated with drug concentrations.
Conclusions This is thefirst study to demonstrate that higher certolizumab drug levels are associated with better 12 months EULAR response. ADAbs in
certolizumab-treated patients with RA were detected at higher levels than previous studies and help determine the aetiology of a low drug level.
INTRODUCTION
Although tumour necrosis factor inhibitor (TNFi) drugs, such as certolizumab pegol, have been shown to be efficacious in the treatment of rheumatoid arthritis (RA), not all patients respond to treat-ment.1 2In infliximab, adalimumab and
golimumab-treated patients, absent/reduced treatment response may be the result of low drug concentrations due to immunogenicity (formation of antidrug antibodies (ADAbs)).3–5ADAbs can reduce drug concentrations
via antibody-mediated drug clearance, and reduce efficacy by preventing the drug binding to its target. Certolizumab pegol is a PEGylated Fab’fragment of a recombinant humanised antibody directed against TNF. While PEGylation has been shown to reduce ADAbs in some proteins,6 it may increase it in others.7
Initial registration trials in certolizumab-treated patients with RA revealed low ADAb levels using an ELISA, ranging 5.1%–6.1%.1 2 In a post hoc Crohn’s disease trial analysis, higher certolizumab drug levels were associated with endoscopic response and remission.8 To date, there have been no prospective observational studies assessing drug levels and ADAbs for correlation with treatment response in certolizumab-treated patients with RA. The aims of this study were to (i) assess the inci-dence of ADAbs in certolizumab-initiated patients with RA using sensitive detection techniques; (ii) test the association between certolizumab drug levels, ADAbs and 12 months treatment response in patients with RA; (iii) assess baseline and longitu-dinal factors associated with certolizumab drug levels and ADAb formation.
METHODS
Patients
Certolizumab-initiated patients were recruited to a prospective observational cohort study, the Biologics in Rheumatoid Arthritis Genetics and Genomics Study Syndicate (BRAGGSS), from 60 UK centres between March 2010 and January 2015.9 From the total cohort, 115 patients were selected, according to the following inclusion criteria: RA according to the revised American College of Rheumatology 1987 criteria,10 active disease indi-cated by a 28-joint Disease Activity Score (DAS28) of ≥5.1 despite earlier treatment with at least two non-biologic disease-modifying antirheumatic drugs (nbDMARDs) including methotrexate; patients of Caucasian descent; about to be initiated on subcuta-neous certolizumab 400 mg every 4 weeks; baseline visit recorded with≥1 subsequent visit where serum samples and clinical data were available.
Following initiation of therapy, patients had serum samples collected and disease activity assessed at 3, 6 and 12 months.9 Clinical and
point. Adherence was classified as previously defined.11 Contributing patients provided written informed consent, and the study was ethically approved (COREC 04/Q1403/37).
Clinical response
Primary outcome was defined as treatment response at 12 months using European League Against Rheumatism (EULAR) response criteria.12Change in DAS28 C-reactive protein (CRP) (ΔDAS28)
was calculated as the difference between the postinitiation and pretreatment DAS28CRP scores. To establish a concentration– effect curve, to determine an optimal drug level cut-off for certoli-zumab patients with RA, all patients were sorted from high to low drug levels with correlatingΔDAS28, as described previously.13
Measurement of certolizumab drug levels and ADAbs
The measurement of random certolizumab concentrations was performed using a sandwich ELISA and ADAbs using radio-immunoassay (RIA) designed by Sanquin, Amsterdam, The Netherlands, as previously described for infliximab/adalimumab patients.14RIA measures the amount of IgG antibodies specific
for certolizumab. Patients were defined as being positive if ADAb titres were >20 AU/mL, as specified by cut-off values generated by Sanquin.
Statistical analysis
Between-group comparisons were investigated using independ-ent sample t tests, Mann–Whitney U (Wilcoxon) statistics orχ2 tests, as appropriate. Ordinal logistic regression was used to test the association between EULAR response at 12 months and
drug levels. To assess effect of covariates longitudinally on certo-lizumab drug and ADAb levels at 3, 6 and 12 months, general-ised estimating equation (GEE) with an identity link was used. The multivariate model included significant factors from uni-variate analysis. The last observation was carried forward for patients with incomplete data. Statistical analyses were per-formed using STATA for Windows V.13.0 and Graph Pad Prism 6.04 for concentration–effect curve generation.
RESULTS
Patients
Over 12 months, 253 serial samples (n=115 patients) were tested for certolizumab drug levels (112 had sufficient sample for ADAb measurement). ADAbs were detected in 37% (42/112 patients) by 12 months of treatment. The baseline characteristics of the total patient population and stratified by detectable ADAbs is shown intable 1. Patients who had detected ADAbs had significantly higher swollen joint counts at baseline. Six patients (14.3%) who developed ADAbs, received a prior bio-logic versus three patients (4.3%) in the group who did not develop ADAbs. Baseline use and dose of nbDMARDs and oral steroids did not differ significantly between groups (table 1).
[image:2.595.45.555.403.717.2]Of the 20 patients who did not complete 12-month follow-up, 11 (55%) stopped due to inefficacy, 6 (30%) stopped due to adverse events (AEs), 1 (5%) each stopped due to ineffi -cacy/AEs, poor adherence (5%) and imminent heart surgery (5%). Of the patients who experienced AEs, two (one with recurrent chest infections) had drug levels of >40μg/mL, two had drug levels 28–32μg/mL (exacerbation of chronic
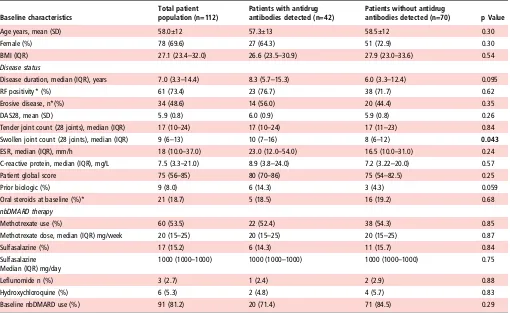
Table 1 Demographic and clinical characteristics at baseline stratified by antidrug antibody status
Baseline characteristics
Total patient population (n=112)
Patients with antidrug antibodies detected (n=42)
Patients without antidrug
antibodies detected (n=70) p Value
Age years, mean (SD) 58.0±12 57.3±13 58.5±12 0.30
Female (%) 78 (69.6) 27 (64.3) 51 (72.9) 0.30
BMI (IQR) 27.1 (23.4–32.0) 26.6 (23.5–30.9) 27.9 (23.0–33.6) 0.54 Disease status
Disease duration, median (IQR), years 7.0 (3.3–14.4) 8.3 (5.7–15.3) 6.0 (3.3–12.4) 0.095
RF positivity* (%) 61 (73.4) 23 (76.7) 38 (71.7) 0.62
Erosive disease, n*(%) 34 (48.6) 14 (56.0) 20 (44.4) 0.35
DAS28, mean (SD) 5.9 (0.8) 6.0 (0.9) 5.9 (0.8) 0.26
Tender joint count (28 joints), median (IQR) 17 (10–24) 17 (10–24) 17 (11–23) 0.84 Swollen joint count (28 joints), median (IQR) 9 (6–13) 10 (7–16) 8 (6–12) 0.043 ESR, median (IQR), mm/h 18 (10.0–37.0) 23.0 (12.0–54.0) 16.5 (10.0–31.0) 0.24 C-reactive protein, median (IQR), mg/L 7.5 (3.3–21.0) 8.9 (3.8–24.0) 7.2 (3.22–20.0) 0.57 Patient global score 75 (56–85) 80 (70–86) 75 (54–82.5) 0.25
Prior biologic (%) 9 (8.0) 6 (14.3) 3 (4.3) 0.059
Oral steroids at baseline (%)* 21 (18.7) 5 (18.5) 16 (19.2) 0.68 nbDMARD therapy
Methotrexate use (%) 60 (53.5) 22 (52.4) 38 (54.3) 0.85 Methotrexate dose, median (IQR) mg/week 20 (15–25) 20 (15–25) 20 (15–25) 0.87
Sulfasalazine (%) 17 (15.2) 6 (14.3) 11 (15.7) 0.84
Sulfasalazine Median (IQR) mg/day
1000 (1000–1000) 1000 (1000–1000) 1000 (1000–1000) 0.75
Leflunomide n (%) 3 (2.7) 1 (2.4) 2 (2.9) 0.88
Hydroxychloroquine (%) 6 (5.3) 2 (4.8) 4 (5.7) 0.83
Baseline nbDMARD use (%) 91 (81.2) 20 (71.4) 71 (84.5) 0.29
*Data for categorical variables is presented as percentage of non-missing data. nbDMARDs listed are the most frequently used in the cohort.
BMI, body mass index; DAS28, Disease Activity Score in 28 joints; ESR, erythrocyte sedimentation rate; nbDMARD, non-biologic disease-modifying antirheumatic drug; RF, rheumatoid factor.
obstructive pulmonary disease symptoms; bilateral pitting oedema and excessive fatigue, respectively), while one patient stopped due to feeling generally unwell with drug levels of 0.2μg/mL (none with ADAbs). The patient who stopped due to both inefficacy and AEs had drug levels of 2.6μg/mL and ADAbs of 70 AU/mL at 6 months. Additional information about all patients who developed AEs and their pharmacological tests is provided in online supplementary table S1.
Detection of ADAbs and drug levels
The ADAb titre ranged from 22 to 1600 AU/mL. The presence of ADAbs were significantly associated with lower drug levels over 12 months using GEE (β=−0.037, 95% CI −0.055 to −0.018, p<0.0001), but not independently with 12 months EULAR response (β=0.0013 (95% CI −0.0032, to 0.00061), p=0.18). Using ordinal regression, drug level was associated with 12 months EULAR response (β=0.032 (95% CI 0.0011 to 0.063), p=0.042).
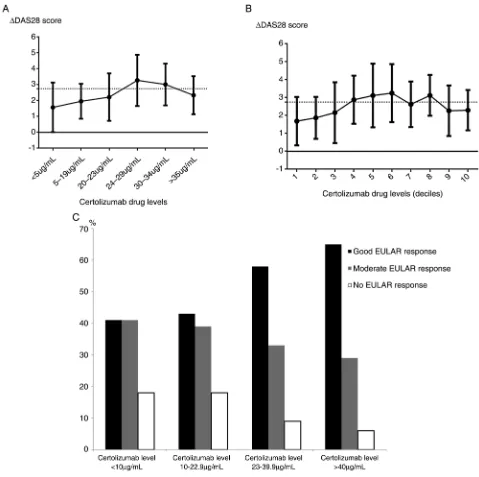
Concentration–effect curve
Figure 1A,B shows concentration–effect curves for certolizumab-treated patients. There was a trend for higher cer-tolizumab levels (>23–24μg/mL) to be associated with improve-ment in DAS28 from baseline. Patients with the highest certolizumab drug levels had a higher proportion of EULAR good responders at 12 months (figure 1C).
[image:3.595.57.536.251.728.2]In figures 1A/B each point represents the mean ΔDAS28 ( point) and SD (error bars) for the certolizumab drug level range measured at 6 months of treatment stratified in ascending order. Due to the distribution in drug levels, stratification of drug concentrations was performed as described in figure 1A. Figure 1B represents mean ΔDAS28 and SD for deciles gener-ated from the certolizumab drug level data at 6 months, similar to previous studies13: (1) 0–10μg/mL, (2) 11–20μg/mL, (3) 21–
23μg/mL, (4) 23–24μg/mL, (5) 25–29μg/mL, (6) 29–31μg/mL, (7) 31–33μg/mL, (8) 31–38μg/mL, (9) 39–46μg/mL and (10) >46μg/mL.
Figure 1C represents the percentages of EULAR responders when stratified by serum certolizumab level. The data represents all 115 patients using last observation carried forward. Patient numbers in each category are as follows: certolizumab levels <10μg/mL: good EULAR response, 7; moderate EULAR response, 7; no EULAR response, 3; certolizumab levels 10–22.9μg/mL: good EULAR response, 10; moderate EULAR response, 9; no EULAR response, 4; certolizumab levels 23–39.9μg/mL: good EULAR response, 34; moderate EULAR response, 19; no EULAR response, 5; certolizumab levels >40μg/mL: good EULAR response, 11; moderate EULAR response, 5; no EULAR response, 1.
Baseline and longitudinal factors associated with drug levels and ADAbs
Factors associated with certolizumab drug level in the univariate GEE analysis were gender, adherence, body mass index, CRP and ADAb level (table 2). In the multivariate model after adjust-ment of confounders, ADAb levels and adherence remained sig-nificant (table 2). Certolizumab drug concentrations showed a strong inverse association with certolizumab ADAb level longitu-dinally over 12 months (table 2).
DISCUSSION
This study demonstrates for the first time that certolizumab ADAbs were detectable in 37% of patients with RA over 12 months of treatment. Detectable ADAbs were associated with lower certolizumab drug concentrations, but not independently with treatment response. However, higher certolizumab drug levels were associated with better 12 months EULAR response. Following adjustment, ADAb concentrations and biologic adher-ence remained the most important predictors of drug levels over time.
Our data demonstrates that even small, non-glycosylated frag-ments such as certolizumab can be immunogenic. The higher levels of ADAbs detected compared with previous certolizumab trials1 2is noteworthy. However, in contrast to other biologics,
ADAbs against certolizumab may be detected more easily even in the presence of drug. Certolizumab is a Fab fragment, mono-valent, and therefore, drug–ADAb complexes easily dissociate and can thus be detected despite the drug not necessarily being more immunogenic. RIA, for the detection of ADAbs, has not been used in published certolizumab trials to date. Our data sug-gests potential for clinical application, but further studies are needed to validate optimal use of the assay in clinical practice. While not being independently associated with treatment response, ADAbs showed a strong inverse correlation with circu-lating certolizumab drug levels. Therefore, detection of ADAbs need not significantly influence treatment response if sufficient drug is still in circulation but may provide valuable insight into the aetiology of low drug levels in certolizumab-treated patients. Certolizumab drug concentrations reflect the amount of circu-lating drug available to bind to the target, so measurement of drug concentrations9may help in determining the aetiology of non-response. This is the first study that has found an associ-ation between detectable ADAbs to certolizumab and drug con-centrations. Other studies have demonstrated in TNFi treated patients, a high disease burden at baseline may be associated with ADAb formation.15 In the current study, pretreatment
swollen joint count was significantly higher in patients with detectable ADAbs, supporting data that baseline inflammation may associate with drug concentrations and certolizumab ADAbs.
[image:4.595.45.555.445.703.2]A strength of our study is the capture of additional factors likely to influence treatment response and drug concentrations in a real-life setting. Of these, adherence was an important
Table 2 Factors associated with drug levels and anticertolizumab antibodies longitudinally over 12 months using GEE
Variable
Certolizumab drug level
βcoefficient (95% CI) p Value
ADAb level
βcoefficient (95% CI) p Value
Univariate analysis
Age 0.14 (−0.017 to 0.29) 0.08 0.021 (−2.16 to 2.21) 0.99 Female gender* 4.76 (0.21 to 9.29) 0.040 −67.36 (−146.14 to 11.41) 0.094 BMI −0.46 (−0.89 to−0.041)* 0.032 −0.92 (−6.03 to 4.19) 0.72 CRP −0.099 (−0.17 to−0.029)* 0.005 0.57 (−0.32 to 1.47) 0.21 ESR −0.12 (−0.22 to−0.020)* 0.019 0.40 (−0.95 to 1.74) 0.58 Baseline methotrexate use −0.11 (−4.68 to 4.47) 0.96 −3.65 (−53.38 to 46.08) 0.89 Baseline methotrexate dose 0.23 (0.33 to 0.78) 0.43 4.94 (3.74 to−13.6) 0.27 Baseline oral steroid use 3.15 (−1.89 to 8.20) 0.22 −29.77 (−69.54 to 10.0) 0.14 Any nbDMARD use at baseline† 3.15 (−1.89 to 8.20) 0.22 −54.66 (−125.37 to 16.05) 0.14 Antidrug antibody level −0.037 (−0.055 to−0.018)* <0.0001 –
Certolizumab drug level – – −2.56 (−4.09 to−1.03)* 0.001 Adherence 10.43 (4.76 to 16.11)* <0.0001 −45.05 (−108.35 to 18.25) 0.16 Multivariate model‡
Antidrug antibody level −0.044 (−0.059 to−0.028)* <0.0001 – Adherence 7.08 (0.71 to 13.45)* 0.029 – Female gender 1.77 (−4.21 to 7.76) 0.56 –
BMI −0.13 (−0.68 to 0.43) 0.65 –
CRP −0.065 (−0.14 to 0.013) 0.102 –
*p<0.05.
†nbDMARD use included methotrexate, sulfasalazine, leflunomide or hydroxychloroquine at baseline.
‡Adjusted for variables significant in the univariate analysis. CRP was used instead of ESR in the multivariate model, as was measured in all patients. In the second column, certolizumab drug level is used as the dependant variable in the GEE model; in the fourth column, anticertolizumab antibodies are used as the dependant variable in the GEE model.
factor influencing certolizumab levels (although CIs were wide, as non-adherence was infrequently reported). A low certolizu-mab drug level in the absence of ADAb formation may prompt a discussion with the patient regarding reasons for non-adherence, also shown to be important in adalimumab-treated patients.9 While several TNFi therapeutic drug-monitoring
studies have used trough-level serum samples to measure both ADAbs and drug levels to reduce drug interference, ascertain-ment of random levels is clinically practical. We have previously demonstrated that low random TNFi drug levels in adalimumab-treated patients have been associated with poor treatment response in RA over 12 months.9However, a
limita-tion of our study is that, while 37% of patients had detectable ADAbs to certolizumab, this may under-represent the true value due to drug interference.
Whilst our study did not identify a clear drug concentration cut-off for treatment response in patients with non-trough samples, higher 6 months certolizumab levels (>23–24μg/mL) were associated with higher ΔDAS28. However, four patients who had an adequate response at 6 and 12 months had undetectable concentration levels, two of whom had ADAbs detected. These patients may represent a unique subset, in which certolizumab could be stopped, avoiding the need for future treatment with expensive biologics.
In summary, certolizumab drug levels may be useful in thera-peutic drug monitoring in combination with clinical parameter assessment. Measurement of ADAbs may facilitate the interpret-ation of low drug levels and provide valuable informinterpret-ation about future strategy. More information is required, however, on the cost-effectiveness of using these tests before implementation in clinical practice.
Author affiliations
1Arthritis Research UK Centre for Genetics and Genomics, Centre for Musculoskeletal
Research, Institute of Inflammation and Repair, University of Manchester, Manchester Academic Health Science Centre, Manchester, UK
2
Arthritis Research UK Centre for Epidemiology, Centre for Musculoskeletal Research, University of Manchester, Manchester, UK
3
Musculoskeletal Research Group, Institute of Cellular Medicine, Newcastle University and National Institute of Health Research Newcastle Biomedical Research Centre, Newcastle upon Tyne, UK
4Leeds Institute of Rheumatic and Musculoskeletal Medicine, University of Leeds and
National Institute of Health Research Leeds Musculoskeletal Biomedical Research Unit, Leeds Teaching Hospitals NHS Trust, Leeds, UK
5
University College of Dublin School of Medicine and Medical Science, Dublin, Ireland
6
National Institute of Health Research Manchester Musculoskeletal Biomedical Research Unit, Central Manchester Foundation Trust, Manchester Academic Health Science, Manchester, UK
Twitter Follow Meghna Jani at @MeghnaJani and Hector Chinoy at @drhectorchinoy
Acknowledgements We acknowledge the support from Sanquin Laboratories in The Netherlands for the analysis of antidrug antibodies for our samples using radioimmunoassay. We thank the Medical Research Council (grant number G1000417/94909), Arthritis Research UK for their support (grant reference 20385 and 20830) and the NIHR Manchester Musculoskeletal Biomedical Research Unit. This report includes independent research supported by the National Institute for Health Research Biomedical Research Unit Funding Scheme. The views expressed in this publication are those of the author(s) and not necessarily those of the NHS, the National Institute for Health Research or the Department of Health.
Collaborators BRAGGSS Collaborators: Prouse PJ, Moitra RK, Shawe DJ, Nisar M, Fairburn K, Nixon J, Barnes T, Hui M, Coady D, Wright D, Morley C, Raftery G, Bracewell C, Bridges M, Armstrong D, Chuck AJ, Hailwood S, Kumar N, Ashok D, Reece R, O’Reilly SC, Ding T, Badcock LJ, Deighton CM, Raj N, Regan MR, Summers GD, Williams RA, Lambert JR, Stevens R, Wilkinson C, Kelly CA, Hamilton J, Heycock CR, Saravanan V, Cope A, Garrood T, Ng N, Kirkham B, Green M, Gough A, Lawson C, Das D, Borbas E, Wazir T, Emery P, Bingham S, Morgan A, Bird HA, Conaghan PG, Pease CT, Wakefield RJ, Buch M, Bruce I, Barton A, Gorodkin R, Ho P, Hyrich KL, Parker B, Smith W, Jenkins E, Mukhtyar C, Gaffney K, Macgregor AJ, Marshall T,
Merry P, DeSilva C, Birrell FN, Crook PR, Szebenyi B, Bates D, James D, Gillott T, Alvi A, Grey C, Browning J, McHale JF, Gaywood IC, Jones AC, Lanyon P, Pande I, Doherty M, Gupta A, Courtney PA, Srikanth A, Abhishek A, Das L, Pattrick M, Snowden HN, Bowden AP, Smith EE, Klimiuk P, Speden DJ, Naz S, Ledingham JM, Hull RG, McCrae F, Cooper A, Young-Min SA, Wong E, Shaban R, Woolf AD, Davis M, Hutchinson D, Endean A, Mewar D, Tunn EJ, Nelson K, Kennedy TD, Dubois C, Pauling J, Korendowych E, Jenkinson T, Sengupta R, Bhalla A, McHugh N, Chinoy H, O’Neill T, Herrick AL, Jones AK, Cooper RG, Dixon WG, Harrison B, Buckley CD, Carruthers DC, Elamanchi R, Gordon PC, Grindulis KA, Khattak F, Raza K, Situnayake K, Akil M, Till S, Dunkley L, Tattersall R, Kilding R, Tait T, Maxwell J, Till S, Kuet K-P, Plant MJ, Clarke F, Fordham JN, Tuck S, Pathare SK, Paul A, Marguerie CP, Rigby SP, Dunn N, Abbas I, Filer C, Abernethy VE, Clewes AR, Dawson JK, Kitas G, Erb N, Klocke R, Whallett AJ, Douglas K, Pace A, Sandhu R, John H, Shand L, Lane S, Isaacs JD, Foster H, Griffiths B, Griffiths I, Kay L, Ng W-F, Platt PN, Walker DJ, Peterson P, Lorenzi A, Friswell M, Thompson B, Lee M, Pratt A, Hopkinson ND, Dunne CA, Quilty B, Marks J, Mukherjee S, Mulherin D, Chalam SV, Price T, Sheeran T, Venkatachalam S, Baskar S, Al-Allaf W, McKenna F, Shah P, Filer A, Bowman SJ, Jobanputra P, Rankin EC, Allen M, Chaudhuri K, Dubey S, Price-Forbes A, Ravindran J, Samanta A, Sheldon P, Hassan W, Francis J, Kinder A, Neame R, Moorthy A, Bukhari M, Ottewell L, Palkonyai E, Hider S, Hassell A, Menon A, Dowson C, Kamath S, Packham J, Dutta S, Price S, Roddy E, Paskins Z, O’Reilly DT, Rajagopal V, Bhagat S, Chattopadhyay CB, Green M, Quinn D, Isdale A, Brown A, Saleem B, Foo B, Al Saffar Z, Koduri G.
Contributors MJ, HC and AB were involved in the study conception, design and interpretation of results. The rest of the authors were involved in acquisition of data,final interpretation and review of manuscript. Funding for the study was provided by thefirst author’s MRC fellowship. AB is the principal investigator of BRAGGSS.
Funding MJ is supported by an NIHR clinical lectureship and was an MRC Clinical Training Fellow supported by the North West England Medical Research Council Fellowship Scheme in Clinical Pharmacology and Therapeutics, which is funded by the Medical Research Council (grant number G1000417/94909), ICON, GlaxoSmithKline, AstraZeneca and the Medical Evaluation Unit.
Competing interests MJ reports honoraria from UCB, Abbvie and Pfizer, outside the submitted work. JDI: advisory boards Pfizer, Roche, Abbvie, Janssen, Grants Roche, Pfizer, UCB. AWM has provided consultancy to GSK outside the submitted work. KLH reports honoraria from Abbvie and Pfizer outside of submitted work. HC has received honoraria, lecture fees and/or research grants from Abbvie, Janssen, MSD, Pfizer, UCB, Roche, Celgene and Servier, outside the submitted work. AB reports honoraria and/or grants from Pfizer, Abbvie, Eli-Lilly and Sanofi-Aventis outside the submitted work.
Ethics approval UK Multicentre Research Ethics Committee (COREC 04/Q1403/37). Provenance and peer reviewNot commissioned; externally peer reviewed. Open Access This is an Open Access article distributed in accordance with the terms of the Creative Commons Attribution (CC BY 4.0) license, which permits others to distribute, remix, adapt and build upon this work, for commercial use, provided the original work is properly cited. See: http://creativecommons.org/licenses/ by/4.0/
REFERENCES
1 Keystone E, Heijde Dv, Mason D,et al. Certolizumab pegol plus methotrexate is significantly more effective than placebo plus methotrexate in active rheumatoid arthritis:findings of afifty-two-week, phase III, multicenter, randomized, double-blind, placebo-controlled, parallel-group study.Arthritis Rheum 2008;58:3319–29.
2 Smolen J, Landewé RB, Mease P,et al. Efficacy and safety of certolizumab pegol plus methotrexate in active rheumatoid arthritis: the RAPID 2 study. A randomised controlled trial.Ann Rheum Dis2009;68:797–804.
3 Garcês S, Demengeot J, Benito-Garcia E. The immunogenicity of anti-TNF therapy in immune-mediated inflammatory diseases: a systematic review of the literature with a meta-analysis.Ann Rheum Dis2013;72:1947–55.
4 Vincent FB, Morand EF, Murphy K,et al. Antidrug antibodies (ADAb) to tumour necrosis factor (TNF)-specific neutralising agents in chronic inflammatory diseases: a real issue, a clinical perspective.Ann Rheum Dis2013;72:165–78.
5 Kneepkens EL, Plasencia C, Krieckaert CL,et al. Golimumab trough levels, antidrug antibodies and clinical response in patients with rheumatoid arthritis treated in daily clinical practice.Ann Rheum Dis2014;73:2217–9.
6 He XH, Shaw PC, Tam SC. Reducing the immunogenicity and improving the in vivo activity of trichosanthin by site-directed pegylation.Life Sci1999;65: 355–68.
8 Colombel JF, Sandborn WJ, Allez M,et al. Association between plasma concentrations of certolizumab pegol and endoscopic outcomes of patients with Crohn’s disease.Clin Gastroenterol Hepatol2014;12: 423–31.e1.
9 Jani M, Chinoy H, Warren RB,et al. Clinical utility of random anti-TNF drug level testing and measurement of anti-drug antibodies on long-term treatment response in rheumatoid arthritis.Arthritis Rheumatol2015;67:2011–19.
10 Arnett FC, Edworthy SM, Bloch DA,et al. The American Rheumatism Association 1987 revised criteria for the classification of rheumatoid arthritis.Arthritis Rheum 1988;31:315–24.
11 Bluett J, Morgan C, Thurston L,et al. Impact of inadequate adherence on response to subcutaneously administered anti-tumour necrosis factor drugs: results from the Biologics in Rheumatoid Arthritis Genetics and Genomics Study Syndicate cohort. Rheumatology (Oxford)2015;54:494–9.
12 van Gestel AM, Prevoo ML, van’t Hof MA,et al. Development and validation of the European League Against Rheumatism response criteria for rheumatoid arthritis. Comparison with the preliminary American College of Rheumatology and the World Health Organization/International League Against Rheumatism Criteria.Arthritis Rheum1996;39:34–40.
13 Pouw MF, Krieckaert CL, Nurmohamed MT,et al. Keyfindings towards optimising adalimumab treatment: the concentration-effect curve.Ann Rheum Dis 2015;74:513–8.
14 Rispens T, de Vrieze H, de Groot E,et al. Antibodies to constant domains of therapeutic monoclonal antibodies: anti-hinge antibodies in immunogenicity testing. J Immunol Methods2012;375:93–9.