Urinary Extracellular Domain of
Neurotrophin Receptor p75 as a
Biomarker for Amyotrophic Lateral
Sclerosis in a Chinese cohort
Rui Jia
1, Stephanie Shepheard
2, Jiaoting Jin
1, Fangfang Hu
1, Xing Zhao
1, Li Xue
3, Li Xiang
4,
Huaguang Qi
5, Qiumin Qu
1, Feng Guo
2, Mary-Louise Rogers
2& Jingxia Dang
1To comprehensively assess whether p75ECD in urine could be a candidate biomarker for ALS evaluation.
Urine samples were collected from 101 ALS patients, 108 patients with other neurological disease (OND) and 97 healthy controls. 61 ALS patients were followed up with clinical data including ALSFRS-r every 6 to 12 months, 23 ALS patients died and 17 ALS patients lost touch during follow up period. Enzyme-linked immunoassay was employed to determine urine p75ECD concentration. The ALSFRS-r
was employed to assess the severity of ALS. The concentration of p75ECD in ALS was significantly higher
than that of OND and CTRL (p < 0.001). Additionally, urine p75ECD concentrations in ALS-definite
grade patients were significantly higher than that in ALS-probable grade and ALS-possible grade patients (p < 0.001). Higher urine p75ECD concentrations were correlated with increased clinical stage
(p = 0.0309); urine p75ECD concentrations and ALSFRS-r were negatively correlated (p = 0.022); and
urine p75ECD concentration in the fast-progressing ALS group was significantly higher than that in
slow-progression (p = 0.0026). Our finding indicates that urine p75ECD concentration provides additional
evidence for patients with clinically suspected ALS, and can be employed to evaluate ALS-severity.
Amyotrophic lateral sclerosis (ALS) is a rapidly progressive, fatal neurodegenerative disorder affecting upper (UMN) and lower (LMN) motor neurons in the brain and spinal cord1, which usually causes death due to
res-piratory muscle paralysis within 3 years of onset2. Whilst the prevalence and incidence of ALS is anecdotally
similar across countries, it is not fully described in China3. However, a recent study concluded China is predicted
to have similar incidence and prevalence to the western world, and the number of individuals with ALS will grow significantly in China between 2015 and 20404. ALS diagnosis is usually based on clinical assessment and
electrophysiological examination5, and there may be a pronounced delay between the onset of symptoms and
diagnosis6. ALS progression is assessed in the clinic by the revised ALS functional rating scale (ALSFRS-r)7. This
is based on a patient questionnaire. However, additional objective biomarkers that can supplement neurological data may improve discrimination of ALS patients from other probable diseases and help to evaluate progression. Since there are no effective treatments for ALS, biomarkers that can change with disease (progression) and improve stratification of trials by reflecting disease severity (i.e. are prognostic), are useful in clinical trials of ALS treatments8. Neurofilaments (heavy and light chains) in blood and CSF have shown potential as prognostic
biomarkers9–11. Notably, we have recently shown that the extracellular domain of the common neurotrophin
receptor p75 (p75ECD) has potential as a progression and prognostic marker for ALS12. Urinary p75ECD is the first fluid based ALS biomarker of disease progression.
We firstly showed urinary p75ECD was higher in ALS than healthy controls and other disease (Parkinson’s and Multiple Sclerosis)13. In a follow up study that encompassed samples from Australia and the USA, urinary p75ECD was again shown to be higher in ALS (n = 54 patients) than controls (n = 45). Notably, urinary p75ECD increased
1Department of Neurology, The First Affiliated Hospital of Xi’an Jiaotong University, 277 Western Yanta Rd, Xi’an,
710061, China. 2Department of Human Physiology and Centre for Neuroscience, Flinders University, Adelaide, South
Australia, Australia. 3Department of Laboratory, The Second Affiliated Hospital of Xi’an Jiaotong University, 157 Xiwu
Rd, Xi’an, China. 4EMG Lab, The Second Affiliated Hospital of Xi’an Jiaotong University, Xi’an, P.R. China. 5EMG Lab,
Xi’an Red Cross Hospital, 555 East of Youyi Rd, Xi’an, China. Correspondence and requests for materials should be addressed to M.-L.R. (email: mary-louise.rogers@flinders.edu.au) or J.D. (email: jxdang2000@126.com)
Received: 21 February 2017 Accepted: 30 May 2017 Published: xx xx xxxx
www.nature.com/scientificreports/
over time with disease progression in 31 ALS patients, sampled a median of 2 time points over 2–3 years12. In
addition, we showed in cross-sectional data it had prognostic value, over and above for example site of onset. We now wish to validate our finding that p75ECD is a potential biomarker of ALS and disease severity-evaluation, in, a larger Chinese cohort.
Results
Participant Characteristics.
Urine samples were collected from three groups: 101 people with ALS, 108 people with OND and 97 CTRL. There were 61 ALS patients assessed by ALSFRS-r every 6 to 12 months, 23 ALS patients died during the follow up and 17 ALS patients lost follow up. The demographic characteristics of the three groups are shown in Table 1.Urine p75
ECDconcentrations in ALS patients.
The urine p75ECD concentrations in (n = 101) patients with ALS (11.36 ± 5.83 ng p75ECD/mg creatinine) was significantly higher than that of OND (stroke, Parkinson’s and Multiple Sclerosis) (3.06 ± 2.95 ng p75ECD/mg creatinine) and CTRL (2.49 ± 2.07 ng p75ECD/mg creatinine, p < 0.001), as shown in Fig. 1A. Additionally, the urine p75ECD concentration in patients with an onset-time less than 6 months (10.59 ± 6.11 ng p75ECD/mg creatinine, n = 25) was significantly higher than that of OND and CTRL (p < 0.001, Fig. 1B).We further divided the ALS group into three diagnostic grades: clinically definite (n = 70), clinically probable (n = 20) and clinically possible grade (n = 11), based on the revised El Escorial criteria14. The p75ECD concentra-tion in clinically definite grade patients (13.27 ± 5.64 ng p75ECD/mg creatinine) was significantly higher than that in clinically probable grade (7.99 ± 3.13 ng p75ECD/mg creatinine) and clinically possible grade (5.32 ± 3.61 ng p75ECD/mg creatinine, p < 0.001) by one way ANOVA. The LSD test showed that the urine p75ECD concen-trations of the three ALS diagnostic grade were significantly higher than that of OND or CTRL, respectively (ALS- Definite VS OND, p < 0.001; ALS- Definite VS CTRL, p < 0.001; ALS- Probable VS OND, p < 0.001; ALS- Probable VS CTRL, p < 0.001; ALS- Possible VS OND, P = 0.047; ALS- Possible VS CTRL, p = 0.013; Fig. 1C). It should also be noted that there was no obvious difference in p75ECD levels between OND and CTRL groups (p > 0.05; Fig. 1C).
Urine p75
ECDconcentrations and diagnostic Level.
In order to evaluate urine p75ECD concentrations among the different diagnostic levels, receiver operating characteristic (ROC) curves were generated from ALS VS CTRL and OND data, respectively. Urine p75ECD concentrations can distinguish ALS patients from OND, with sensitivity of 86.1%, specificity of 89.8%, and area under the curve (AUC) of 0.923 (95% confidence limits of area 0.888–0.959; Fig. 2A), so does CTRL, with sensitivity of 90.1%, specificity of 92.8%, and AUC of 0.955 (95% confidence limits of area 0.927–0.983; Fig. 2B).The ability to use p75ECD to identify ALS-definite patients (onset less than 6 months) from OND, was deter-mined using ROC analysis (Fig. 2C), showing 7.2015 (ng p75ECD/mg creatinine) as the cuf-off value; sensitivity of 90.9%; specificity of 90.7%; AUC of 0.971 (95% confidence limits of area 0.941–1.000, p < 0.001). Meanwhile, using urine p75ECD concentrations to distinguish ALS-definite patients less than 6 months from CTRL, showed 6.827 (ng p75ECD/mg creatinine) as the cut-off value; sensitivity: 100%, specificity: 95.9%, and AUC: 0.990 (95% confidence limits of area 0.975–1.000, p < 0.001; Fig. 2D).
ALS-probable patients were also distinguishable from OND/CTRL with a sensitivity of 80.0%/85.0%, spec-ificity of 89.8%/92.8%, and AUC 0.886/0.935 respectively (ROC analysis, Fig. 3A,B). The ROC also showed that ALS-possible patients were distinguished from OND/CTRL with sensitivity of 81.8%/72.7%, specificity of 60.2%/82.5%, and AUC 0.734/0.795 respectively (Fig. 3C,D).
Urine p75
ECDconcentrations with clinical stage.
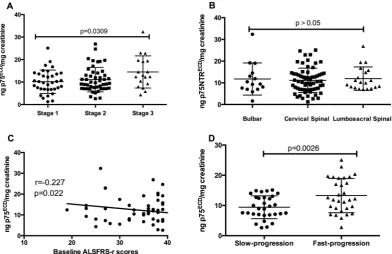
Using the King’s College clinical stage for ALS15, wehave divided patients into stage 1, stage 2 and stage 3. Stage 1 is the ALS patients involved one region, stage 2 is involved two regions, stage 3 is involved three regions, stage 4 is when gastrostomy or non-invasive ventilation is required, stage 5 is death. We then analyzed urine p75ECD in different stages, and it showed a significant increase level from 1–3 (p = 0.0309; Fig. 4A). Urine p75ECD concentration was 10.15 ± 5.17 ng p75ECD/mg creatinine in stage 1(n = 35), stage 2(n = 48) was 11.07 ± 5.43 ng p75ECD/mg creatinine and stage 3(n = 18) was 14.49 ± 7.13 ng p75ECD/mg creatinine. There were no ALS patients reached stage 4 or 5 at the baseline. Urine p75ECD concentra-tions did not differ between patients with different onset sites. Patients with lumbosacral spinal cord vs bulbar, or
Variable ALS OND CTRL
Age at diagnosis (Mean ± SD) 54.78 ± 10.61a 55.95 ± 13.19a 56.81 ± 11.98a
Gender (M/F) 57/44b 60/48b 56/41b
Bulbar onset (%) 16 patients (15.84) — — Months from onset to diagnosis (Mean ± SD) 15.3 ± 12.85 — — ALSFRS-r at baseline 38.50 ± 6.41 — — ALSFRS-r at last follow up 29.64 ± 9.00
Death by end of study 23 patients — — Months from diagnosis to death (Mean ± SD) 10.1 ± 4.38 — —
[image:2.595.166.445.46.151.2]lumbosacral spinal cord vs cervical spinal cord, or cervical spinal cord vs bulbar onset disease were not signifi-cantly different (Bulbar: 11.75 ± 7.41 ng p75ECD/mg creatinine, n = 15; cervical spinal cord: 11.10 ± 5.63 ng p75ECD/ mg creatinine, n = 66; lumbosacral spinal cord: 11.92 ± 5.39 ng p75ECD/mg creatinine, n = 20; p > 0.05; Fig. 4B).
Association of urine p75
ECDconcentration with progression rate.
There was a negativecorrela-tion between urine p75ECD concentration and ALSFRS-r scores in ALS patients at first collection (r =−0.227, p = 0.022; Fig. 4C, n = 101).
All ALS patients were given follow up visits during the research, and 61 of 101 ALS patients were assessed by ALSFRS-r every 6 to 12 months. The progression rate (Δr) was calculated as the monthly ALSFRS-r score slope in the time interval between the time of sampling and the last follow-up visit16. According to the median progression
rate of 0.6710, all ALS patients were divided into two groups: fast-progression (Δr > 0.67, 13.28 ± 1.035 ng p75ECD/ mg creatinine, n = 30), and slow-progression (Δr ≤ 0.67, 9.410 ± 0.6804 ng p75ECD/mg creatinine, n = 31). It was found that, urine p75ECD concentrations in the fast-progression group were significantly higher than that in slow-progression (p = 0.0026; Fig. 4D).
Discussion
This study supports urinary p75ECD as a biomarker for people with ALS. In our previous studies, urine p75ECD concentrations were significantly higher in ALS patients than normal controls12 and patients with PD or MS13.
Our current study confirms this finding, but in a Chinese cohort. Interestingly, Chinese ALS patients have a higher baseline level of p75ECD when compared to Australian/USA patients (11.36 ± 5.83 versus 5.6 ± 2.2)12.
Healthy controls in the Chinese cohort (2.49 ± 2.07) had similar levels to Australian/USA patients (3.6 ± 1.4). There is little literature on differences between Chinese and other racial groups as to disease severity at onset and should be investigated further.
Our data indicates that urinary p75ECD may add value to diagnostic evidence for the patients with clinically suspected ALS. In addition, urinary p75ECD concentration increases with diagnostic grades of ALS indicating urinary p75ECD may be increasing with amount of lesion sites and the severity. Further, there was a negative corre-lation between baseline ALSFRS-r and urinary p75ECD. This goes somewhat to validating our previous work that showed urinary p75ECD is a marker of severity12.
[image:3.595.161.546.49.368.2]www.nature.com/scientificreports/
Our results also indicate a significant elevation in p75ECD concentrations in ALS patients compared to those with stroke, Parkinson’s and multiple sclerosis. Previously we showed Parkinson’s and multiple sclerosis (as other neurological diseases) was elevated, but not significantly higher than controls or ALS patients13. In this current
study, ROC analysis showed some discrimination of ALS from OND. However, it should be noted that we will in future work address specificity by examining other related conditions such as FTD, and mimics’ such as neurop-athy, Kennedy’s syndrome and primary lateral sclerosis. We do not expect elevated urinary p75ECD to be highly specific for ALS. p75ECD is well known to be elevated in nerve injury17. We and others have previously shown
p75ECD is up-regulated on motor neurons in MND mice models18, 19, and in ALS13, 20. Since we wish to develop
this biomarker as a progression marker that can be of use in clinical trials, specificity is not an absolute require-ment. For example, elevation in CSF and blood neurofilament heavy (NFH) and light chains (NfL) is not specific to ALS, yet they are well developed as prognostic biomarkers for ALS. Further, NfL levels in blood and CSF, are largely stable over time for periods of up to 15-months of follow-up21. A recent larger study of ALS patients
con-firmed NfL in CSF is a useful prognostic biomarker, and for example may help define subgroups, as it is higher in frontal-temporal dementia22. Hence, even if urinary p75ECD is raised in other diseases, we suggest it is a valid biomarker for ALS, notably for clinical trials of treatments.
Due to its convenience to obtain, urinary biomarkers have advantages over for example CSF. Most ALS patients are willing to provide urine, but not all CSF, it is thus an easily accessible biomarker source23. ELISA
assays for fluid based biomarkers can also be cost effective when compared to imaging biomarker; an important point to consider in some areas in the world.
[image:4.595.157.551.42.444.2]We found urinary p75ECD levels in a fast-progressing ALS group were significantly higher than that in a slow-progression group and there was a negative correlation between p75ECD and ALSFRS-r scores in ALS patients. This suggests that the p75ECD levels in ALS patients could be employed to reflect the disease process and point towards fast progression rates. This again suggests that urinary p75ECD is a marker of disease progression in ALS and agrees with our previous study12. Hence this validates this marker to be investigated as a
pharmacody-namic marker to test the effectiveness of therapies in clinical trials.
Our study is not without its drawbacks. Most notably, the study population in China may not be as defined as in other reported studies. Moreover, the limited number of samples and assessments available from each patient precluded measuring p75ECD in consecutive samples and progression rate (as we have done previously). These shortcomings, are being addressed in an on going study.
In conclusion, we provide further evidence that urinary p75ECD concentration could be used as biomarker for ALS. We found that urinary p75ECD concentration reflects ALS severity, and supplies additional evidence for patients with clinically suspected ALS. The easily accessible, non-invasive characteristics make urine highly practical as a biomarker tool. Further studies on the comparison of urine p75ECD for ALS and other ALS-similar diseases should be employed to verify the validity for ALS diagnosis, as well as the change of urine p75ECD in the longitudinal follow-up.
[image:5.595.156.556.45.448.2]www.nature.com/scientificreports/
Materials and Methods
Participants and samples collection.
Participants were divided into three groups: the ALS group (ALS), other neurological disorders group (OND) and normal control group (CTRL), which were age and gender matched. Urine samples from ALS patients were collected at first diagnosis in the Neurology Department of the First Affiliated Hospital of Xi’an Jiaotong University, the Second Affiliated Hospital of Xi’an Jiaotong University, and Xi’an Red Cross Hospital from July 2014 to October 2015; all ALS patients were followed up with clinical data including ALSFRS-r every 6 to 12 months. ALS patients were strictly diagnosed by at least two experienced neurologists according to the revised El Escorial criteria, and further divided into three diagnostic grades: clini-cally definite, defined on clinical evidence alone by the presence of UMN and LMN signs in at least three regions; clinically probable, the presence of UMN and LMN signs in at least two regions with some UMN signs necessarily rostral to (above) the LMN signs; clinically possible, clinical signs of UMN and LMN dysfunction are found together in only one region or UMN signs are found alone in two or more regions, or LMN signs are found ros-tral to UMN signs14. The clinical stages of ALS patients were based on the King’s College clinical stage for ALS15.p75ECD is expressed in both nervous tissues and cancerous tissues24, so in the ALS group, there were no evidence
of cancer, their medical history and the results of electromyography were recorded in detail. The progression rate (Δr) was calculated as the monthly ALSFRS-r score slope in the time interval between the time of sampling and the last follow-up visit16. The OND group consisted of patients with common neurological diseases in which the
concentration of p75ECD was unknown - acute ischemic/hemorrhage stroke (confirmed by CT/MRI scans within one week from the symptom onset), Parkinson’s Disease (PD; based on the UK Parkinson’s Disease Society Brain Bank25 criteria), or Multiple Sclerosis (MS; according to the revised McDonald diagnostic criteria26) The
partic-ipants in the CTRL group were from healthy volunteers without nervous system diseases. Urine samples from all participants were collected according to the Urine and Kidney Proteome Project Standards27. This study was
evaluated and approved by the Ethics Committee of the First Affiliated Hospital of Xi’an Jiaotong University, with signed informed consent provided by all participants.
Measurement of p75
ECDin Urine by ELISA.
Each urine sample was tested in triplicate to quantify p75ECD by sandwich ELISA. Anti-p75ECD MLR127 antibody for coating ELISA plates was provided by Flinders University.In our experiments, Anti-p75ECD MLR1 (4 μg/ml, 100 μl/well) in coating buffer (25 mM Na
[image:6.595.158.551.46.300.2]the detecting antibody for one hour at room temperature with gentle agitation. TMB (Life technologies, 00-2023) was used for the peroxidase reaction for 15 minutes, then 2 M sulphuric acid was added to stop the colour reac-tion. Absorbance values were read at 450 nm using a 96-well microplate reader (Thermo Systems, Boston, MA, USA). Wash buffer (5% 20xPBS, 0.05% Tween-20, pH 7.4) was used to wash 96-wells for four washes between steps. Urinary creatinine was measured by Department of Laboratory in the Second Affiliated Hospital of Xi’an Jiaotong University using enzymatic analysis.
Statistical analysis.
Urine p75ECD levels among different groups was analyzed by one-way ANOVA after Bonferroni’s multiple comparison in Prism 5. The difference in p75ECD concentration in urine among three ALS diagnosis grades and CTRL was analyzed by rank test. The sensitivity and specificity of the diagnosis for ALS were tested using Receiver Operating Characteristic (ROC) curve analysis using SPSS, and the Youden Index was used to calculate cut-off levels for ALS.References
1. Rowland, L. P. & Shneider, N. A. Amyotrophic Lateral Sclerosis. N Engl J. Med. 344, 1688–1700 (2001).
2. Bourke, S. C. et al. Effects of Non-Invasive Ventilation on Survival and Quality of Life in Patients with Amyotrophic Lateral Sclerosis: A Randomised Controlled Trial. Lancet Neurol. 5, 140–147 (2006).
3. Chiò, A. et al. Global Epidemiology of Amyotrophic Lateral Sclerosis: A Systematic Review of the Published Literature.
Neuroepidemiology. 41(2), 118–30 (2013).
4. Arthur, K. C. et al. Projected increase in amyotrophic lateral sclerosis from 2015 to 2040. Nat Commun. 7, 12408 (2016).
5. Mitchell, J. D. et al. Timelines in the diagnostic evaluation of people with suspected amyotrophic lateral sclerosis (ALS)/motor neuron disease (MND) - a 20-year review: Can we do better? Amyotroph Lateral Scler. 11, 537–541 (2010).
6. Paganoni, S. et al. Diagnostic timelines and delays in diagnosing amyotrophic lateral sclerosis (ALS). Amyotroph Lateral Scler. 15, 453–456 (2014).
7. Kaufmann, P. et al. The ALSFRS-r predicts survival time in an ALS clinic population. Neurology. 64, 38–43 (2005).
8. von Neuhoff, N. et al. Monitoring CSF Proteome Alterations in Amyotrophic Lateral Sclerosis: Obstacles and Perspectives in Translating a Novel Marker Panel to the Clinic. PLoS ONE. 7, 1–12 (2012).
9. Tarasiuk, J., Kułakowska, A., Drozdowski, W., Kornhuber, J. & Lewczuk, P. CSF markers in amyotrophic lateral sclerosis. J. Neural Transm. 119, 747–757 (2012).
10. Tortelli, R. et al. Elevated cerebrospinal fluid neurofilament light levels in patients with amyotrophic lateral sclerosis: a possible marker of disease severity and progression. Eur J. Neurol. 19, 1561–1567 (2012).
11. Xu, Z., Henderson, R. D., David, M. & McCombe, P. A. Neurofilaments as biomarkers for Amyotrophic Lateral Sclerosis: A Systematic Review and Meta-Analysis. PLoS ONE. 11, e0164625 (2016).
12. Shepheard, S. R. et al. Urinary p75ECD: A prognostic, disease progression, and pharmacodynamic biomarker in ALS. Neurology.
88(12), 1137–43 (2017).
13. Shepheard, S. R., Chataway, T., Schultz, D. W., Rush, R. A. & Rogers, M. L. The extracellular domain of neurotrophin receptor p75 as a candidate biomarker for amyotrophic lateral sclerosis. PLoS ONE. 9, e87398 (2014).
14. Brooks, B. R., Miller, R. G., Swash, M. & Munsat, T. L. El Escorial revisited: revised criteria for the diagnosis of amyotrophic lateral sclerosis. Amyotroph Lateral Scler Other Motor Neuron Disord. 1, 293–299 (2000).
15. Balendra, R. et al. Use of clinical staging in amyotrophic lateral sclerosis for phase 3 clinical trials. JNNP. 86(1), 45 (2015). 16. Fabiola, P. et al. Immune reactivity to neurofilament proteins in the clinical staging of amyotrophic lateral sclerosis. JNNP. 85(3),
274–278 (2013).
17. Ibanez, C. F. & Simi, A. p75 neurotrophin receptor signaling in nervous system injury and degeneration: paradox and opportunity.
Trends Neurosci. 35(7), 431–440 (2012).
18. Smith, K. S., Rush, R. A. & Rogers, M. L. Characterization and changes in neurotrophin receptor p75-expressing motor neurons in SOD1(G93A) G1H mice. J. Comp Neurol. 523, 1664–1682 (2015).
19. Copray, J. C. et al. Expression of the low affinity neurotrophin receptor p75 in spinal motoneurons in a transgenic mouse model for amyotrophic lateral sclerosis. Neuroscience. 116(3), 685–694 (2003).
20. Seeburger, J. L., Tarras, S., Natter, H. & Springer, J. E. Spinal cord motoneurons express p75NGFR and p145trkB mRNA in amyotrophic lateral sclerosis. Brain Res. 621, 111–115 (1993).
21. Lu, C. H. et al. Neurofilament light chain: A prognostic biomarker in amyotrophic lateral sclerosis. Neurology. 84(22), 2247–2257 (2015). 22. Gaiani, A. et al. Diagnostic and Prognostic Biomarkers in Amyotrophic Lateral Sclerosis: Neurofilament Light Chain Levels in
Definite Subtypes of Disease. JAMA Neurol. 74(5), 525–532 (2017).
23. Benatar, M. et al. ALS biomarkers for therapy development: State of the field and future directions. Muscle Nerve. 53(2), 169–82 (2016). 24. Verbeke, S. et al. Overexpression of p75(NTR) increases survival of breast cancer cells through p21(waf1). Cell Signal. 22, 1864–1873 (2010). 25. Hughes, A. J., Daniel, S. E., Kilford, L. & Lees, A. J. Accuracy of clinical diagnosis of idiopathic Parkinson’s disease: a
clinico-pathological study of 100 cases. J. Neurol Neurosurg Psychiatry. 55, 181–184 (1992).
26. Polman, C. H. et al. Diagnostic criteria for multiple sclerosis: 2010 revisions to the McDonald criteria. Ann of Neurol 69, 292–302 (2011). 27. Yamamoto, T. The 4th Human Kidney and Urine Proteome Project (HKUPP) workshop. 26 September 2009, Toronto, Canada.
Proteomics. 10, 2069–2070 (2010).
Acknowledgements
We thank all the participants for participating in this research and providing all the needed information. Our study is supported by the Shaanxi Science and Technology Program (2014K11-02-01-04), the International Scientific and Technological Cooperation Program in Shaanxi Province (2015KW-051) and the Scientific Program of the First Affiliated Hospital of Xi’an Jiaotong University(2014YK32).
Author Contributions
www.nature.com/scientificreports/
Additional Information
Competing Interests: The authors declare that they have no competing interests.
Publisher's note: Springer Nature remains neutral with regard to jurisdictional claims in published maps and institutional affiliations.
Open Access This article is licensed under a Creative Commons Attribution 4.0 International License, which permits use, sharing, adaptation, distribution and reproduction in any medium or format, as long as you give appropriate credit to the original author(s) and the source, provide a link to the Cre-ative Commons license, and indicate if changes were made. The images or other third party material in this article are included in the article’s Creative Commons license, unless indicated otherwise in a credit line to the material. If material is not included in the article’s Creative Commons license and your intended use is not per-mitted by statutory regulation or exceeds the perper-mitted use, you will need to obtain permission directly from the copyright holder. To view a copy of this license, visit http://creativecommons.org/licenses/by/4.0/.