This is a repository copy of
On the Security Cost of Using a Free and Open Source
Component in a Proprietary Product
.
White Rose Research Online URL for this paper:
http://eprints.whiterose.ac.uk/95555/
Version: Accepted Version
Proceedings Paper:
Dashevskyi, S., Brucker, A.D. and Massacci, F. (2016) On the Security Cost of Using a
Free and Open Source Component in a Proprietary Product. In: Caballero, J., Bodden, E.
and Athanasopoulos, E., (eds.) Engineering Secure Software and Systems. ESSoS, 06-08
Apr 2016, London, UK. Lecture Notes in Computer Science (9639 ). Springer Verlag
(Germany) , pp. 190-206. ISBN 978-3-642-11746-6
https://doi.org/10.1007/978-3-319-30806-7_12
[email protected] https://eprints.whiterose.ac.uk/ Reuse
Unless indicated otherwise, fulltext items are protected by copyright with all rights reserved. The copyright exception in section 29 of the Copyright, Designs and Patents Act 1988 allows the making of a single copy solely for the purpose of non-commercial research or private study within the limits of fair dealing. The publisher or other rights-holder may allow further reproduction and re-use of this version - refer to the White Rose Research Online record for this item. Where records identify the publisher as the copyright holder, users can verify any specific terms of use on the publisher’s website.
Takedown
If you consider content in White Rose Research Online to be in breach of UK law, please notify us by
J. Caballero et al. (Eds.): ESSoS 2016, LNCS 9639, pp. 1–17, 2016. c
2016 Springer-Verlag. This is the author’s version of the work. It is posted athttp: //www.brucker.ch/bibliography/abstract/dashevskyi.ea-foss-costs-2016by permission of Springer-Verlag for your personal use. The definitive version was published with doi: 10.1007/978-3-319-30806-7_12.
Source Component in a Proprietary Product
Stanislav Dashevskyi1,3, Achim D. Brucker2,3⋆, Fabio Massacci1
1
University of Trento, Italy
{name.surname}@unitn.it
2
Department of Computer Science, The University of Sheffield, Sheffield, UK
3
SAP SE, Germany
Abstract. The work presented in this paper is motivated by the need to
estimate the security effort of consuming Free and Open Source Software (FOSS) components within a proprietary software supply chain of a large European software vendor. To this extent we have identified three differ-ent cost models: cdiffer-entralized (the company checks each compondiffer-ent and propagates changes to the different product groups), distributed (each product group is in charge of evaluating and fixing its consumed FOSS components), and hybrid (only the least used components are checked in-dividually by each development team). We investigated publicly available factors (e. g., development activity such as commits, code size, or fraction of code size in different programming languages) to identify which one has the major impact on the security effort of using a FOSS component in a larger software product.
Keywords:Free and Open Source Software usage, Free and Open Source
Software vulnerabilities, security maintenance costs.
1
Introduction
Whether Free and Open Source Software (FOSS) is more or less secure than proprietary software is a heavily debated question [8,9,22].
We argue that, at least from the view of a software vendor who is consuming FOSS, this question is not the right question to ask. First, there may be just no alternative to use FOSS components in a software supply chain, because FOSS components are the de-facto standard (e. g., Hadoop for big data). Second, FOSS may offer functionalities that are very expensive to re-implement and, thus, using FOSS is the most economical choice.
A more interesting question to ask is which factors are likely to impact the “security effort” of a selected FOSS component.
As the security of a software offering depends on all components, FOSS should, security-wise, be treated as one’s own code. Therefore, software compa-nies that wish to integrate FOSS into their products must tackle two challenges:
⋆Parts of this research were done while the author was a Security Testing Strategist
the selection of a FOSS product and its maintenance. In order to meet the FOSS selection challenge, large business software vendors perform a thorough security assessment of FOSS components that are about to be integrated in their prod-ucts by running static code analysis tools to verify the combined code base of a proprietary application and a FOSS component in question, and by performing a thorough audit of the results. The security maintenance problem is not easier: when a new security issue in a FOSS component becomes publicly known, a business software vendor has to verify whether that issue affects customers who consume software solutions where that particular FOSS component was shipped by the vendor. In ERP systems and industrial control systems this event may occur years after deployment of the selected FOSS product.
Addressing either problem requires expertise about both the FOSS compo-nent and software security. This combination is usually hard to find and resources must be allocated to fix the problem in a potentially unsupported product. It is therefore important to understand which characteristics of a FOSS component (number of contributors, popularity, lines of code or choice of programming lan-guage, etc.) are likely to be a source of “troubles”. The number of vulnerabilities of a FOSS product is only a part of a trouble: a component may be used by hundreds of products.
Motivated by the need to estimate the efforts and risks of consuming FOSS components for proprietary software products of a large European software ven-dor – SAP SE, we investigate the factors impacting three different cost models: 1. Thecentralized model, where vulnerabilities of a FOSS component are fixed centrally and then pushed to all consuming products (and therefore costs scale sub-linearly in the number of products)
2. Thedistributed model, where each development team fixes its own component and effort scales linearly with usage
3. Thehybrid model, where only the least used FOSS components are selected and maintained by individual development team
In the rest of the paper we describe the FOSS consumption in SAP (§2), introduce our research question and the three security effort models (§3), and discuss related works (§4). Then we present the data sources used for analyzing the impact factors (§5), describe each variable in detail and discuss the expected relationships between them (§6). Next we (§7) discuss the statistical analysis of the data. Finally we conclude and outline future work (§8).
2
FOSS Consumption at SAP
SAP’s product portfolio ranges from small (mobile) applications to large scale ERP solutions that are offered to customers on-premise as well as cloud solutions. This wide range of options requires both flexibility and empowerment of the (worldwide distributed) development teams to choose the software development model that fits their needs best while still providing secure software.
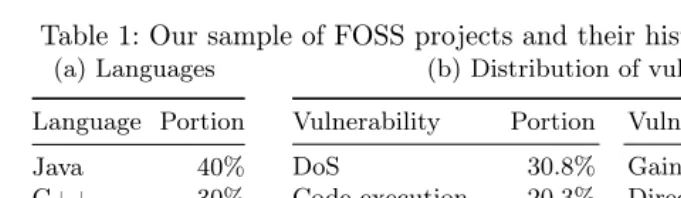
Table 1: Our sample of FOSS projects and their historical vulnerability data
(a) Languages
Language Portion Java 40%
C++ 30%
PHP 13%
C 10%
JavaScript 5% Other 1%
(b) Distribution of vulnerability types
Vulnerability Portion Vulnerability Portion DoS 30.8% Gain Privileges 3.1% Code execution 20.3% Directory Traversal 2.4% Overflow 16.6% Memory Corruption 2.2% Bypass Something 10.3% CSRF 0.9% Gain Information 7.1% HTTP response splitting 0.3% XSS 5.9% SQL injection 0.1%
the traditional SAP systems in ABAP usually do not contain a lot of FOSS components; the situation is quite the opposite for recent cloud offerings based on OpenStack (http://www.openstack.com) or Cloud Foundry (https://www. cloudfoundry.org/).
For each vulnerability that is published for a consumed FOSS component, an assessment is done to understand whether the vulnerability makes the consuming SAP product insecure. In this case, a fix needs to be developed and shipped to SAP customers. For example, in 2015 a significant number of SAP Security Notes (i. e., patches) fixed vulnerabilities in consumed FOSS components.
Overall, this results in additional effort both for the development teams as well as the teams that work on the incident handling (reports from customers). Thus, there is a need for approaches that support SAP’s development teams in estimating the effort related to maintain the consumed FOSS components.
To minimize the effort associated with integrating FOSS components as well as to maximize the usability of the developed product, product teams consider different factors. Not all of them are related to security: e. g., the compatibility of the license as well as requests from customers play an important role as well. From a effort and security perspective, developer teams currently consider:
– How widely a component is used within SAP? Already used components require lower effort as licensing checks are already done and internal expertise can be tapped. Thus, effort for fixing issues or integrating new versions can be shared across multiple development teams.
– Which programming languages and build systems are used? If a development team has already expertise in them, a lower integration and support effort can be expected.
– What maintenance lifecycle is used by the FOSS components? If the secu-rity maintenance provided by the FOSS community “outlives” the planned maintenance lifecycle of the consuming SAP product, only the integration of minor releases in SAP releases would be necessary.
Table 1 illustrates the characteristics of a selection of FOSS components used within SAP. We have chosen the most popular 166 components used by at least 5 products.
3
Research Question and Cost Models
Considering the above discussion we can summarize our research question:
RQ Which factors have significant impact on the security effort to manage a FOSS component in centralized, distributed, and hybrid cost models? A key question is to understand how to capture effort in broad terms. In this respect, there are three critical activities that are generated by using FOSS components in a commercial software company [29,26] and specifically at SAP: the analysis of the licenses, security analysis, and maintenance. Licensing is out of scope for this work, and we focus on the other two stages.
In the previous section we have already sketched some of the activities that the security team must perform in both stages. A development team can be as-signed to a maintenance which includes several tasks, security maintenance being only one of them. Therefore, it is close to impossible to get analytical account-ing for security maintenance to the level of individual vulnerabilities. Further, when a FOSS component is shared across different consuming applications, each development team can differ significantly in the choice of the solution and hence in the effort to implement it.
Therefore, we need to find a proxy for the analysis of our three organizational models. Preliminary discussion with developers and company’s researchers sug-gested the combination of vulnerabilities of the FOSS component itself and the number of company’s products using it. A large number of vulnerabilities may be the sign of either a sloppy process or a significant attention by hackers and may warrant a deeper analysis during the selection phase or a significant response during the maintenance phase. This effort is amplified when several development teams are asking to use the FOSS component as a vulnerability which eschewed detection may impact several hundred products and may lead to several security patches for different products.
We assume that the effort structure has the following form
e=efixed+
m X
i=1
ei (1)
whereei is a variable effort that depends on thei-th FOSS component, and
efixedis a fixed effort that depends on the security maintenance model (e. g., the
Let |vulnsi| be the number of vulnerabilities that have been cumulatively fixed for thei-th FOSS component and let|productsi| be the number of propri-etary products that use the component:
1. In the centralized model a security fix for all instances of a FOSS com-ponent is issued once by the security team of the company and then dis-tributed between all products that are using it. This may happen when, as a part of FOSS selection process, development teams must choose only com-ponents that have been already used by other teams and are supported by the company. To reflect this case the effort for security maintenance scales logarithmically with the number of products using a FOSS component.
ei∝log(|vulnsi| ∗ |productsi|) (2)
2. Thedistributed modelcovers the case when security fixes are not central-ized within a company, so each development team has to take care of security issues in FOSS components that they use. In this scenario the effort for se-curity maintenance increases linearly with the number of products using a FOSS component.
ei∝ |vulnsi| ∗ |productsi| (3)
3. The hybrid model combines the two previous models: security issues in the least consumed FOSS components (e. g., used only by lowest quartile of products consuming FOSS) are not fixed centrally. After this threshold is reached and some effort linearly proportional to the threshold of products to be considered has been invested, the company fixes them centrally, pushing the changes to the remaining products.
ei∝
|vulnsi| ∗ |productsi| if|productsi| ≤p0
p0∗ |vulnsi|+ log(|vulnsi| ∗(|productsi| −p0)) otherwise
(4)
As shown in Figure 1, the hybrid model is a combination of the distributed model and centralized model, when centralization has a steeper initial cost. The pointV0is the switching point where the company is indifferent between the
cen-tralized and distributed cost models. The hybrid model captures the possibility of a company to switch models after (or before) the indifference point. The fixed effort of the centralized model is obviously higher than the one of a distributed model (e. g., setting up a centralized vulnerability fixing team, establishing and communicating a fixing process, etc.).
Hence, we extend the initial function after the threshold number of products
p0 is reached so that only a logarithmic effort is paid on the remaining
prod-ucts. This has the advantage of making the effort ei continuous in |productsi|. An alternative would be to make the cost logarithmic in the overall number of products after |productsi| > p0. This would create a sharp drop in the effort
for the security analysis of FOSS components used by several products after p0
Number of products Effort
hybrid model distributed
model centralized
model
V0
[image:7.612.112.319.54.153.2]initial effort (β0)
Fig. 1: Illustration of the three cost models
theory. In the sequel, we have used forp0the lowest quartile of the distribution
of the selected products.
We are not aiming to select a particular model – we consider them as equally possible scenarios. Our goal is to see which of the FOSS characteristics can have impact on the effort when such models are in place, keeping in mind that this impact could differ from one model to another.
We now define the impact that the characteristics of thei-th FOSS compo-nent have on the expected effort ei as a (not necessarily linear) function fi of several variables and a stochastic error termǫi:
ei =f(xi1, . . . , xil, yil+1, . . . , yim, dim+1, . . . , dn) +ǫi (5)
The variables xij, j ∈ [1, l] impact the effort as scaling factors, so that a percentage change in them also implies a percentage change in the expected effort. The variables yij, l ∈ [l+ 1, m] directly impact the value of the effort. Finally, the dummy variablesdij, j∈[m+ 1, n]denote qualitative properties of the code captured by a binary classification in {0,1}.
For example, in our list the 36-th component is “Apache CXF” and the first scaling factor for effort is the number of lines of code written in popular pro-gramming languages so that xi,1=. locsP opulari, and x36,1= 627,639.
Given the above classification we can further specify the impact equation for thei-th component as follows
log(ei) =β0+ log(
l Y
j=1
(xij+ 1)βj) + m X
j=l+1
βi∗eyij+ n X
j=m+1
βi∗dij+ǫi (6)
whereβ0 is the initial fixed effort for a specific security maintenance model.
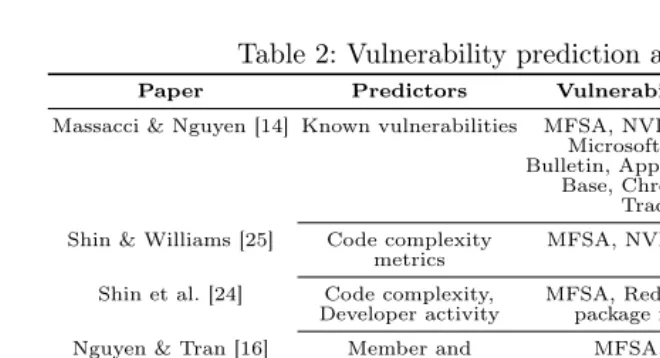
Table 2: Vulnerability prediction approaches
Paper Predictors Vulnerability data Predicted vars Massacci & Nguyen [14] Known vulnerabilities MFSA, NVD, Bugzilla,
Microsoft Security Bulletin, Apple Knowledge
Base, Chrome Issue Tracker
Vulnerabilities
Shin & Williams [25] Code complexity
metrics MFSA, NVD, Bugzilla Vulnerablefunctions Shin et al. [24] Code complexity,
Developer activity MFSA, Red Hat Linuxpackage manager Vulnerable files Nguyen & Tran [16] Member and
Component dependency graphs,
Code metrics
MFSA, NVD Vulnerable functions Walden & Doyle [27] SAVD, SAVI NVD Post-release
vulnerabilities Scandriato et al. [21] Frequencies of terms Fortify SCA warnings Vulnerable files
Walden et al. [28] Code metrics,
Frequencies of terms NVD Vulnerable files
4
Related Work
An extensive body of research explores the applicability of various metrics for estimating the number of vulnerabilities of a FOSS component.
The simplest metric is time (since release), and the corresponding model is a Vulnerability Discovery Model. Massacci and Nguyen [14] provide a com-prehensive survey and independent empirical validation of several vulnerability discovery models. Several other metrics have been used: code complexity met-rics [25,24,16], developer activity metmet-rics [24], static analysis defect densities [27], frequencies of occurrence of programming constructs [21,28], etc. We illustrate some representative cases in Table 2.
Shin and Williams [25] evaluated software complexity metrics for identifying vulnerable functions. The authors collected information about vulnerabilities in Mozilla JavaScript Engine (JSE) from MFSA4, and showed that nesting
com-plexity could be an important factor to consider. The authors stress that their approach has few false positives, but several false negatives. In a follow-up work, Shin et al. [24] also analyzed several developer activity metrics showing that poor developer collaboration can potentially lead to vulnerabilities, and that code complexity metrics alone are not a good vulnerability predictor.
Nguyen and Tran [16] built a vulnerability prediction model that represents software with dependency graphs and uses machine learning techniques to train the predictor. They used static code analysis tools to compute several source code metrics and tools for extracting dependency information from the source code, adding this information to the graphs that represent an application. To validate the approach, the authors analyzed Mozilla JSE. In comparison to [25], the model had a slightly bigger number of false positives, but less false negatives.
4
Walden and Doyle [27] used static analysis for predicting web application security risks. They measured the static-analysis vulnerability density
(SAVD) metric across version histories of five PHP web applications, which is calculated as the number of warnings issued by theFortify SCA5 tool per one thousand lines of code. The authors performed multiple regression analyses using SAVD values for different severity levels as explanatory variables, and the post-release vulnerability density as the response variable showing that SAVD metric could be a potential predictor for the number of new vulnerabilities.
Scandriato et al. [21] proposed to use a machine learning approach that mines source code of Android components and tracks the occurrences of specific patterns. The authors used the Fortify SCA tool: if the tool issues a warning about a file, this file is considered to be vulnerable. However, it may not be the case as Fortify can have many false positives, and authors verified manually only the alerts for 2 applications out of 20. The results show that the approach had good precision and recall when used for prediction within a single project. Walden et al. [28] confirmed that the vulnerability prediction technique based on text mining (described in [21]) could be more accurate than models based on software metrics. They have collected a dataset of PHP vulnerabilities for three open source web applications by mining the NVD and security announcements of those applications. They have built two prediction models: 1) a model that predicts potentially vulnerable files based on source code metrics; and 2) a model that uses the occurrence of terms in a PHP file and machine learning. The analysis shows that the machine learning model had better precision and recall than the code metrics model, however, this model is applicable only for scripting languages (and must be additionally adjusted for languages other than PHP).
Choosing the right source of vulnerability information is crucial, as any vul-nerability prediction approach highly depends on the accuracy and complete-ness of the information in these sources. Massacci and Nguyen [13] addressed the question of selecting the right source of ground truth for vulnerability anal-ysis. The authors show that different vulnerability features are often scattered across vulnerability databases and discuss problems that are present in these sources. Additionally, the authors provide a study on Mozilla Firefox vulnera-bilities. Their example shows that if a vulnerability prediction approach is using only one source of vulnerability data - MFSA, it would actually miss an impor-tant number of vulnerabilities that are present in other sources such as MFSA and NVD. Of course, the same should be true also for the cases when only the NVD is used as the ground truth for predicting vulnerabilities.
To the best of our knowledge, there is no work that predicts the effort required to resolve security issues in consumed third-party products.
5
Data Sources
We considered the following public data sources to obtain the metrics of FOSS projects that could impact the security effort in maintaining them:
5
1. National Vulnerability Database (NVD)– the US government public vulnerability database, we use it as the main source of public vulnerabilities (https://nvd.nist.gov/).
2. Open Sourced Vulnerability Database (OSVDB) – an independent public vulnerability database. We use it as the secondary source of public vulnerabilities to complement the data we obtain from the NVD (http: //osvdb.org).
3. Black Duck Code Center– a commercial platform for the open source governance can be used within an organization for the approval of the usage of FOSS components by identifying legal, operational and security risks that can be caused by these components. We use SAP installation to identify the most popular FOSS components within SAP.
4. Open Hub (formerly Ohloh) – a free offering from the Black Duck that is supported by the online community. The Open Hub retrieves data from source code repositories of FOSS projects and maintains statistics that represent various properties of the code base of a project (https: //www.openhub.net/).
5. Coverity Scan Service website– in 2006 Coverity started the initiative of providing free static code scans for FOSS projects, and many of the projects have registered since that time. We use this website as one of the sources that can help to infer whether a FOSS project is using SAST tools (https: //scan.coverity.com/projects)
6. Exploit Database website – the public exploit database that is main-tained by the Offensive Security6company. We use this website as the source
for the exploit numbers (https://www.exploit-db.com/).
7. Core Infrastructure Initiative (CII) Census – the experimental methodology for parsing through data of open source projects to help identify projects that need some external funding in order to improve their security. We use a part of their data to obtain information about Debian installations (https://www.coreinfrastructure.org/programs/census-project).
6
FOSS Project Metrics Selection
Initially we considered SAP installation of the Black Duck Code Center reposi-tory as the source of metrics that could impact the security maintenance effort when using FOSS components. We also performed a literature review and a sur-vey of other repositories to identify potentially interesting variables not currently used in the industrial setting, clustering them by the following four categories:
Security Development Lifecycle (SDL) – metrics that characterize how the SDL is implemented within a FOSS project. It includes indicators whether a project encourages to report security issues privately, is using one or more static analysis tools during development, etc.
Implementation – various implementation characteristics such as the main programming language and the type of a project.
6
Popularity – metrics that are relevant to the overall popularity of a FOSS project (e. g., user count and age in years).
Effort – we use these variables as the proxy for the desired response variable -the effort required by companies to update and maintain -their applications that are using FOSS components.
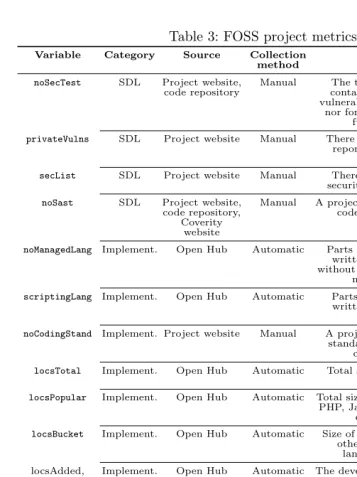
Table 3 shows the initial set of metrics that we considered, describing the rationale for including them and references to the literature in which the same or similar metrics were used.
The age of a project, its size and the number of developers (years,
locsTotal, andcontribs) are traditionally used in various studies that inves-tigate defects and vulnerabilities in software [7,31], the software evolution [5,3] and maintenance [32]. We consider security vulnerabilities to be a specific class of software defects, which are likely to be impacted by these factors.
Several studies considered the popularity of FOSS projects as being relevant to their quality and maintenance [19,20,32] - we used userCount from Open Hub anddebianInst from CII Census as measures of popularity for a project. Many studies investigated whether frequent changes to the source code can intro-duce new defects [15,34,24,32,11] - we intended to capture this withlocsAdded,
locsRemoved, and commitsmetrics from Open Hub.
The presence of security coding standards as a taxonomy of common pro-gramming errors [10,23] that caused vulnerabilities in projects should reduce the amount of vulnerabilities and the effort as well. We could not find references to how the presence of security tests could impact the effort.
Wheeler [29] suggested that successful FOSS projects should use SAST tools, which should at least reduce the amount of “unforgivable” security issues dis-cussed by Christey [6].
Numbers of vulnerabilities and exploits have a strong correlation (in our dataset: rho = 0.71, p < 0.01) because security researchers can create exploits to test published vulnerabilities and, alternatively, they can create exploits to prove that a vulnerability indeed exists (so that it will be published as a CVE entry after an exploit was disclosed). We tested both values without finding significant differences and for simplicity we report here thevulnsvariable as the proxy for effort.
After obtaining the values of these metrics for a sample of 50 projects we understood that only variables that could be extracted automatically and semi-automatically are interesting for the maintenance phase. Gathering the data manually introduces bias and limits the size of a dataset that we can analyze, and, therefore, the validity of the analysis at all. Thus, we removed the man-ual variables and expanded the initial dataset up to 166 projects (at least 5 consuming products in SAP Black Duck repository).
“Apache Struts 2” data point into another two instances marked as “library” and “framework”, this would introduce dependency relations between these data points. Assigning arbitrarily only one category to such data points would also be inappropriate.
A comprehensive classification of FOSS projects would require to perform a large number of interviews with developers to understand the exact nature of the usage of a component and the security risk. However, it is unclear what would be the added valueto developers of this classification.
Below we describe relations between explanatory and response variable: 1. locsPopular and locsBucket (xij) – the more there are lines of code,
the more there are potential vulnerabilities (that are eventually disclosed publicly). We use these two variables instead of just having locsTotal be-cause almost every project in our dataset is written in multiple programming languages, including widely-used languages (locsPopular), and rarely-used ones (locsBucket). Therefore, different ratios between these two variables could impact the effort differently.
2. locsEvolution(yij) shows how the code base of a project was changed for the whole period of its life. We compute this metric by obtaining the sum of the total number of added and removed lines of code divided bylocsTotal. Figure 2 shows that we could not use added and deleted lines of code as the measure of global changes as they correlate with each other and with
locsTotal, howeverlocsEvolutionhas no correlations withlocsTotaland can be used as an independent predictor.
3. userCount and debianInst (yij) – the more there are users, the more potential security vulnerabilities will be reported.debianInst provides an alternative measure foruserCount, however, the two measures are not ex-actly correlated as some software is usually downloaded from the Web (e. g., Wordpress) so it is very unlikely that someone would install it from the De-bian repository, even if a corresponding package exists. On the other hand, some software may be distributed only as a Debian package.
4. years(yij) – more vulnerabilities could be discovered over time.
5. commits (yij) – many commits introduce many atomic changes that can lead to more security issues.
6. contribs (yij) – many contributors might induce vulnerabilities as they might not have exhaustive knowledge on the project and can incidentally break some features they are unaware of.
7. noManagedLang(dij) – parts written in programming languages without built-in memory management could have more security vulnerabilities (e. g., DoS, Sensitive information disclosure, etc.).
8. scriptingLang(dij) – software including fragments in scripting languages could be prone to code injection vulnerabilities.
Table 3: FOSS project metrics
Variable Category Source Collection method
Rationale Ref.
noSecTest SDL Project website,
code repository Manual contains tests for pastThe test suite neither vulnerabilities (regression)
nor for tests for security functionality.
[29] [1] [6]
privateVulns SDL Project website Manual There is a possibility to report security issues
privately.
secList SDL Project website Manual There is a list of past security vulnerabilities.
noSast SDL Project website, code repository,
Coverity website
Manual A project is not using static
code analysis tools. [29] [1]
noManagedLang Implement. Open Hub Automatic Parts of the project are written in a language without automatic memory
management.
[32] [30]
scriptingLang Implement. Open Hub Automatic Parts of a project are written in a scripting
language.
[32]
noCodingStand Implement. Project website Manual A project has no coding standards for potential
contributors.
[1]
locsTotal Implement. Open Hub Automatic Total size of code bases
(LoC). [5] [7] [31][3] [33]
locsPopular Implement. Open Hub Automatic Total size of Java, C, C++, PHP, JavaScript, and SQL
code (LoC).
locsBucket Implement. Open Hub Automatic Size of the code bases for other programming
languages (LoC). locsAdded,
locsRemoved Implement. Open Hub Automatic The development activity ofa project. [24] [11] [32][15] [7] [34]
userCount Popularity Open Hub Automatic The user count of a project
(Open Hub). [32] [20] [30][19] [18] [1]
debianInst Popularity CII Census
Semi-automatic The number of installationsof a Debian package that corresponds to a project.
commits Popularity Open Hub Automatic Number of total commits. [15] [24] [32]
contribs Popularity Open Hub Automatic Total number of
contributors. [15] [24] [32]
years Popularity Open Hub Automatic Age of a project in years. [17] [32] [11]
vulns Effort NVD, OSVDB, and other vuln.
databases
Semi-Automatic The total number ofpublicly disclosed vulnerabilities.
exploits Effort Exploit DB
website automaticSemi- publicly available exploits.The total number of
blackduck Effort Black Duck
Table 4 shows the descriptive statistics of response and explanatory variables selected for the analysis.
●● ● ● ● ● ●● ●●● ● ● ● ● ● ● ● ● ● ● ● ● ● ● ● ● ● ● ● ● ● ● ● ● ● ● ● ● ● ● ● ● ● ● ● ● ● ● ● ● ● ● ● ● ● ● ● ● ● ● ● ● ● ● ● ● ● ● ● ● ● ● ● ● ● ● ● ● ● ● ● ● ● ● ● ● ● ● ● ● ● ● ● ● ● ● ● ● ● ● ● ● ● ● ● ● ● ●●● ● ● ● ● ● ● ● ● ● ● ● ● ● ● ● ● ● ● ● ● ● ● ● ● ● ● ● ●
4 5 6 7
4
5
6
7
8
LOCS_TOTAL vs LOCS_ADDED
Total current LOCs (log10 scale)
T
otal added LOCs (log10 scale)
●● ● ● ● ● ●● ●●● ●● ● ● ● ● ● ● ● ● ● ● ● ● ● ● ● ● ● ● ● ● ● ● ● ● ● ● ● ● ● ● ● ● ● ● ● ● ● ● ● ● ●● ● ● ● ● ● ●● ● ● ● ● ● ● ● ● ● ● ● ● ● ● ● ● ● ● ● ● ● ● ● ● ● ● ● ● ● ● ● ● ● ● ● ● ● ● ● ● ● ● ● ● ● ● ●●● ● ● ● ● ● ● ● ● ● ● ● ● ● ● ● ● ● ● ● ● ● ● ● ● ● ● ● ●
4 5 6 7 8
3
4
5
6
7
LOCS_ADDED vs. LOCS_REMOVED
Total added LOCs (log10 scale)
T
otal remo
v
ed LOCs(log10 scale)
● ● ● ● ● ● ● ● ●●● ● ● ● ● ● ● ● ● ● ● ● ● ● ● ● ● ● ● ● ● ● ● ● ● ● ● ● ● ● ● ● ● ● ● ● ● ● ● ● ● ● ● ● ● ● ● ● ● ● ● ● ● ● ● ● ● ● ● ● ● ● ● ● ● ● ● ● ● ● ● ● ● ● ● ● ● ● ● ● ● ● ● ● ● ● ● ● ● ● ● ● ● ● ● ● ● ● ●●● ● ● ● ● ● ● ● ● ● ● ● ● ● ● ● ● ● ● ● ● ● ● ● ● ● ● ● ●
4 5 6 7
3
4
5
6
7
LOCS_TOTAL vs LOCS_REMOVED
Total current LOCs (log10 scale)
T
otal remo
v
ed LOCs (log10 scale)
● ● ● ● ● ● ● ● ● ● ● ● ● ● ● ● ● ● ● ● ● ● ● ● ● ● ● ● ● ● ● ● ● ● ● ● ● ● ● ● ● ● ● ● ● ● ● ● ● ● ● ● ● ● ● ● ● ● ● ● ● ● ● ● ● ● ● ● ● ● ● ● ● ● ● ● ● ● ● ● ● ● ● ● ● ● ● ● ● ● ● ● ● ● ● ●● ● ● ● ● ● ● ● ● ● ● ● ●●● ● ● ● ● ● ● ● ● ● ● ● ● ● ● ● ● ● ● ● ● ● ● ● ● ● ● ● ●
4 5 6 7
0.5
1.0
1.5
2.0
2.5
LOCS_TOTAL vs LOCS_EVOLUTION
Total current LOCs (log10 scale)
Ev
[image:14.612.221.373.111.253.2]olution of projects (log10 scale)
Fig. 2: The locsEvolution metric
7
Analysis
To analyze the statistical significance of the models and identify the variables that impact security effort, we employ a least-square regression (OLS). Our reported R2 values (0
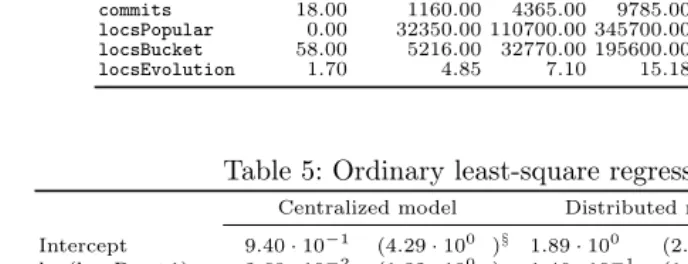
Table 4: Descriptive statistics
Statistic
Variable Min 1st Quartile Median Mean 3rd Quartile Max effort_centralized 0.69 3.64 4.43 4.81 5.75 10.13 effort_distributed 2.00 38.24 84.50 706.60 316.50 25020.00 effort_hybrid 2.00 2540.00 44.00 210.10 139.10 4554.00 years 1.00 7.00 10.00 10.27 13.75 28.00 userCount 0.00 9.00 52.00 258.00 178.00 9390.00 debianInst 0.00 42.75 1407.00 21970.00 12390.00 175900.00 contribs 1.00 15.00 32.00 115.20 101.20 1433.00 commits 18.00 1160.00 4365.00 9785.00 8806.00 174803.00 locsPopular 0.00 32350.00 110700.00 345700.00 310700.00 13830000.00 locsBucket 58.00 5216.00 32770.00 195600.00 128000.00 9372000.00 locsEvolution 1.70 4.85 7.10 15.18 12.60 638.10
Table 5: Ordinary least-square regression results
Centralized model Distributed model Hybrid model Intercept 9.40·10−1 (4.29·100 )§ 1
.89·100 (2.33·100 )†−1
.83·100 (−1.96)∗
log(locsPop+1) 2.68·10−2 (1.32·100 ) 1.46·10−1 (1.94·100 )∗ 0.25·100
(2.89)‡
log(locsBucket+1)−4.01·10−5
(−2.00·10−3
) 1.28·10−2
(1.86·10−1
) 9.42·10−2
(1.20)
locsEvolution 1.83·10−4 (0.31·100 ) 8.62·10−4 (3.98·10−1) 9.31·10−4 (0.38) years 2.07·10−2 (2.66·100 )‡ 8
.47·10−2 (2.94·100 )‡ 9
.47·10−2 (2.87)‡
commits −1.01·10−6
(−0.46·100
)−5.96·10−6
(−7.26·10−1
) −1.11·10−5
(−1.19)
contribs −7.50·10−5
(−0.47·100
)−3.31·10−4
(−0.57·100
) 5.66·10−4
(0.84) userCount 8.77·10−5 (2.22·100 )† 5
.49·10−4 (3.74·100 )§ 5
.81·10−4 (3.46)§
debianInst 1.70·10−6 (2.39·100 )† 8.99·10−6
(3.41·100 )§ 1.10·10−5
(3.64)§
N 166 166 166
MultipleR2
0.21 0.34 0.39
AdjustedR2
0.17 0.30 0.36
F-statistic 5.30 (p < 0.01) 10.13 (p < 0.01) 12.41 (p < 0.01) Note,t-statistics are in parentheses. Signif.codes:∗5%,†1%,‡0.1%,§0.001%
Zhang et al. [31] demonstrated a positive relationship between the size of a code base (LOC) and defect-proneness. Zhang [33] evaluated the LOC metrics for defect prediction and concluded that larger modules tend to have more defects. Security vulnerabilities are a subclass of software defects, and our results show that this effect only holds for particular programming languages: the locsPop-ularvariable has a positive impact on the effort (it is statistically significant for thedistributedand hybridmodels), thelocsBucket is essentially negligible as a contribution (10−5).
ThelocsEvolution,commitsandcontribsvariables do not seem to have an impact. We expected the opposite result, as many works (e. g., [15,7,24]) sug-gest a positive relation between number (or frequency) of changes and defects. However, these works assessed changes with respect to distinct releases or com-ponents or methods, while we are using the cumulative number of changes for all versions in a project; we may not capture the impact because of this.
[image:15.612.44.388.223.355.2]break it. Massacci and Nguyen [13] illustrated this model by showing that the vulnerability discovery rate was the highest during the active phase of Mozilla Firefox 2.0. We find that the age of a project – yearshas a significant impact in all our effort models, thus supporting those models.
It is a folk knowledge that “Given enough eyeballs, all bugs are shallow” [19], meaning that FOSS projects have the unique opportunity to be tested and scru-tinized not only by their developers, but by their user community as well. We found that in our models the number of external users (userCountand debian-Inst) of a FOSS component has small but statistically significant impact. This could be explained by the intuition that only a major increase of the popularity of a FOSS project could result in finding and publishing new vulnerabilities: not every user would have enough knowledge in software security for finding vulnerabilities (or motivation for reporting them).
8
Conclusions
In this paper we have investigated the publicly available factors that can impact the effort required for performing security maintenance process within large soft-ware vendors that have extensive consumption of FOSS components. We have defined three security effort models –centralized,distributed, and hybrid, and selected variables that may impact these models. We automatically collected data on these variables from 166 FOSS components currently consumed by SAP products and analyzed the statistical significance of these models.
As a proxy for security maintenance effort of consumed FOSS components we used the combination of the number of products using a these components, and the number of known vulnerabilities in them. As the summary of our findings, the main factors that influence the security maintenance effort are the amount of lines of code of a FOSS component and the age of the component. We have also observed that the external popularity of a FOSS component has statistically significant but small impact on the effort, meaning that only large changes in popularity will have a visible effect.
As a future work we plan collecting a wider sample of FOSS projects, assess-ing other explanatory variables and investigatassess-ing our models further. Usassess-ing the data for prediction of the effort is also a promising direction for the future work.
Acknowledgments
This work has been partly supported by the European Union under agreement no. 285223 SECONOMICS, no. 317387 SECENTIS (FP7-PEOPLE-2012-ITN), the Italian Project MIUR-PRIN-TENACE, and PON - Distretto Cyber Security attività RI.4.
References
2. O. Alhazmi, Y. Malaiya, and I. Ray. Security vulnerabilities in software systems: A quantitative perspective. InData and Applications Security XIX, pages 281–294. 2005.
3. K. Beecher, A. Capiluppi, and C. Boldyreff. Identifying exogenous drivers and evolutionary stages in floss projects. Journal of Systems and Software, 82(5):739– 750, 2009.
4. L. ben Othmane, G. Chehrazi, E. Bodden, P. Tsalovski, A. D. Brucker, and P. Mis-eldine. Factors impacting the effort required to fix security vulnerabilities: An industrial case study. InProceedings of Information Security Conference. 2015. 5. A. Capiluppi. Models for the evolution of os projects. InProceedings of
Interna-tional Conference on Software Maintenance, 2003.
6. S. Christey. Unforgivable vulnerabilities. Black Hat Briefings, 2007.
7. M. Gegick, L. Williams, J. Osborne, and M. Vouk. Prioritizing software security fortification throughcode-level metrics. In Proceedings of the 4th ACM workshop on Quality of protection, 2008.
8. M. Hansen, K. Köhntopp, and A. Pfitzmann. The open source approachÑopportu-nities and limitations with respect to security and privacy. Computers & Security Journal, 21(5):461–471, 2002.
9. J.-H. Hoepman and B. Jacobs. Increased security through open source. Commu-nications of the ACM, 50(1):79–83, 2007.
10. R. L. Jones and A. Rastogi. Secure coding: building security into the software development life cycle. Information Systems Security, 13(5):29–39, 2004.
11. Y. Kamei, E. Shihab, B. Adams, A. E. Hassan, A. Mockus, A. Sinha, and N. Ubayashi. A large-scale empirical study of just-in-time quality assurance.IEEE Transactions on Software Engineering, 39(6):757–773, 2013.
12. Z. Li, L. Tan, X. Wang, S. Lu, Y. Zhou, and C. Zhai. Have things changed now?: an empirical study of bug characteristics in modern open source software. In
Proceedings of the 1st workshop on Architectural and system support for improving software dependability, 2006.
13. F. Massacci and V. H. Nguyen. Which is the right source for vulnerability studies?: an empirical analysis on mozilla firefox. In Proceedings of the 6th International
Workshop on Security Measurements and Metrics, 2010.
14. F. Massacci and V. H. Nguyen. An empirical methodology to evaluate vulnerability discovery models. IEEE Transactions on Software Engineering, 40(12):1147–1162, 2014.
15. N. Nagappan and T. Ball. Use of relative code churn measures to predict sys-tem defect density. InProceedings of 27th International Conference on Software Engineering, 2005.
16. V. H. Nguyen and L. M. S. Tran. Predicting vulnerable software components with dependency graphs. InProceedings of the 6th International Workshop on Security
Measurements and Metrics, 2010.
17. A. Ozment and S. E. Schechter. Milk or wine: Does software security improve with age? InProceedings of Usenix Security Symposium, 2006.
18. G. Polančič, R. V. Horvat, and T. Rozman. Comparative assessment of open source software using easy accessible data. In Proceedings of 26th International Conference on Information Technology Interfaces, 2004.
19. E. Raymond. The cathedral and the bazaar. Knowledge, Technology & Policy, 12(3):23–49, 1999.
20. H. Sajnani, V. Saini, J. Ossher, and C. V. Lopes. Is popularity a measure of quality? an analysis of maven components. In Proceedings of IEEE International
21. R. Scandariato, J. Walden, A. Hovsepyan, and W. Joosen. Predicting vulnerable software components via text mining.IEEE Transactions on Software Engineering, 40(10):993–1006, 2014.
22. G. Schryen. Is open source security a myth? Communications of the ACM, 54(5):130–140, 2011.
23. R. C. Seacord. Secure coding standards. In Proceedings of the Static Analysis Summit, NIST Special Publication, 2006.
24. Y. Shin, A. Meneely, L. Williams, J. Osborne, et al. Evaluating complexity, code churn, and developer activity metrics as indicators of software vulnerabilities.IEEE Transactions on Software Engineering, 37(6):772–787, 2011.
25. Y. Shin and L. Williams. An empirical model to predict security vulnerabilities using code complexity metrics. InProceedings of the Second ACM-IEEE
interna-tional symposium on Empirical software engineering and measurement, 2008.
26. K.-J. Stol and M. Ali Babar. Challenges in using open source software in product development: a review of the literature. In Proceedings of the 3rd International Workshop on Emerging Trends in Free/Libre/Open Source Software Research and Development, 2010.
27. J. Walden and M. Doyle. Savi: Static-analysis vulnerability indicator. IEEE Se-curity & Privacy Journal, 10(3):32–39, 2012.
28. J. Walden, J. Stuckman, and R. Scandariato. Predicting vulnerable components: Software metrics vs text mining. InProceedings of IEEE 25th International Sym-posium on Software Reliability Engineering, 2014.
29. D. A. Wheeler. How to evaluate open source software/free software (oss/fs) pro-grams. URL http://www. dwheeler. com/oss_fs_eval. html, 2005.
30. D. A. Wheeler and S. Khakimov. Open source software projects needing security investments. 2015.
31. D. Zhang, K. El Emam, H. Liu, et al. An investigation into the functional form of the size-defect relationship for software modules. IEEE Transactions on Software Engineering, 35(2):293–304, 2009.
32. F. Zhang, A. Mockus, Y. Zou, F. Khomh, and A. E. Hassan. How does context affect the distribution of software maintainability metrics? InProceedings of 29th
IEEE International Conference on Software Maintenance, 2013.
33. H. Zhang. An investigation of the relationships between lines of code and defects.
InProceedings of IEEE International Conference on Software Maintenance, 2009.