Self-Consolidating Concrete
.
White Rose Research Online URL for this paper:
http://eprints.whiterose.ac.uk/95562/
Version: Accepted Version
Proceedings Paper:
Garcia-Taengua, E orcid.org/0000-0003-2847-5932 and Marti-Vargas, JR (2016)
Multivariate Analysis of the Fresh State Parameters of Self-Consolidating Concrete. In:
Khayat, K, (ed.) Proceedings of the 8th International RILEM Symposium on
Self-Compacting Concrete. 8th International RILEM Symposium on Self-Compacting
Concrete (SCC2016), 15-18 May 2016, Washington DC, United States. RILEM
Publications S.A.R.L. (France) , pp. 221-231. ISBN 978-2-35158-156-8
[email protected] https://eprints.whiterose.ac.uk/ Reuse
Unless indicated otherwise, fulltext items are protected by copyright with all rights reserved. The copyright exception in section 29 of the Copyright, Designs and Patents Act 1988 allows the making of a single copy solely for the purpose of non-commercial research or private study within the limits of fair dealing. The publisher or other rights-holder may allow further reproduction and re-use of this version - refer to the White Rose Research Online record for this item. Where records identify the publisher as the copyright holder, users can verify any specific terms of use on the publisher’s website.
Takedown
If you consider content in White Rose Research Online to be in breach of UK law, please notify us by
Multivariate Analysis of the Fresh State Parameters of
Self-Consolidating Concrete
Emilio Garcia-Taengua1 and Jose R. Marti-Vargas2
1 Institute for Resilient Infrastructure, School of Civil Engineering,
University of Leeds (United Kingdom)
2 ICITECH Institute for Concrete Science and Technology, Universitat
Politècnica de València (Spain)
Abstract Different tests can be performed to measure the fresh state performance
of SCC mixes and to ensure that the specified requirements in terms of filling ability, passing ability and segregation resistance are satisfied. The parameters obtained from the slump flow test, V-funnel, L-box and J-ring, dependent on the characteristics of the materials used and their amounts, are also strongly interdependent. This paper studies the structure of correlations among these fresh state parameters and exploits it to develop a general model that relates fresh state performance to mix design characteristics. Experimental results from different papers and reports were collected in a database that was analyzed using data mining and multivariate analysis techniques. The most important aspects of the model developed are described and discussed as a first step towards its further development into a comprehensive tool for a systematic assessment of the fresh state performance of SCC mixes.
Keywords: database, fresh state, multivariate analysis, testing.
Introduction
In addition to chemical admixtures, SCC mixes typically include mineral powders, lower coarse aggregate volumes and higher fine aggregate dosages than in conventional concrete [1–3]. The relatively high volume of paste facilitates the enhancement of the material's fresh state performance to reach appropriate levels of self-compactability. The key characteristics of SCC are filling ability, passing ability, and stability or resistance to segregation. The different approaches and mix design strategies that have been proposed [4–9] have two aspects in common:
Fresh state performance is in most cases measured by means of some of the following tests: slump flow, V-funnel, L-box, or J-ring [10].
As these three key characteristics are functions of the mix design parameters, the search for a trade-off is a multi-objective optimization problem where two functions are to be maximized (filling ability, passing ability) and a third one is to be minimized (risk of segregation). However, the problem is extraordinarily complex as these three aspects are not independent from each other, the parameters obtained from the different tests are highly correlated, and there are important non-linear effects and interactions between the mix design parameters that are not easily accounted for.
Scope and Objectives
A review of the literature published on SCC and self-compacting fiber reinforced concrete (SCFRC) offers plenty of data concerning many different mix designs and their fresh state properties. All this information can be put together and analyzed using data mining techniques to take advantage of the high number of cases reported and their correlations. This paper reports a first attempt to achieve these objectives:
Construction of a database with SCC and SCFRC mix designs and fresh state results previously published.
Study of the correlations between the parameters that are most commonly used to describe the fresh state performance of SCC and SCFRC mixes.
Reduction of this information to a minimal set of independent variables.
Analysis of the relationships between these variables and mix design parameters.
Description of the Database
Summary of the Information Compiled
At the time of writing, the following information about 193 SCC and SCFRC mixes reported in papers published between 2010 and 2014 [11–22] had been collected:
Slump-flow test: maximum spread (SF, in mm) and T500 time (in
seconds).
Visual segregation index (VSI), ranging between 0 (no segregation) and 3 (severe segregation).
L-box test: ratio between heights H2/H1 (adimensional).
V-funnel test: flow time Tv (in seconds).
J-Ring test: maximum spread (SFj, in mm) and passing index (Pj, in mm).
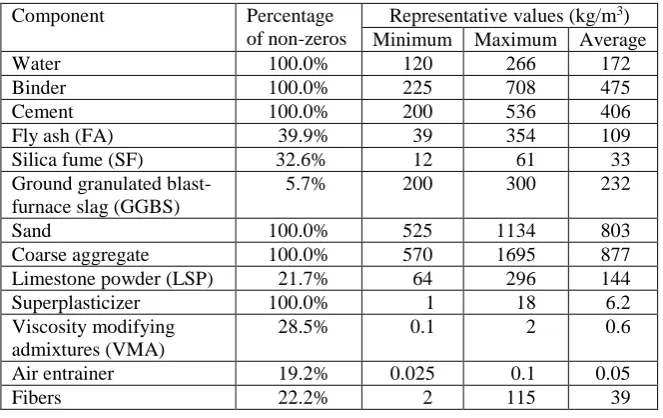
Table I. Summary of the SCC mixes included in the database.
Component Percentage of non-zeros
Representative values (kg/m3)
Minimum Maximum Average Water 100.0% 120 266 172 Binder 100.0% 225 708 475 Cement 100.0% 200 536 406 Fly ash (FA) 39.9% 39 354 109 Silica fume (SF) 32.6% 12 61 33 Ground granulated
blast-furnace slag (GGBS)
5.7% 200 300 232
Sand 100.0% 525 1134 803
Coarse aggregate 100.0% 570 1695 877 Limestone powder (LSP) 21.7% 64 296 144 Superplasticizer 100.0% 1 18 6.2 Viscosity modifying
admixtures (VMA)
28.5% 0.1 2 0.6
Air entrainer 19.2% 0.025 0.1 0.05 Fibers 22.2% 2 115 39
Treatment of Missing Values
The choice of fresh state parameters to be measured was not consistent throughout the different papers considered, and as a result the number of missing data in some of the variables was not negligible. Table II summarizes the relative impact of unreported data in the database under study. The slump-flow test was always carried out, although in some cases the T500 time was not measured. On the other
[image:4.595.73.405.90.299.2]hand, the J-Ring was the least common test, with a prevalence of only 29%.
Table II. Missing values corresponding to unreported fresh state results.
Parameter Percentage of missing values Slump-flow test: maximum spread 0.0% Slump-flow test: T500 12.4%
Visual Segregation Index (VSI) 39.9% L-box test: height ratio 49.2% Tv, V-funnel test: Tv 52.3%
J-Ring: maximum spread 71.0% J-Ring: passing index 71.0%
followed. The complete removal of incomplete cases is the most straightforward but the least convenient, as it implies a significant loss of information.
It was decided to completely discard the parameters from the J-Ring test, while a multiple imputation by fully conditional specification was performed to reconstruct the missing values of other parameters [24].
Multivariate Analysis of Fresh State Parameters
Bivariate Correlations
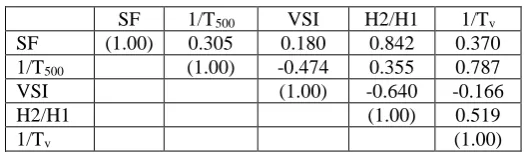
Table III shows the correlation coefficients (r) between any two fresh state parameters in the database under study. A strong direct correlation (r = 0.787) was observed between 1/T500 and 1/Tv. The parameter with the highest degree of
correlation with others was the L-box ratio H2/H1, directly correlated with SF (r = 0.842) and 1/Tv (r = 0.519) and inversely correlated with the VSI (r = -0.640). This
[image:5.595.106.370.309.386.2]structure of correlations between the fresh state parameters justified the need for the analysis presented in the following sections.
Table III. Correlation matrix.
SF 1/T500 VSI H2/H1 1/Tv
SF (1.00) 0.305 0.180 0.842 0.370 1/T500 (1.00) -0.474 0.355 0.787
VSI (1.00) -0.640 -0.166
H2/H1 (1.00) 0.519
1/Tv (1.00)
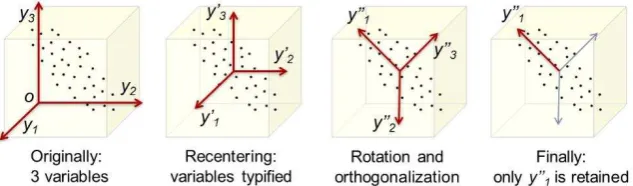
Principal Component Analysis (PCA)
The fresh state performance of any SCC mix in the database under study was described by 5 parameters. From an algebraic point of view, this means that any mix was a point in the 5-dimensional space, where the coordinate axes were the fresh state parameters measured. However, as they were strongly correlated, they did not constitute an orthogonal coordinate system, making the analysis, visualization and interpretation of the dataset very problematic.
components (PC1, PC2, and PC3) were retained as sufficiently informative, as they explained 94.66% of the total variance in the original variables.
Each principal component is a linear combination of the original variables. The coefficients given in Table IV define the directions of the new, rotated axes PC1, PC2 and PC3 in the original coordinate system.
[image:6.595.80.397.152.245.2]Figure 1. Illustrative example of PCA for an initial set of three variables.
Table IV. Principal components as function of the original variables.
PC1 PC2 PC3 SF 0.962 0.169 0.093 1/T500 0.234 0.896 -0.219
VSI 0.140 -0.187 0.971 H2/H1 0.897 0.361 0.109 1/Tv 0.258 0.921 -0.081
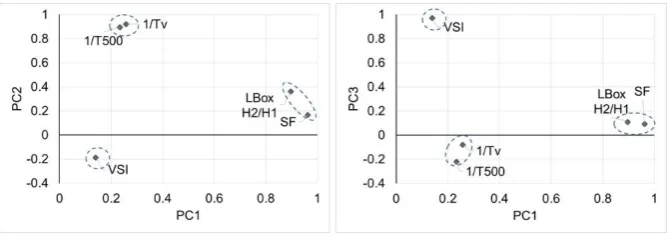
If the coefficients in Table IV are plotted in the new coordinate system defined by the three principal components extracted, Figure 2 is obtained. Three clusters are clearly identified, meaning that the variables that are close in these plots are clearly associated. PC1 (mostly SF and H2/H1) represented flowability in terms of spread and filling capacity, while PC2 (mostly 1/T500 and 1/Tv) represented the quickness
of the flow. The last principal component PC3 (mostly VSI) was representative of the mix stability.
Obtention of the Latent Variables
Figure 2. Component plots after PCA.
Effect of Mix Design on Fresh State Performance
Regression on the Latent Variables
Multiple linear regression and logistic binary regression were used for the development of models that relate LV1, LV2 and LV3, representing particular aspects of SCC fresh state performance, to the mix design parameters and their interactions. These models made it possible to identify statistically significant effects and synergies on SCC fresh state performance, and to interpret the trends identified.
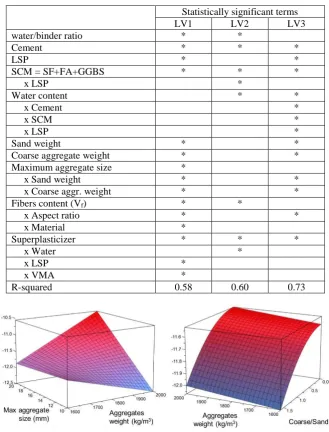
A sequential modelling approach was followed. Initial models that included all variables and interactions were iteratively simplified by discarding terms that were identified as non significant. The final models for LV1, LV2 and LV3 showed the best fit to the database and considered only statistically significant terms. Table V summarizes these models. Statistically significant terms are marked with an asterisk, and the R-squared value is given for each of the three models.
Response Surfaces for LV1
Figure 3 shows the response surfaces for LV1 (flowability in terms of spread) with respect to the aggregates. The impact of the total weight of aggregates on LV1 was strongly related to the maximum aggregate size to the point that it can reverse the trends (Figure 3 left). However, the most influential parameter on LV1 was the ratio between coarse aggregate and sand contents (Figure 3 right).
Table V. Summary of MLR analysis results.
Statistically significant terms
LV1 LV2 LV3
water/binder ratio * *
Cement * * *
LSP * *
SCM = SF+FA+GGBS * * *
x LSP *
Water content * *
x Cement *
x SCM *
x LSP *
Sand weight * *
Coarse aggregate weight * *
Maximum aggregate size *
x Sand weight * *
x Coarse aggr. weight * * Fibers content (Vf) * *
x Aspect ratio * *
x Material *
Superplasticizer * * *
x Water *
x LSP *
x VMA *
R-squared 0.58 0.60 0.73
Figure 3. Effect of the aggregates on LV1.
on LV1. However, the interference of fibers was significantly reduced when polypropylene fibers were considered.
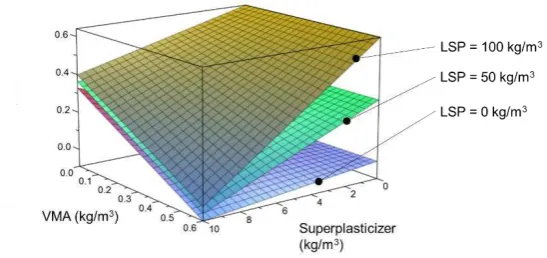
[image:9.595.100.365.266.389.2]Figure 4. Interaction between chemical admixtures and LSP on LV1.
Figure 5. Effect of fibers on LV1.
Response Surfaces for LV2
Figure 6 shows the response surface for LV2 (flowability in terms of quickness) with respect to the contents of supplementary cementitious materials and LSP. The effect of reducing the cement intensity of the binder was shown to follow a different trend depending on LSP content. Better flowability was observed for higher amounts of supplementary cementitious materials, but this effect was reversed in the absence of LSP or when added in small amounts; the threshold appears to be 85 kg/m3.
Response Surfaces for LV3
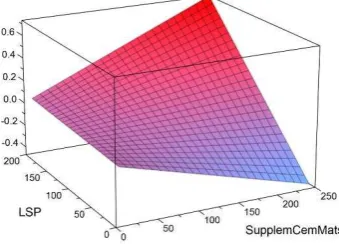
more complex than the ones developed for LV1 and LV2. This model correctly reproduces quite complex synergies and therefore it constitutes a promising development as it will allow numeric predictions to account for the risk of segregation. Figure 7 shows two plots that illustrate the response surfaces for LV3 derived from this model, where the vertical axis is the risk of segregation: 0 stands for high stability, while 1 corresponds to severe segregation. A detailed discussion of this model is not presented here due to space limitations but will be made available in upcoming publications.
Figure 6. Effect of supplementary cementitious materials and LSP on LV2.
Figure 7. Partial plots for LV3.
Conclusions
A database of SCC and SCFRC mixes has been put together with information about the mix components and their amounts as well as the experimental values obtained from fresh state tests as reported in previous papers.
The parameters obtained from the most usual tests to characterize the fresh state performance of SCC and SCFRC mixes are significantly interdependent.
Cement
N
e
w
L
V
3
0.0 0.2 0.4 0.6 0.8 1.0
200 250 300 350 400 450 500 550 600
Water
150 200 250
Sand
0.0 0.2 0.4 0.6 0.8 1.0
Principal Component Analysis has proven that the associations between fresh state parameters clearly define three latent variables corresponding to the following distinct aspects: flowability (T500, Tv), filling capacity (H2/H1, SF),
and stability (VSI).
The impact of the mix design on the fresh state performance of SCC and SCFRC mixes has been related to the aforementioned latent variables by means of generalised linear regression models.
The methodology applied has identified those synergies between mix design characteristics that have a statistically significant effect on fresh state performance.
References
1. Sonebi, M., Grünewald, S., Walraven, J.: Filling Ability and Passing Ability of Self-Consolidating Concrete. ACI Materials Journal. 104, 162– 170 (2007).
2. Uysal, M., Yilmaz, K.: Effect of mineral admixtures on properties of self-compacting concrete. Cement and Concrete Composites. 33, 771–776 (2011).
3. Ghoddousi, P., Shirzadi Javid, A.A., Sobhani, J.: Effects of particle packing density on the stability and rheology of self-consolidating concrete containing mineral admixtures. Construction and Building Materials. 53, 102–109 (2014).
4. Su, N., Hsu, K.-C., Chai, H.-W.: A simple mix design method for self-compacting concrete. Cement and Concrete Research. 31, 1799–1807 (2001).
5. Nepomuceno, M., Oliveira, L., Lopes, S.M.R.: Methodology for mix design of the mortar phase of self-compacting concrete using different mineral additions in binary blends of powders. Construction and Building Materials. 26, 317–326 (2012).
6. Ferrara, L., Park, Y.D., Shah, S.P.: A method for mix-design of fiber-reinforced self-compacting concrete. Cement and Concrete Research. 37, 957–971 (2007).
7. Wu, Q., An, X.: Development of a mix design method for SCC based on the rheological characteristics of paste. Construction and Building Materials. 53, 642–651 (2014).
8. Esmaeilkhanian, B., Khayat, K.H., Yahia, A., Feys, D.: Effects of mix design parameters and rheological properties on dynamic stability of self-consolidating concrete. Cement and Concrete Composites. 54, 21–28 (2014).
9. Mueller, F. V, Wallevik, O.H., Khayat, K.H.: Linking solid particle packing of Eco-SCC to material performance. Cement and Concrete Composites. 54, 117–125 (2014).
ACI Materials Journal. 103, 121–129 (2006).
11. Khayat, K.H., Kassimi, F., Ghoddousi, P.: Mixture Design and Testing of Fiber-Reinforced Self Consolidating Concrete. ACI Materials Journal. 111, 143–152 (2014).
12. Kassimi, F., El-Sayed, A.K., Khayat, K.H.: Performance of fiber-reinforced self-consolidating concrete for repair of fiber-reinforced concrete beams. ACI Structural Journal. 111, 1277–1286 (2014).
13. Esmaeilkhanian, B., Feys, D., Khayat, K.H., Yahia, A.: New Test Method to Evaluate Dynamic Stability of Self-Consolidating Concrete. ACI Materials Journal. 111, (2014).
14. Chowdhury, S., Basu, P.C.: New methodology to proportion self-consolidating concrete with high-volume fly ash. ACI Materials Journal. 107, 222–230 (2010).
15. Akalin, O., Akay, K.U., Sennaroglu, B.: Self-Consolidating High-Strength Concrete Optimization. ACI Materials Journal. 107(4), 1–8 (2011). 16. Kheder, G.F., Al Jadiri, R.S.: New method for proportioning
self-consolidating concrete based on compressive strength requirements. ACI Materials Journal. 107, 490–497 (2010).
17. Naji, S., Hwang, S.-D., Khayat, K.H.: Robustness of Self-Consolidating Concrete Incorporating Different Viscosity-Enhancing Admixtures. ACI Materials Journal. 108, 432–438 (2011).
18. Long, W., Khayat, K.H.: Creep of Prestressed Self-Consolidating Concrete. ACI Materials Journal. 5, 476–484 (2012).
19. Silva, P., De Brito, J., Costa, J.: Viability of two new mixture design methodologies for self-consolidating concrete. ACI Materials Journal. 108, 579–588 (2011).
20. Goel, S., Singh, S., Singh, P.: Fatigue Analysis of Plain and Fiber-Reinforced Self-Consolidating Concrete. ACI Materials Journal. 5, 573– 582 (2012).
21. Hassan, A. a a, Lachemi, M., Hossain, K.M. a: Effect of metakaolin and silica fume on rheology of self-consolidating concrete. ACI Materials Journal. 110, 723–724 (2013).
22. Keske, S.D., Schindler, A.K., Barnes, R.W.: Assessment of Stability Test Methods for Self-Consolidating Concrete. ACI Materials Journal. 4, 385– 394 (2013).
23. Lakshminarayan, K., Harp, S. a., Samad, T.: Imputation of missing data in industrial databases. Applied Intelligence. 11, 259–275 (1999).
24. Lee, K.J., Carlin, J.B.: Multiple imputation for missing data: Fully conditional specification versus multivariate normal imputation. American Journal of Epidemiology. 171, 624–632 (2010).
25. Wold, S., Esbensen, K., Geladi, P.: Principal component analysis. Chemometrics and Intelligent Laboratory Systems. 2, 37–52 (1987). 26. Browne, M.W.: An Overview of Analytic Rotation in Exploratory Factor