EUROPEAN COMMUNITIES
E E C N A T I O N A L A C C O U N T S I N T W E L V E T A B L E S
A N D
TABLE Ι ι Gross national product, 1957 1966: EEC United Kingdom USA Japan, in thousands of millions of dollars.
TABLE II : Volume indices of gross national product (1958=100), 19571966: EEC United Kingdom USA Japan.
TABLE III : Gross national product of the six ESC countries, 1957 1966: in national currencies.
TABLE IV : Volume indices of gross national product,(1958=100), 19571965: the six EEC countries.
TABLE" V : Expenditure on gross national product, I966:
EEC United Kingdom USA Japan the six EEC countries, in thousand million dollars.
TABLE VI : Volume indices of private consumption, public consumption and gross fixed asset formation (1958=100), 1957I966:
TABLE VII : Volume indices of private consumption, public consumption and gross fixed asset formation (1958=100), 1957, I96I, Ì965, I966: the six ESC countries.
TABLE VIII : Gross domestic product by industry of origin, I966: the six EEC countries, in per cent.
TABLE IX : Volume indices of gross domestic product, by industry of origin (1958=100), 1966: the six EEC countries.
TABLE X : Gross national product per head of population Compensation of employees per wage or salary earner Private consumption per head of population, I966:
EEC United Kingdom US Japan the six EEC countries, in dollars.
TABLE XI : Analysis of national income, 1957 and I966: the six EEC countries, in per cent.
NATIONAL ACCOUNTS desoribe the economic phenomena which make up the life of public institutions, private enterprises and even individuals. These phenomena are known as income and expenditure, production and consump-tion, lending and borrowing, investment and saving, sales and purchases, taxes and subsidies.
National accounts provide a framework which makes it possible to compare these flows with one another and measure their mutual relations.
For further details, the reader is referred to the Statistical Office's publication entitled:
- 2
The GROSS NATIONAL PRODUCT (GNP) is the total figure (aggregate) which is used to measure the economic performance of a given country in one year.
It can be said to do so with a margin of error of about 5$· It is described as GROSS because the value of depreciation is not deducted from the product. In other words, depreciation is not for this purpose regarded as a production cost.
It is shown at MARKET PRICES, simply because all transactions are ex-pressed in the prices at which they are effected.
The GRAPH below
shows, for three different years, the respective positions of the gross national products of the EEC, the United Kingdom (UK), the United States (USA) and Japan. In 1966, the EEC's GNP was three times as large as that of the United Kingdom or Japan, but less than half as large as that of the United SÌates (exactly 43$).
$'000 m. 1000
1957 1961 1966
T A B L E I
DEVELOPMENTS 1957-1966
GROSS NATIONAL PRODUCT (GNP)
-EEC
UNITED KINGDOM - USA
- JAPAN
- at market prices
- current values converted into dollars at current rates of exchange
3 '000 m.
Year SEC UK USA JAPAN
1957 1958 1959 I960 1961 1Q62 1963 1964 1965 1966 150,4 157,9 167,3 186,8 209,2 230,8 253,3 279,4 301,5 322,7 (a) (a) (a) 62,3 65,3 66,2 72,4 77,2 81,2 85,9 92,8 99,6 105,1 447,9 455,0 4Q1.2 511,4 528,6 569,1 599,7 642,8 695,5 756,5 30,8 31,4 35,6 42,6 51,5 57,9 65,3 76,4 84,2 96,4
The GRAPH below
shows how the gross national products of the EEC, the United Kingdom, the United States and Japan developed from 1957 to 1966, using indices with 1958 as 100. The effects of price changes have as far as possible been eliminated.
Since 1958: - J a p a n ' s GNP has more than doubled,
- the GNPs of the EEC and. the United S t a t e s have i n c r e a s e d by one h a l f ,
- the United Kingdom's GNP has r i s e n by 30$,
INDICES
1957 1958 1959 1960 1961 1962 1963 1964 1965 1966
T A B L E II
DEVELOPMENTS 1957-1966 -ESC - UNITED KINGDOM
USA - JAPAN
VOLUME INDICES OF GROSS NATIONAL PRODUCT (1958=100)
showing the development of GNP in real terms, i.e. eliminating that part of the increase which is attributable to price changes.
The GRAPH below
shows three stages in the gross national products of the six EEC oountries, expressed in thousands of millions of dollars at current prices.
From 1957 to I966, the share of the Federal Republio of Germany in the Community's total produot inoreased slightly, while the shares of France and Belgium declined.
$·000πι.
1957 1958 1959 1960 1961 1962 1963 1964 1965 1966
T A B L E III
DEVELOPMENTS 1957-1966 - THE SIX COUNTRIES
GROSS NATIONAL PRODUCT (GNP)
- at current market prices - in national currencies.
Year Germany (PR) France
Italy Netherlands Belgium Luxembourg DM '000
million million FF '000 Lit, '000 million Fl,million Bfrs.'000 million million Lfrs.
1957 1958 1959 10 60 1961 1962 1963 1964 1965 1966 216,30 231,50 250,90 296,80 326,20 354,50 377,60 413,80 450,60 478,30 (a) (a) (a) 213,00 244,71 267,38 296,22 319,69 356,29 395,97 435,24 464,72 500,53 17 081 18 340 19 437 21 O71 23 363 26 330 30 193 33 077 35 575 38 397 35 35 36 42 46 48 52 62 68 75 364 930 443 732 288 517 858 154 990 140 519,2 522,7 537,8 572,6 606,1 648,0 695,4 779,2 647,4 906,4 21 935 21 810 22 482 24 689 25 340 25 796 27 496 31 596
.
•
The GRAPH below
shows the limits between which the gross national products of the six EEC countries moved from 1957 to I966,
The area between these limits is fairly narrow; this indicates that economic development has been comparable in all six countries.
DEVELOPMENTS I957-I966 THE SIX ESC COUNTRIES
VOLUME INDICES OF GROSS NATIONAL PRODUCT (1958=100)
showing the development of GNP in real terms,
10
The total output of the nation is in part consumed by households and by the Government in the form of PRIVATE CONSUMPTION and PUBLIC CONSUMPTION,
The total output of the nation also serves to increase the structures, installations and equipment used for production (GROSS FIXED ASSET FORMATION),
As supply and demand are not fully adjusted to each other, a correction must be made in order to allow for changes in the stocks held by enterprises)
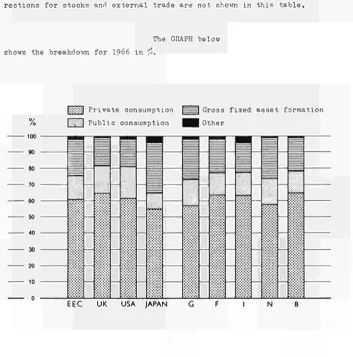
[image:16.420.19.372.193.550.2]these may consist of raw materials, semi-finished goods or finished goods. In addition, a further correction is necessary in order to add exports and subtract imports. If, for any particular country, columns 1, 2 and 3 in the following table are added together, they do not give the GNP (column 4), because the cor-rections for stocks and external trade are not shown in this table.
The GRAPH below shows the breakdown for I966 in $.
7=
10090 80 70 60 50 40 30 20 10
H:|:|:|:H Private consumption Public consumption
Gross fixed asset formation Other
T A B L E
EXPENDITURE ON GROSS NATIONAL PRODUCT AT MARKET PRICES I966
12
-T A B L E VI
DEVELOPMENTS 1957 - I 9 6 6 EEC - UNITED KINGDOM - USA - JAPAN
VOLUME INDICES OF PRIVATE CONSUMPTION,
PUBLIC CONSUMPTION AND GROSS FIXED ASSET FORMATION ( 1 9 5 8 - 1 0 0 )
1957 1958 1959 i960 1961 1962 1963 1964 1965 1966 Private EEC 97 100 104 110 117 124 132 13a 144 150 UK 99 100 105 109 111 114 119 124 126 128 consumption USA 99 100 106 109 111 117 122 129 137 144 JAPAN 93 100 108 118 130 143 156 172 183 197 Pubi EEC 98 100 106 112 118 127 134 136 144 148 ic consumpt UK 102 100 102 104 108 112 113 115 118 122 USA 98 100 101 102 108 115 118 120 123 138 ion JAPAN 91 100 102 106 113 126 135 149 I52 160 Gross EEC 97 100 IO9 120 132 141 149 162 167 I72 fixed UK 99 100 108 118 130 129 131 154 160 161 asset formation USA 105 100 109 108 107 116 121 129 140 146 JAPAN 98 100 114 153 196 212 222 255 260 284
In ten years:
PRIVATE CONSUMPTION doubled in Japan, rose by 50$ in the EEC and the United States, and by 30$ in the United Kingdom)
T A B L E V I I
DEVELOPMENTS 1 9 5 7 - 1 9 6 6 THE SIX EEC COUNTRIES VOLUME INDICES OF PRIVATE CONSUMPTION
PUBLIC CONSUMPTION AND GROSS FIXED ASSET FORMATION
1957 1961 1965 1966 0 96 120 146 151
Private consumpt
F . I
99 96 114 119 141 146 148 155
N 100 118 155 159 ion
. Β .
101 110 130 133 L
•
(1958=100)In ten years, private consumption rose by 60$ in three countries, in France by 5°$ and in Belgium by 30$,
Year 1957 I96I 1965 1966 G 93 126 160 163 Pubi
F .
104 113 133
137
ic comsumption
I . Ν , Β . 95 105 93 114 H O 113 135 126 152 140 130 162
L
.
.
.
■
In ten years, gross fixed asset formation in Germany in creased by 90$, in France by 80$, in Belgium and the Nether lands by 65$, and in Italy by 50$.
Year 1957 I96I 1965 1966 G 94 137 178 179 Gross
. F
05 121 I65 In fixed I 96 138 142 L47 asset Ν 115 133 177 188 formation
Β . L
IO7
137
168
14
The table opposite
shows a good overall structural homogeneity in the various groups of activity in the six EEC countries; manufacturing industry plays the pre-dominant part, accounting for about one third of the gross domestic product. If the activities are grouped under the headings of agriculture (line l), industry (lines 2, 3, 4, 5) and services (lines 6, 7, 8, 10, 11 and 12), it can be seen that Italy is the most agricultural country, Germany the highly industrialized, and Belgium the richest in services.
Germany (FR) France Italy Netherlands Belgium Luxembourg
AGRICULTURE INDUSTRY SERVICES
4,2 50,6 45,0
7,3 46,3 46,4
11,1 42,5 46,4
7,5 43,0 49,5
5,1 40,6 54,3
TOTAL 100,0 100.0 100,0 100,0 100,0
·*
T A B L E VIII
GROSS DOMESTIC PRODUCT BY INDUSTRY OF ORIGIN I966
This table shows the shares of individual industries in the gross domestio product at market prices. The domestic product is the result of economic activities pursued within the country. The national product, on the other hand, also includes net incomes from abroad.
1, 2. 3. 4. 5. 6. 7. 8. 9. 10. 11. 12. 13. Agriculture, forestry and fishing Mining and quarrying Manufacturing Construction Slectrioity, gas and water Transportation and communica-tion Wholesale and retail trade Banking and insuranoe Ownership of dwellings Other servioes General govern-ment Import duties(j)
T O T A L
Germany (FR) 4,2 (2,0)(a) 40,4 (a) 7,6 (1,9) 6,1 13,3 3,5 3,8 8,2 9,0 100,0 France 7,3(b) 1.3(a) 34,5(o) 8,8 1,7 4,8 11,1 2,6(d) 4,0 12.6(d) 9,0(d) 2,3 Italy Netherlands (1964) H,l(o) 0,7 31,5(e) 7,4 2,9 5,7 10,0 5,0 4,8 7,6 (f) 11,4 (f) 1,9 100,0 100,0 7,5 1,3 32,4 7,2 2,1 8,0 12,2 2,8 3,0 8,8 (g) 11,5 (g) 3,2 100,0 Belgium Xuxembourg 5,1 1,5 30,2 (h) 7,0 1,9 (h) 6,8 (i) 12,4 (h) 3,4 5,7 11,9(g)(1) . 10,3(g) 3,8 100,0
16
In the developments which characterize the period from 1958 to 1966, the greatest decline was in agriculture and in mining; the sharpest expansion was in electricity, banking and insurance.
The figures given apply to the Community as a whole. The figures on the next page make it possible to follow the development of each industry group in each oountry.
FOOTNOTES TO TABLES VIII AND IX
(a) Quarrying is included in item 3.
(b) Including the production of wine, excluding fishing.
(o) Excluding the production of wine, including fishing and quarrying. (d) Insurance brokers and most public hospitals and clinios are included in
item 10.
(e) The production of wine and olive oil is included in item 1. (f) Publio hospitals and clinics are included in item 10.
(g) Public hospitals and olinics are included in item 10, and state-financed eduoation in item 11,
(h) The production of gas and trade in meat, bread, cakes and cars are in-cluded in item 3.
Τ Α Β L ET IX
VOLUME INDICES OF GROSS DOMESTIC PRODUCT BY INDUSTRY OF ORIGIN (1958=100)- 1966
(For Italy, the indices refer to the domestic product at faotor cost. This is obtained by deduoting indirect taxes from the gross domestic product at market prices and adding subsidies.)
1. 2. 3. 4. 5. 6. 7. 8. 9. 0. 1. 3. Agriculture, forestry and fishing Mining and quarrying Manufacturing Construction Electricity, gas and water Transportation and communication Wholesale and retail trade
Banking and insuranoe Ownership of dwellings Other services General government
Gross domestic produot at market prices
18
-The GRAPH below
shows the relative position of the individual oountries for:
- GNP per head of population,
- compensation of employees per wage and salary earner,
- private consumption per head of population,
in 1966, where the EEC as a whole = 100,
The three items are relatively similar for eaoh oountry. The United
States achieves twice the level of the EEC, and Japan half. Of the Common
Market oountries, Italy is the least well placed.
INDICES
220
200 Gross national product at market prices·-;:;:
per head of population
■ . Compensation of employees ' ' per wage and salary earner
Private consumption per head of population
160
T A B L E Χ
GROSS NATIONAL PRODUCT AT MARKET PRICES - PER HEAD
COMPENSATION OF EMPLOYEES - PER WAGE
PRIVATE CONSUMPTION - PER HEAD
OF POPULATION
AND SALARY EARNER
OF POPULATION
1966
DOLLARS
GERMANY (FR) FRANCE ITALY NETHERLANDS BELGIUM LUXEMBOURG
EEC
UNITED KINGDOM U.S.A.
JAPAN
GNP per head of population
2 004 2 063 1 184 1 668 1 909 (2 027)
1 760
1 914 3 842
975
Compensation of employees per wage and salary
earner
2 779 3 303 2 328 3 015 3 029
•
2 850 2 590 6 090 1 539
Private consumption per head of popu
lation
1 145 1 314
746 965
1 240 (1 284)
1 070
1 226 2 376
20
Production Is the result of the combined activity of enterprises, employers, engineers, manual and white-collar workers, of industrialists and farmers, of manufacturers of goods and suppliers of servioes,. of man-power and of persons who provide money.
But none of these people is prepared to take part in this overall activity for nothing. All work, of whatever kind, deserves its reward: profits for enterprises and employers, salaries for engineers, wages for workers, interest for those who provide money.
The total of all these sums received and acquired forms the aggre-gate INCOME of all those involved in production.
The NATIONAL INCOME is obtained by deduoting depreciation and indirect taxation (less subsidies) from the GROSS NATIONAL PRODUCT. The page opposite shows the breakdown of national income by broad categories of recipient.
T A B L E XI
ANALYSIS OF NATIONAL INCOME IN 1957 AND IN I966
%
Compensation of employees
Personal incomes from property and entrepreneurship
Share of corporations
Share of general government
T o t a l
National inoome ($ '000 million at current prioes and exchange rates)
Germany (FR)
1 9 5 7( a )
59,7
3 1 , 9 —
6,5 —
1,9
100,0
4 0 , 1
1966 »67,0 ^27,1 .. 4,4 1,5 100,0 90,7 Frar 1957 58,6 — 36,0— 6,4 — 1,0 100,0 (39,7) ce 1966 65,1 30,9 ■~4,6 0,6 100,0 76,5 Italy 1957 52,5 48,0 0,5 100,0 21,7 1966 —»59,1 35,7 5,1 0,1 100,0 49,1
Compensation of employees
Personal incomes from property and entrepreneurship
Share of corporations Share of general government
T o t a l
National inoome ($ '000 mliion at current prioes and exchange rates)
Netherlands 1957 56,7^ 33,2 10,7 0,6 100,0 7,6 1966 — 6 6 , 3
— 26,9 — 7,5 0,7 100,0
17,0
Belg:
1957
5 5 , 9 —
41,1 —
4,5 —
1,5 100,0 8,4 um 1966 63,2 35,4
4 , 6
3,2 100,0 14,4 Luxe 1957 58,6 33,4 8,0 0 100,0 0,3 »bourg 1966
—* 63,7
— * 2 9 , 7
— ^ 3,9
2,7
100,0
0,5
22
-T A B L E XII
TOTAL POPULATION
LABOUR FORCE EMPLOYED
WAGE AND SALARY EARNERS
I960
'OOO
OBRMANY (FR) FRANCE ITALY NETHERLANDS BELGIUM
LUXEMBOURG (b)
EEC
Total population
59 638 49 400 51 961 12 455 9 528
333
183 315
Labour force employed
26 977 20 040 19 157
4 548 (a) 3 669
139
74 530
Wage and salary earners
21 870 15 O93 12 466
3 733 (a) 2 998
102
56 262
UNITED KINGDOM USA
JAPAN
54 895 196 920 98 920
25 955 76 051 48 180
24 201 71 8O5 28 730
r — —
• i l i
: :: :
::::
: : : r
,
!
:::::::::
WM
::\ :\ :::\
t
i
...:
■
;!;! Iiii
:::::::::
Ijl
-; -; * f
I r l i ;;;;;;;;;
i[lili
: : : - :
:::::::::
¡
; ; Í : : -:
_j
, i ,
i .
:: ::::|:::: ; : : : : ) : : : :
::: I
::: :|: : : : : : : ~ ~ : 77
■
. . . . i . . .
i-ii i
;i
:... ::::
Í-i-i::i
:::: ::::!::::
■
-—
|
::: : j : : : :