i HOME ELECTRICAL ENERGY MONITORING SYSTEM
MUHAMMAD IZWAN BIN AHMAD FUAD
This Report Is Submitted In Partial Fulfillment Of Requirements For The Bachelor Degree of Electronic Engineering (Industrial Electronics)
Fakulti Kejuruteraan Elektronik dan Kejuruteraan Komputer Universiti Teknikal Malaysia Melaka
ii
UNIVERSTI TEKNIKAL MALAYSIA MELAKA
FAKULTI KEJURUTERAAN ELEKTRONIK DAN KEJURUTERAAN KOMPUTER
BORANG PENGESAHAN STATUS LAPORAN PROJEK SARJANA MUDA II
Tajuk Projek : Home Electrical Energy Monitoring System
Sesi Pengajian : 1 2 / 1 3
Saya MUHAMMAD IZWAN BIN AHMAD FUAD………. (HURUF BESAR)
mengaku membenarkan Laporan Projek Sarjana Muda ini disimpan di Perpustakaan dengan syarat-syarat kegunaan seperti berikut:
1. Laporan adalah hakmilik Universiti Teknikal Malaysia Melaka.
2. Perpustakaan dibenarkan membuat salinan untuk tujuan pengajian sahaja.
3. Perpustakaan dibenarkan membuat salinan laporan ini sebagai bahan pertukaran antara institusi
pengajian tinggi.
4. Sila tandakan ( √ ) :
SULIT*
*(Mengandungi maklumat yang berdarjah keselamatan atau kepentingan Malaysia seperti yang termaktub di dalam AKTA RAHSIA RASMI 1972)
TERHAD** **(Mengandungi maklumat terhad yang telah ditentukan oleh organisasi/badan di mana penyelidikan dijalankan)
TIDAK TERHAD
Disahkan oleh:
__________________________ ___________________________________
(TANDATANGAN PENULIS) (COP DAN TANDATANGAN PENYELIA)
iii
“I hereby declared that this report entitled “Home Electrical Energy Monitoring System” is the result of my own work except as cited in the references.
Signature: ……….. Name: Muhammad Izwan Bin Ahmad Fuad
iv
“I hereby declared that have read through this report entitled “Home Electrical Energy Monitoring System” and found that it has comply the partial fulfillment for forwarding the Degree of Bachelor of Electronic Engineering (Industrial Electronics)
Signature: ……….. Name: Norizan Bin Mohamad
v
Acknowledgement
First and foremost, I would like to express my deepest appreciation to my supervisor, Mr. Norizan Bin Mohamad for giving me a golden opportunity to commence my final year project about Home Electrical Energy Monitoring System and I also special thanks to my supervisor during this year for his direction, assistance and excellent guidance throughout my final year project.
vi
Abstract
vii
Abstrak
viii
TABLE OF CONTENTS
CHAPTER CONTENT Page
TITLE i
REPORT STATUS VERIFICATION STATUS ii
STUDENT VERIFICATION STATUS iii
SUPERVISOR VERIFICATION STATUS iv
ACKNOWLEDGEMENT v
ABSTRACT vi
ABSTRAK vii
TABLE OF CONTENT viii
LIST OF FIGURE xii
LIST OF TABLE xiv
LIST OF ABBREVIATIONS xv
LIST OF APPENDIX xvi
I INTRODUCTION 1.1 Introduction of project 1
1.2 Objective 2 1.3 Problem Statement 3
1.4 Scope of the project 4
ix
II LITERATURE REVIEW
2.1 Overview 5
2.2 Electricity Consumption 5
2.3 Factor Contribute of Electricity in Home 6
2.4 Microcontroller adruino 8
2.4.1 The Arduino Hardware 9
2.4.2 The Software (IDE) 10
2.5 Current Sensor 11
2.5.1 Current Sensing Principles 11
2.6 Analog to Digital Conversion 12 2.7 Introduction to AC Power 13
2.7.1 Understanding AC power. 13
2.7.2 Resistive loads 13 2.7.3 Partially reactive loads 14 2.7.4 Real Power, Reactive power and 15 Apparent Power. 2.7.5 Power Factor 16 III METHODOLOGY 3.1 Overview 18
3.2 Project Methodology 18
3.3 Project Planning 20
3.4 Gantt Chart 21
3.5 Budget 22
3.6 Expected Result 22
3.7 Hardware and Component 24
x
3.7.2 Split Core Current Transformer 28
(ECS1030-L72) 3.8 Software 31 3.8.1 Visual Basic 32
3.8.2 Proteus VSM 32
3.8.3 Software Implementation 33
3.9 Hardware Implementation 34 3.9.1 Current Transformer interface with Arduino 34 3.10 Software Implementation 3.10.1 Voltage sensor (Calibration theory) 40 3.10.2 Current sensor (Calibration theory) 41 IV RESULT AND DISCUSSION 4.1 Overview 43 4.2 Individual Module Hardware Testing 43 4.2.1 Tested Instrument: Light Bulb 44
4.3 Circuit Diagram 45
4.3.1 Circuit Explanation 45
4.4 Result from Graphical User Interface 47
(Visual Basic) 4.4.1 When no current and voltage 47
4.4.2 When AC Voltage turn ON 47
4.4.3 When Laptop is turn ON 48
4.4.4 When Light Bulb is turn ON 49
4.4.5 When Kettle is turn ON 50
4.4.6 COM Port is Disconnect 50
xi 4.5 Coding to calculate Real Power, Apparent
Power, Vrms, Irms and Power Factor 52
4.5.1 Real Power 53
4.5.2 Root-Mean-Square (RMS) Voltage 54
4.5.3 Root-Mean-Square (RMS) Current 54
4.5.4 Apparent Power 55
4.5.5 Power factor 55
V CONCLUSION 5.1 Conclusion 56
5.2 Improvement 57
REFERENCES 58
APPENDIX A 59
APPENDIX B 60
APPENDIX C 61
APPENDIX D 69
APPENDIX E 71
xii
LIST OF FIGURES
NO TITLE PAGE
1.1 Factor contribute to electricity waste 3 2.1 Electricity consumption (billion kWh) in Malaysia 6 2.2 Energy Consumption For A Typical Home 7 2.3 Interface for arduino programming 10 2.4 Voltage, current, power graph of a resistive load 13 2.5 Voltage, current, power graph of a partially reactive load 14
2.6 Non Linear Load 17
3.1 Block Diagram of Home electrical energy monitoring system 19
3.2 Project Planning Flowchart 20
3.3 Expected GUI for Monitoring System 23 3.4 Expected design for Home Electrical Monitoring System 23
3.5 Arduino Nano V3.0 28
3.6 Split Core Current Transformer (ECS1030-L72) 31
3.7 Visual Basic 2010 Express 32
3.8 Schematic and Layout Circuit 33
3.9 Flowchart Software Implementation 34
3.10 Interface current transformer with arduino 37 3.11 Measuring AC Voltage interface with arduino 39
4.1 BreadBoard Connection 44
xiii 4.3 Schematic Circuit 45 4.4 Circuit design 46
4.5 Etching Circuit 46
4.6 Idle Condition 47
4.7 Voltage Measuring 48
4.8 Laptop ON 48
4.9 Light Bulb ON 49
4.10` Kettle ON 50
4.11 Port Disconnect 50
4.12 Graph for energy usage of electricity 51
4.13 Graph average usage of electricity 52
xiv
LIST OF TABLES
NO TITLE PAGE
3.1 Main Component for Home Electrical Energy Monitoring System 22
3.2 Specification of arduino Nano V3.0 27
3.3 Specification of Split Core Current Transformer 30
4.1 Light Bulb test 44
xv
LIST OF ABBREVIATIONS
AC – Alternative Current DC – Direct Current
GUI – Graphical User Interface kWh – Kilo-watt-hour
IDE – Integrated Development Environment USB – Universal Serial Bus
ADC – Analogue to Digital Conversion RMS – Root Mean Square
xvi
LIST OF APPENDIX
NO TITLE PAGE
A Complete prototype design for electrical energy monitoring
System 59
B Gantt Chart 60
C Arduino Coding 61
D Visual Basic Coding 69
1
CHAPTER I
INTRODUCTION
1.1 Introduction of Project
2
1.2 Objective
There are several objectives that need be focused in order to achieve this project.
a) To provide effective monitoring system of electricity energy consumption in households with their energy consumption level will be appears to display.
• The idea is to create an effective way for user to know their level of electricity which can be monitor at home.
b) It provides real-time, prompt and convenient display on electrical energy consumption.
• The design will allow user to know their electricity consumption in real time which user able to know at present time.
c) Able give warning signal if the electricity exceed the limit
3
1.3 Problem statement
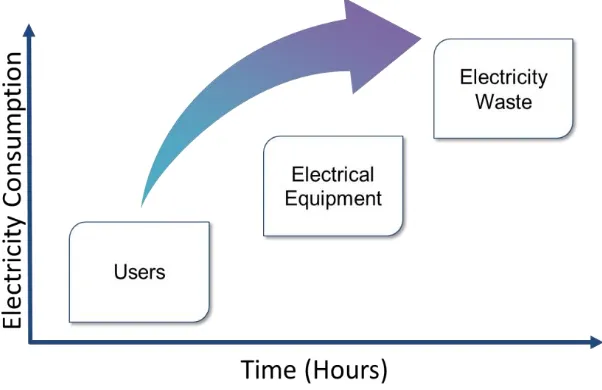
[image:19.595.168.469.306.501.2]Nowadays, the level of electricity consumption is increasing each year because there are no actions are being taken to reduce the usage of electricity. For example, when watching television, sometimes the user forget to switch off the television and leave it open whole day long even though still do not watch it anymore. This will be contributing to the increasing level of electricity waste. By using this system, it will help user to be more sensitive on their level of electricity consumption by displaying the level of electricity usage in the home.
Figure 1.1: Factor contribute to electricity waste
4
1.4 Scope of the project
In order to achieve an objective of the project, there are several scope need to be limit. The scope of the project includes:
a) Create home electrical monitoring system that can be used in the home that is using a single phase electrical connection.
b) Build graphical user interface (GUI) based on Microsoft Visual Basic using personal computer that could able read, save and display the energy consumption history.
1.5 Importance of Project
a) Save Electrical Energy.
Electrical energy can be control by user if they know how to manage their electrical or electronic equipment. This can be achieving if user have awareness about electrical consumption of their home.
b) Minimize Electricity Bills.
By saving electrical energy, it can effect to minimize user electricity utilities. Each month user did not know what make their electricity increase because they did not aware about the usage of electricity.
c) Save Greenhouse.
5
CHAPTER II
LITERATURE REVIEW
2.1 Overview
This chapter includes the background study regarding electrical usage, electricity power demand, journal and related about electrical consumption. This is important because it the reason why Home Electrical Energy Monitoring System should be developed and how important of the project need to done. It also will discuss about specification for main component of the project such as arduino microcontroller and current sensor.
2.2 Electricity Consumption
6
standards of living [9]. The rapid developments of many areas are the cause of the increasing demand in electricity consumption. Therefore, variety devices are develop to monitor the utilization of electricity and installed to provide awareness of the efficiency.
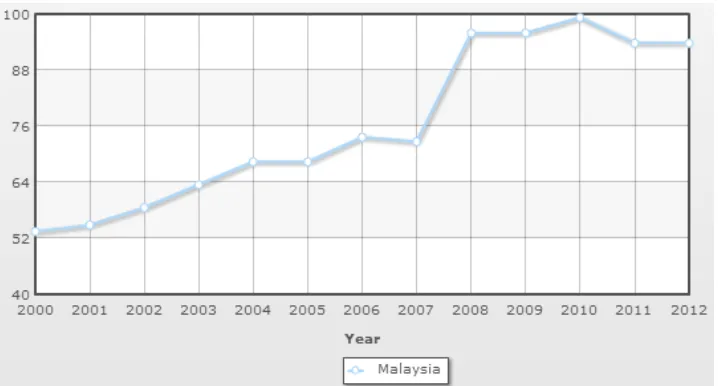
[image:22.595.158.517.303.496.2]Figure 2.1 shows the demand of electricity consumption proportionally to the years. The electricity consumption for a typical home that taking approximately 18 hours of electricity daily. Starting from 2000, the demands of electricity increasing dramatically approximately almost reach 100 billion kWh per year.
Figure 2.1: Electricity consumption (billion kWh) in Malaysia
2.3 Factor Contribute of Electricity in Home
7
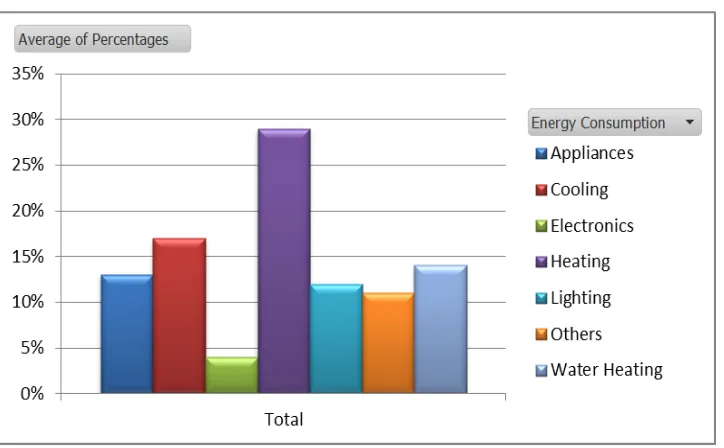
Figure 2.2: Energy Consumption For A Typical Home
All these aspects have been integrated to design a Home Electrical Energy Monitoring Electrical System. This product will be used to measure the electricity consumption and help the user to monitor of usage day-to-day. The purpose of this product is to overcome the wastage of electricity thus making the high level of awareness among consumers. In addition, this product will also monitor and record consumption of electricity daily. This is important because it allow users to estimate on their utilization.
Home electrical energy monitoring system is easy to handle, cheap and user friendly. The system is developed based on electronics, graphical user interface system and programming. The concept is every time users use electricity, GUI will show how many the amount used that they used. All information and notification will be displayed on the GUI. The system will enable users to manage and see the day-to-day usage of electricity. Instead, the users can compare the previous meter reading from suppliers to ensure that their electricity consumption synchronized.
8
2.4 Microcontroller Arduino
Arduino is an open-source single-board microcontroller. There many design or type of arduino such as UNO, Nano, Due, Fio and others. Each type have their own functionality and specification. It was designed to make the process of using electronics projects more accessible. The hardware consists with an Atmel AVR processor and on-board input/output support. The software that was used for arduino consists of a standard programming language compiler. Arduino hardware is programmed using a Wiring-based language (syntax and libraries) where it similar to C++ programming but it has some modifications on programming.
An Arduino board using of an 8-bit Atmel AVR microcontroller with complementary components that incorporation into other circuits. The Arduino has 14 digital I/O pins labelled 0 to 13 that can be used to turn motors and lights on and off and read the state of switches. Each digital pin can sink or source about 40 mA of current. Most boards include a 5 volt linear regulator and a 16 MHz crystal oscillator (or ceramic resonator in some variants). An Arduino microcontroller is also pre-programmed with a boot loader that simplifies uploading of programs to the on-chip flash memory, compared with other devices that typically need an external programmer.
To interact with the outside world, the program sets digital pins to a high or low value using C code instructions, which corresponds to +5 V or 0 V at the pin. The pin is connected to external interface electronics and then to the device being switched on and off. To determine the state of switches and other sensors, the Arduino is able to read the voltage value applied to its pins as a binary number. The interface circuitry translates the sensor signal into a 0 or +5 V signal applied to the digital I/O pin. If the pin is at 0 V, the program will read it as a 0 or LOW. If it is at +5 V, the program will read it as a 1 or HIGH.