R E S E A R C H A R T I C L E
Open Access
Use of general practice, diagnostic investigations
and hospital services before and after cancer
diagnosis - a population-based nationwide
registry study of 127,000 incident adult cancer
patients
Karina Garnier Christensen
*, Morten Fenger-Grøn, Kaare Rud Flarup and Peter Vedsted
Abstract
Background:Knowledge of patterns in cancer patients’health care utilisation around the time of diagnosis may guide health care resource allocation and provide important insights into this groups’demand for health care services. The health care need of patients with comorbid conditions far exceeds the oncology capacity and it is therefore important to elucidate the role of both primary and secondary care. The aim of this paper is to describe the use of health care services amongst incident cancer patients in Denmark one year before and one year after cancer diagnosis.
Methods:The present study is a national population-based case–control (1:10) registry study. All incident cancer patients (n = 127,210) diagnosed between 2001 and 2006 aged 40 years or older were identified in the Danish Cancer Registry. Data from national health registries were provided for all cancer patients and for 1,272,100 controls. Monthly consultation frequencies, monthly proportions of persons receiving health services and three-month incidence rate ratios for one year before and one year after the cancer diagnosis were calculated. Data were analysed separately for women and men.
Results:Three months before their diagnosis, cancer patients had twice as many general practitioner (GP) consultations, ten to eleven times more diagnostic investigations and five times more hospital contacts than the reference population. The demand for GP services peaked one month before diagnosis, the demand for diagnostic investigations one month after diagnosis and the number of hospital contacts three months after diagnosis. The proportion of cancer patients receiving each of these three types of health services remained more than 10% above that of the reference population from two months before diagnosis until the end of the study period. Conclusions:Cancer patients’health service utilisation rose dramatically three months before their diagnosis. This increase applied to all services in general throughout the first year after diagnosis and to the patients’use of hospital contacts in particular. Cancer patients’heightened demand for GP services one year after their diagnosis highlights the importance of close coordination and communication between the primary and the secondary healthcare sector.
Keywords:Cancer, General practice, Diagnostic, Hospital admission, Outpatient visit, Health services, Consultation, Registry study, Aftercare, Denmark
* Correspondence:k.christensen@alm.au.dk
The Research Unit for General Practice, Research Centre for Cancer Diagnosis in Primary Care (CaP), Aarhus University, Bartholins Allé 2, 8000, Aarhus C, Denmark
Background
One main task of a well-organised healthcare system is to effectively diagnose and treat serious diseases in a way that optimises the prognosis. Studies on the diagnosis of cancer suggest that non-conclusive initial visits and a long waiting period for investigations to be performed are likely to delay the diagnosis [1,2] which may have a negative effect on survival [3,4]. Up to 2020, we expect to see a 20% in-crease in the incidence of cancer; a growth that may be attributed to demographic changes and advances in medi-cine which means that more citizens will be living with cancer [5]. In this context, more knowledge of cancer patients’ patterns of demand for health care services be-fore as well as after their diagnosis is critical to identifying possibilities for improving both patient pathways and health care resource allocation.
A major concern in Denmark is that cancer patients have a poorer survival than patients in other European countries [6]. This has partly been explained by delay in cancer diagnosis and treatment [3,4,7]. More detailed knowledge of cancer patients’ health care resource demands and utilization patterns around the time of diagnosis may undoubtedly allow us to better organize health care supply and further shorten the time to cancer diagnosis, notably if particular health care utilizations patterns can be identified in large population-based cohorts. Data from such studies may prove even more valuable if combined with information on referral to diagnostic investigations and use of hospital services which would help us identify specific patterns of health care use rooted in current clinical or organizational inexpediencies. Such research would also serve the pur-pose of further substantiating or qualifying previous research. Apart from a comprehensive British survey which showed much variation in the number of consul-tations with cancer symptoms before hospital referral for suspected cancer [8], most previous studies have included fewer than 500 cancer patients and have sug-gested that before the time of diagnosis, cancer patients use their general practitioner (GP) less than controls [9,10] with GP consultation frequencies peaking in the first month after diagnosis [11].
Once a cancer patient has been diagnosed and treat-ment has been initiated, cancer trajectories are very dif-ferent. However, common for all cancers is the claimed lack of primary care involvement after discharge, which may be ascribed to patients being reluctant to go back to primary care and primary care not being there for the patients [12-16]. We therefore need a precise description of cancer patients’health care usage in primary and sec-ondary care after their cancer diagnosis. Such detailed knowledge would be particularly instrumental in identi-fying their need for health care services in the period after discharge from hospital.
The aim of this study was to describe incident adult cancer patients’ health service utilisation one year prior to and one year after their first cancer diagnosis.
Methods
Study design and setting
The present study was a population-based case–control registry study with a 1:10 age and gender matching. Data on health service utilisation were collected for a period spanning from one year before to one year after the date of cancer diagnosis. The date of diagnosis was extracted from the Danish Cancer Registry [17].
In Denmark, health care services are free and tax-financed. Nearly all citizens (98%) are registered with a particular general practice. GPs act as gatekeepers to most of the remaining health care providers and most cancer-specific investigations are performed in public hospitals after referral. Some diagnostic investigations (ultrasound and conventional x-ray), endoscopies and bi-opsies can also be made by private practising specialists. Although cancer treatment takes place in public hospi-tals which are in charge of the cancer patient’s treatment until he or she is discharged, the cancer patient needs continuous primary health care and cooperation be-tween the primary and the secondary sector is a corner-stone in a comprehensive, patient-centred approach. Furthermore, the number of patients with comorbid conditions and their health care need far exceed the on-cology capacity. It is therefore important to establish knowledge on the present role of primary care.
Study population
if they moved to another country during the observation period around the date of diagnosis, or if they got a second cancer (except for metastases with ICD10 codes C76-C80 and recurrent cancers in the same organ) in the two-year period after their incident cancer diagnosis.
Using incidence density sampling [20], we matched each cancer patient on gender and date of birth with ten controls from a reference population not registered with a cancer diagnosis in the Danish Cancer Registry until two years after the index date. The index date was defined as the date of diagnosis of the case. Persons born in 1930 or before were age-matched on the year of their birth because the groups were small. Controls could be sampled as controls more than once for different cases, but only once for the same case. The use of incidence density sampling meant that a control could also later be included as a cancer case (after two years).
Registry data
Data regarding date and type of cancer diagnoses were retrieved from the Danish Cancer Registry. Statistics Denmark conducted data linkage to the National Health Insurance Service Registry, the National Patient Dis-charge Registry, the Central Population Registry, the Registry of Causes of Death as well as to sociodemo-graphic and socioeconomic variables which were also
provided by Statistics Denmark. Personal registration numbers were pseudomised by Statistics Denmark which hosted the data. Approval was obtained from the Danish Data Protection Agency (journal no. 2009-41-3471), whereas approval from the Danish Ethical Committee is not required for registry studies.
[image:3.595.58.540.421.733.2]Data on primary and secondary health service utilisation were collected from 1 January 2000 through 31 December 2007. The study period spanned the period from one year before to one year after the cancer diagnosis. Data from the National Health Insurance Service Registry included the number of face-to-face consultations in general prac-tice in daytime and out-of-hours including home visits. Data regarding diagnostic investigations comprised x-ray (performed by radiologists), ultrasound (performed by gynaecologists and surgeons), endoscopies (performed by otorhinolaryngologists, gynaecologists, internists, surgeons and GPs) and biopsies (performed by otorhinolaryngolo-gists, ophthalmolootorhinolaryngolo-gists, dermatolootorhinolaryngolo-gists, gynaecolootorhinolaryngolo-gists, internists, surgeons, orthopaedic surgeons and GPs). Data from the National Patient Discharge Registry gave the number of somatic hospital admissions, outpatient visits and diagnostic investigations (x-ray, ultrasound, CAT scan, MRI scan, angiography, endoscopies and biopsies). Con-tacts for both discharged and non-discharged outpatients were included. Endoscopies included all endoscopies
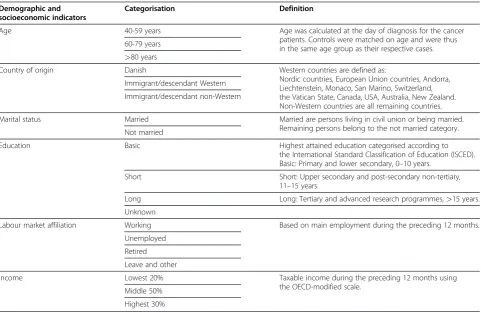
Table 1 Categorisation and definition of sociodemographic and socioeconomic indicators
Demographic and socioeconomic indicators
Categorisation Definition
Age 40-59 years Age was calculated at the day of diagnosis for the cancer
patients. Controls were matched on age and were thus in the same age group as their respective cases. 60-79 years
>80 years
Country of origin Danish Western countries are defined as:
Nordic countries, European Union countries, Andorra, Liechtenstein, Monaco, San Marino, Switzerland, the Vatican State, Canada, USA, Australia, New Zealand. Non-Western countries are all remaining countries. Immigrant/descendant Western
Immigrant/descendant non-Western
Marital status Married Married are persons living in civil union or being married.
Remaining persons belong to the not married category. Not married
Education Basic Highest attained education categorised according to
the International Standard Classification of Education (ISCED). Basic: Primary and lower secondary, 0–10 years.
Short Short: Upper secondary and post-secondary non-tertiary,
11–15 years.
Long Long: Tertiary and advanced research programmes,>15 years.
Unknown
Labour market affiliation Working Based on main employment during the preceding 12 months.
Unemployed
Retired
Leave and other
Income Lowest 20% Taxable income during the preceding 12 months using
the OECD-modified scale. Middle 50%
performed through natural body orifices only. Biopsies comprised all procedure codes containing the word biopsy in the descriptive text. For all variables from the National Patient Discharge Registry, only one event per category was included per day due to the complexity of the regis-trations in this registry. Age, gender and country of resi-dence were obtained from the Central Population Registry, while the date of death was obtained from the Registry of Causes of Death.
The demographic and socioeconomic variables included country of origin, marital status, taxable income using the OECD-modified scale [21], highest attained education categorised according to the International Standard Classi-fication of Education (ISCED) [22], and labour market af-filiation. Data were retrieved for the year of the diagnosis or index date, except for country of origin where the latest registered value was selected due to inconsistencies in the registrations. See Table 1 for definition and categorisation of these variables.
Outcome variables
The outcome measure was the incidence rate of health services received per month and per three months one year before and one year after diagnosis. The index date (date of cases’ cancer diagnoses) was contained in the month before the diagnosis. The proportion of persons receiving health services was calculated per month. Health services were collated into three groups: GP face-to-face consultations (daytime and out-of-hours), diagnostic investigations (primary and secondary sector) and hospital contacts.
Analysis
[image:4.595.57.540.346.719.2]The date of consultation provided by the National Health Insurance Service Registry was given as a week number which was converted into a date in order to be able to cal-culate the interval from the diagnostic date to the date at which the health care service was provided. A negative bi-nomial model was applied for the calculation of estimates
Table 2 Characteristics of the reference population and the cancer patients
Women Men
References Patients References Patients
Total (n (%)) 633,620 100.0 63,362 100.0 638,480 100.0 63,848 100.0
Age (years)
40-59 193,210 30.5 19,321 30.5 144,390 22.6 14,439 22.6
60-79 319,440 50.4 31,944 50.4 387,190 60.6 38,719 60.6
80+ 120,970 19.1 12,097 19.1 106,900 16.7 10,690 16.7
Country of origin
Danish 603,303 95.2 60,881 96.1 612,551 95.9 61,698 96.6
Immigrant/descendant Western country 17,723 2.8 1,652 2.6 13,396 2.1 1,281 2.0
Immigrant/descendant non-Western country 12,444 2.0 829 1.3 12,308 1.9 867 1.4
Marital status
Married 322,777 50.9 30,971 48.9 435,587 68.2 42,116 66.0
Not married 310,843 49.1 32,391 51.1 202,893 31.8 21,732 34.0
Education
Basic 279,425 44.1 28,461 44.9 228,450 35.8 23,319 36.5
Short 185,337 29.3 18,624 29.4 252,794 39.6 25,580 40.1
Long 81,025 12.8 7,777 12.3 84,125 13.2 7,640 12.0
Unknown 87,833 13.9 8,500 13.4 73,111 11.5 7,309 11.4
Labour market affiliation
Working 185,897 29.3 17,886 28.2 196,051 30.7 17,741 27.8
Unemployed 19,256 3.0 1,972 3.1 13,234 2.1 1,536 2.4
Retired 419,395 66.2 42,636 67.3 424,694 66.5 44,043 69.0
Leave and other 8,898 1.4 868 1.4 4,255 0.7 522 0.8
Income
Low 130,388 20.6 13,129 20.7 123,343 19.3 12,916 20.2
Middle 320,401 50.6 32,355 51.1 314,205 49.2 32,491 50.9
High 182,661 28.8 17,878 28.2 200,693 31.4 18,438 28.9
and corresponding 95% confidence intervals for monthly and three-month incidence rates and rate ratios between cancer patients and the reference population of GP con-sultations, diagnostic investigations and hospital contacts. Robust variance estimation with clustering on patient level was used. To account for differences in follow-up time (relevant after diagnosis only), log-transformed risk time was included in the model with the regression parameter restricted to 1. Censoring was thus done for all persons one year after the index date (date of diagnosis for cases) or when a person died, whichever came first. Separate analyses were performed for females and males, as gender-specific cancers represented 21% and 12% for women and men, respectively, and because it is known that men and women differ in their use of health care ser-vices [19]. Stata 12 was used for all analyses.
Results
The study included a total of 127,210 cancer patients and 1,272,100 age and gender-matched controls. Among cancer patients, 49.8% were women and 50.2% were men; the age group 60–79 years represented 50.4% of the women and 60.6% of the men (Table 2). Table 2 shows that the charac-teristics of the cancer patients and the reference population were similar with respect to country of origin, marital sta-tus, education, labour market affiliation and income.
[image:5.595.56.540.558.690.2]Before the cancer diagnosis
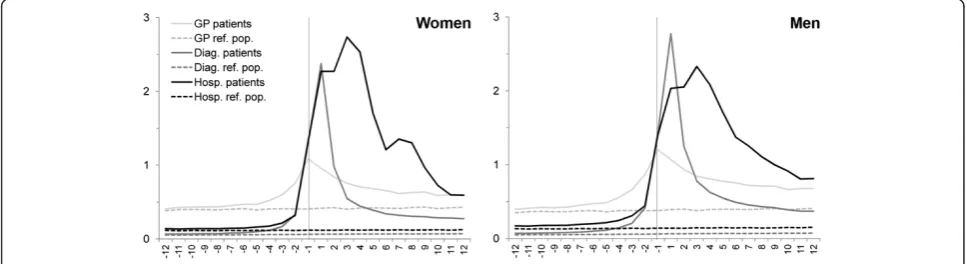
Figure 1 shows the monthly incidence rates for use of general practice, diagnostic investigations and hospital contacts for cancer patients and the reference popula-tion divided into women and men. GP consultapopula-tion pat-terns changed from a modest rise in both genders five to six months before diagnosis to a steep rise that peaked around one month before diagnosis. The number of diagnostic examinations and hospital contacts started to rise three to four months before diagnosis with a steep rise setting in two months before diagnosis.
Figure 2 shows the proportions of persons being in con-tact with the healthcare system each month. The same pattern was seen as for the monthly incidence rates. In the month up to the diagnosis, approx. 60% of the cancer patients were seen in general practice compared with approx. 25% of the reference population. Even more pro-nounced differences were found for hospital services and diagnostic investigations. Throughout the whole period before the diagnosis, cancer patients used more health care services than the reference population and the six months preceding their diagnosis saw a steep rise in their consumption of health care services (Table 3).
After the cancer diagnosis
After having received their diagnosis, cancer patients used more health care services than their controls after adjust-ing for death. Figure 1 shows a marked use of hospital ser-vices in the year after the diagnosis; yet, the use of diagnostic investigations, in particular, fell rapidly. The increased monthly use of general practice flattened off around six months after diagnosis; and one year after diag-nosis, the GP incidence rate was at the same level as for hospital services. Gender-specific consultation patterns were observed: men had more diagnostic investigations than women; whereas women had more hospital contacts than men. As seen in Figure 2, more than 80% of the can-cer patients received hospital services in the month after their diagnosis compared with less than 10% of the con-trols. The proportion of cancer patients receiving each of the three types of health services remained more than 10% above that for the controls from two months before diagnosis until the end of the study period (Figure 2). Twelve months after diagnosis, the proportion of cancer patients being in contact with GPs on a monthly basis was approx. 40% - which is slightly higher than the proportion of patients having hospital contacts.
Cancer patients’propensity to be in contact with general practice remained high: they had 43-73% more GP
consultations than the reference population 12 months after their diagnosis (Table 3); and this trend was even more pronounced for the use of diagnostic investigations and hospital services in the entire year after their diagnosis.
Discussion
Main findings
During the six months leading up to diagnosis, Danish cancer patients started using more primary and second-ary health care services than the reference population. It came as no surprise that they were also much more prone to be in contact with the health care system in the aftercare period. The timing of the peaks of use of spe-cific services indicates that for cancer patients as a group there is a time interval of some months between patients start attending general practice and the diagnosis.
Strengths and weaknesses
A strength of the present study is that we included a whole nation’s incident cancer patients. This gives the present study a high degree of statistical precision. An-other strength is that Danish health service registries are known to be valid [23,24] because of the completeness of the registration of the Danish population and the con-tinuity of registrations. The case–control study design was used to allow us to portray the baseline use of health care services of a reference population compar-able with the cancer patients. The characteristics of the two populations were very much alike, which represents a third strength of the present study.
[image:6.595.58.540.89.225.2]A weakness is that the date of diagnosis registered in the Danish Cancer Registry was systematically set to the first day in the month until 1 January 2004 where exact dates were introduced. Weaknesses in the validity that may arise because of changes in the definitions of vari-ables over time, changes in coding or data entry proce-dures did not seem to affect the data as the control
Figure 2Percentage of cancer patients and reference population receiving health services per month.Cancer patients (n = 63,362 women and 63,848 men). Reference population (n = 633,620 women and 638,480 men). The proportion was adjusted for time at risk. Vertical line indicates date of diagnosis. GP: General Practitioner; Diag.: Diagnostic investigations; Hosp.: Hospital contacts.
Table 3 Incidence rate ratios for three-monthly use of general practice, diagnostic investigations and hospital services
Women Men
Months from diagnosis
Services IRR 95% CI IRR 95% CI
−12 to−10 GP 1.07 1.06-1.09 1.13 1.12-1.15 Diagnostics 1.24 1.20-1.28 1.37 1.32-1.42
Hospital 1.21 1.18-1.25 1.31 1.28-1.35 −9 to−7 GP 1.10 1.09-1.11 1.17 1.16-1.19 Diagnostics 1.32 1.28-1.36 1.51 1.46-1.56
Hospital 1.24 1.21-1.28 1.38 1.35-1.42 −6 to−4 GP 1.20 1.19-1.21 1.34 1.33-1.36 Diagnostics 1.66 1.61-1.71 2.08 2.02-2.15
Hospital 1.39 1.35-1.43 1.64 1.60-1.68 −3 to−1 GP 1.97 1.96-1.99 2.38 2.36-2.39 Diagnostics 9.61 9.47-9.76 10.86 10.69-11.03
Hospital 5.27 5.20-5.34 5.16 5.09-5.23
1 to 3 GP 2.12 2.10-2.14 2.54 2.51-2.56
Diagnostics 24.49 24.11-24.87 29.20 28.73-29.67
Hospital 19.91 19.68-20.14 14.91 14.73-15.10
4 to 6 GP 1.67 1.65-1.69 2.05 2.02-2.07
Diagnostics 6.25 6.12-6.38 8.46 8.29-8.64
Hospital 15.11 14.89-15.34 12.08 11.90-12.27
7 to 9 GP 1.50 1.48-1.52 1.84 1.81-1.86
Diagnostics 4.88 4.77-4.99 6.42 6.27-6.57
Hospital 9.98 9.80-10.16 7.86 7.72-8.00
10 to 12 GP 1.43 1.41-1.45 1.73 1.70-1.75
Diagnostics 4.37 4.27-4.48 5.49 5.35-5.63
Hospital 5.29 5.19-5.40 5.82 5.71-5.94
Notes: IRR: Incidence rate ratio. 95% CI: 95% Confidence interval.
GP: Face-to-face contacts with GPs in both daytime and out-of-hours. Diagnostics: Diagnostic investigations including radiological investigations, ultrasound, endoscopies and biopsies.
Hospital: Admissions and outpatient visits.
[image:6.595.57.291.313.664.2]group’s use of health care services remained stable dur-ing the study period. We included all types of cancer as the study overall illustrates how cancer is treated within a healthcare system. Thus, differences between specific cancer types and groups of patients will undoubtedly exist as shown in a recently published British survey in-cluding 41,299 cancer patients [8]. Further research should investigate this while including the time period of the consultations.
Comparisons with other studies
The aforementioned comprehensive British survey found that women were more likely than men to have had three or more GP consultations before hospital referral [8]. In the present study, we found a similar GP consult-ation pattern for both genders prior to diagnosis. Aside from the British survey [8], few existing studies have elu-cidated cancer patients’health service utilisation around the time of diagnosis and they all studied fewer than 500 patients. Moreover, their methods, focus and results dif-fered which makes direct comparison difficult. A Dutch breast cancer study using GP records found that the per-centage of women seeing their GP peaked at 90% in the first month after diagnosis [11]; contrary to this, our study showed that the percentage of cancer patients see-ing their GP peaked in the month up to diagnosis at 63% for both men and women. A questionnaire study on delay in the diagnosis of colorectal cancer found that patients with a severe diagnostic delay had 2.5 consulta-tions before the disease was diagnosed compared with 1.3 visits among those patients without severe delay [25], but no information about the timing of the visits was given. An interview study combined with data from hospital records of gastrointestinal cancer patients found a mean interval of 10 weeks between GP consultation and hospital referral [26], while we found a time interval of some months between the start of attending general practice and the start of treatment for cancer patients as a group. In our study, the first observed peak was in GP consultations, which is in accordance with previous studies which have found that cancer patients first con-tact their GPs [16,27-29].
Implications for future research
The present study fills major gaps in current knowledge about cancer patients’ health service utilisation around the date of diagnosis and it hence identifies targets for organizational improvement and informs a future re-search agenda in this field. As previously suggested, the GPs seem to play an essential role in initiating cancer diagnosis [27,30]. One way of shortening the diagnostic interval could be to reduce the number of non-conclusive GP consultations by facilitating GPs access to fast and relevant diagnostic investigations, and by
optimizing the hospital-based treatment phase. We saw that the health care utilisation pattern started changing six months prior to the cancer diagnosis. Future studies should elucidate this period with regards to e.g. different cancer types, the specific health services given by the different providers and demographic and socioeconomic patient characteristics. Such studies may help identify clinical and organizational inexpediencies, which is crit-ical to optimal health care resource allocation and, not least, to patient pathway optimization.
The present study shows that 12 months after diagno-sis, primary care was, indeed, involved in aftercare as was the hospital sector. The claimed lack of primary care involvement after discharge could perhaps originate in the lack of clear communication regarding task distribu-tion as pointed out in a study on palliative home care for cancer patients [31]. Future research should investi-gate the organisation of aftercare in general and the transition between primary and secondary care in particular.
Conclusions
In cancer patients’pathway, the diagnostic window seems to open several months before the diagnosis is made as evidenced by a rising number of GP consultations, diag-nostic examinations and hospital contacts. Whether this pattern of health care use is a sign of insufficient clinical or organisational knowledge, this study cannot answer. However, there seems to be a possibility of reducing the time from GP consultation to diagnostic investigations and treatment. During the period after diagnosis, the use of all health care services remained increased with hospital contacts being most prevalent. Contacts with general practice were also increased during the first year after diagnosis which documents the importance of coordin-ation and planning of cancers patients’ post-treatment course to improve survival. Future studies must be per-formed as detailed studies of specific health care services provided to specific types of cancer patients and their ap-propriateness in relation to effectiveness and equity in order to optimise the delivery of health services.
Abbreviations
GP: General practitioner; ICD10: International Classification of Diseases version 10; ICD7: International Classification of Diseases version 7; CAT scan: Computed axial tomography scan; MRI scan: Magnetic resonance imaging scan; OECD: Organisation for Economic Co-operation and Development; ISCED: International Standard Classification of Education; IRR: Incidence rate ratio; 95% CI: 95% confidence interval.
Competing interests
The authors declare that they have no competing interests.
Authors’contributions
authors contributed to critically revising the paper. Finally, all authors read and approved the submitted manuscript.
Authors’information
Research Unit for General Practice and Research Centre for Cancer Diagnosis in Primary Care (CaP), Aarhus University, Bartholins Allé 2, 8000 Aarhus C, Denmark.
Acknowledgements
The study was funded by The Danish Cancer Society and the Novo Nordic Foundation. The funding sources were in no way involved in the research process.
Received: 8 March 2012 Accepted: 17 July 2012 Published: 28 July 2012
References
1. Foot C, Harrison T:How to improve cancer survival - Explaining England's relatively poor rates. London: The King's Fund; 2011.
2. Mitchell E, Macdonald S, Campbell NC, Weller D, Macleod U:Influences on pre-hospital delay in the diagnosis of colorectal cancer: a systematic review.Br J Cancer2008,98:60–70.
3. Torring ML, Frydenberg M, Hansen RP, Olesen F, Hamilton W, Vedsted P: Time to diagnosis and mortality in colorectal cancer: a cohort study in primary care.Br J Cancer2011,104:934–940.
4. Richards MA, Westcombe AM, Love SB, Littlejohns P, Ramirez AJ:Influence of delay on survival in patients with breast cancer: a systematic review. Lancet1999,353:1119–1126.
5. Albreht T, McKee M, Alexe DM, Coleman MP, Martin-Moreno JM:Making progress against cancer in Europe in 2008.Eur J Cancer2008, 44:1451–1456.
6. Coleman MP, Forman D, Bryant H, Butler J, Rachet B, Maringe C, Nur U, Tracey E, Coory M, Hatcher J,et al:Cancer survival in Australia, Canada, Denmark, Norway, Sweden, and the UK, 1995–2007 (the International Cancer Benchmarking Partnership): an analysis of population-based cancer registry data.Lancet2011,377:127–138.
7. Jensen AR, Nellemann HM, Overgaard J:Tumor progression in waiting time for radiotherapy in head and neck cancer.Radiother Oncol2007, 84:5–10.
8. Lyratzopoulos G, Neal RD, Barbiere JM, Rubin GP, Abel GA:Variation in number of general practitioner consultations before hospital referral for cancer: findings from the 2010 National Cancer Patient Experience Survey in England.Lancet Oncol2012,13:353–365.
9. Summerton N, Rigby AS, Mann S, Summerton AM:The general
practitioner-patient consultation pattern as a tool for cancer diagnosis in general practice.Br J Gen Pract2003,53:50–52.
10. Olesen F:The pattern of attendance at general practice in the years before the diagnosis of cervical cancer. A case control study.Scand J Prim Health Care1988,6:199–203.
11. Roorda C, de Bock GH, van der Veen WJ, Lindeman A, Jansen L, van der Meer K:Role of the general practitioner during the active breast cancer treatment phase: an analysis of health care use.Support Care Cancer 2011,20:705–714.
12. Dalsted RJ, Guassora AD, Thorsen T:Danish general practitioners only play a minor role in the coordination of cancer treatment.Dan Med Bull2011, 58:A4222.
13. Mikkelsen TH, Soendergaard J, Jensen AB, Olesen F:Cancer surviving patients' rehabilitation - understanding failure through application of theoretical perspectives from Habermas.BMC Health Serv Res2008, 8:122–135.
14. Lewis RA, Neal RD, Hendry M, France B, Williams NH, Russell D, Hughes DA, Russell I, Stuart NS, Weller D,et al:Patients' and healthcare professionals' views of cancer follow-up: systematic review.Br J Gen Pract2009, 59:e248–e259.
15. Anvik T, Holtedahl KA, Mikalsen H:"When patients have cancer, they stop seeing me" - The role of the general practitioner in early follow-up of patients with cancer - A qualitative study.BMC Fam Pract2006,7. 16. Allgar VL, Neal RD:General practictioners' management of cancer in
England: secondary analysis of data from the National Survey of NHS Patients-Cancer.Eur J Cancer Care (Engl)2005,14:409–416.
17. MacLennan R:Items of patient information which may be collected by registries. InCancer Registration: Principles and Methods. 95th edition. Edited by Jensen OM, Parkin DM, MacLennan R, Muir CS, Skeet RG. Lyon: International Agency for Research on Cancer; 1991:43–63.
18. National Board of Health:[Common standards for the basic registration of hospital patients 2006]. Copenhagen: National Board of Health; 2005. 19. Juel K, Christensen K:Are men seeking medical advice too late?
Contacts to general practitioners and hospital admissions in Denmark 2005.J Public Health (Oxf )2008,30:111–113.
20. Xue X, Hoover DR:Statistical methods in cancer epidemiological studies. Methods Mol Biol2009,471:239–272.
21. De Vos K, Zaidi MA:Equivalence scale sensitivity of poverty statistics for the member states of the European community.Rev Income Wealth1997, 43:319–333.
22. UNESCO:International Standard Classification of Education ISCED. Montreal: UNESCO; 1997. ISBN 92-9189-035-9.
23. Olivarius NF, Hollnagel H, Krasnik A, Pedersen PA, Thorsen H:The Danish National Health Service Register. A tool for primary health care research. Dan Med Bull1997,44:449–453.
24. Sorensen HT, Sabroe S, Olsen J:A framework for evaluation of secondary data sources for epidemiological research.Int J Epidemiol 1996,25:435–442.
25. Turunen MJ, Peltokallio P:Delay in the diagnosis of colorectal cancer. Ann Chir Gynaecol1982,71:277–282.
26. Macadam DB:A study in general practice of the symptoms and delay patterns in the diagnosis of gastrointestinal cancer.J R Coll Gen Pract 1979,29:723–729.
27. Hansen RP, Olesen F, Sorensen HT, Sokolowski I, Sondergaard J: Socioeconomic patient characteristics predict delay in cancer diagnosis: a Danish cohort study.BMC Health Serv Res2008,8:49–59.
28. Demagny L, Holtedahl K, Bachimont J, Thorsen T, Letourmy A, Bungener M: General practitioners' role in cancer care: a French-Norwegian study. BMC Res Notes2009,2:200–206.
29. Campbell NC, Macleod U, Weller D:Primary care oncology: essential if high quality cancer care is to be achieved for all.Fam Pract2002, 19:577–578.
30. Allgar VL, Neal RD:Delays in the diagnosis of six cancers: analysis of data from the National Survey of NHS Patients: Cancer.Br J Cancer2005, 92:1959–1970.
31. Brogaard T, Jensen AB, Sokolowski I, Olesen F, Neergaard MA:Who is the key worker in palliative home care?Scand J Prim Health Care2011, 29:150–156.
doi:10.1186/1472-6963-12-224
Cite this article as:Christensenet al.:Use of general practice, diagnostic investigations and hospital services before and after cancer diagnosis -a popul-ation-b-ased n-ationwide registry study of 127,000 incident -adult
cancer patients.BMC Health Services Research201212:224.
Submit your next manuscript to BioMed Central and take full advantage of:
• Convenient online submission
• Thorough peer review
• No space constraints or color figure charges
• Immediate publication on acceptance
• Inclusion in PubMed, CAS, Scopus and Google Scholar
• Research which is freely available for redistribution