R E S E A R C H A R T I C L E
Open Access
Empirical assessment of sequencing errors for
high throughput pyrosequencing data
Paulo GS da Fonseca
1,2*, Jorge AP Paiva
3, Luiz GP Almeida
4, Ana TR Vasconcelos
4and Ana T Freitas
1,5Abstract
Background: Sequencing-by-synthesis technologies significantly improve over the Sanger method in terms of speed and cost per base. However, they still usually fail to compete in terms of read length and quality. Current high-throughput implementations of the pyrosequencing technique yield reads whose length approach those of the capillary electrophoresis method. A less obvious question is whether their quality is affected by platform-specific sequencing errors.
Results: We present an empirical study aimed at assessing the quality and characterising sequencing errors for high throughput pyrosequencing data. We have developed a procedure for extracting sequencing error data from genome assemblies and study their characteristics, in particular the length distribution of indel gaps and their relation to the sequence contexts where they occur. We used this procedure to analyse data from three prokaryotic genomes sequenced with the GS FLX technology. We also compared two models previously employed with success for peptide sequence alignment.
Conclusions: We observed an overall very low error rate in the analysed data, with indel errors being much more abundant than substitutions. We also observed a dependence between the length of the gaps and that of the homopolymer context where they occur. As with protein alignments, a power-law model seems to approximate the indel errors more accurately, although the results are not so conclusive as to justify a depart from the commonly used affine gap penalty scheme. In whichever case, however, our procedure can be used to estimate more realistic error model parameters.
Background
High throughput sequencing technology (HTST) has been changing the landscape of biomedical research, allowing for issues like genetic variation to be analysed at a much higher resolution and lower cost [1]. However, the accumulation of massive amounts of sequence data has brought back to the spotlight old bioinformatics prob-lems of string pattern matching and fragment assembly which, although not completely solved, had been satis-factorily dealt with in the context of traditional capillary electrophoresis sequencing over the last years. The dif-ficulties raised by HTST stem naturally from the sheer
*Correspondence: [email protected]
1Instituto de Engenharia de Sistemas e Computadores: Investigação e Desenvolvimento (INESC-ID), R. Alves Redol 9, Lisboa 1000-029, Portugal 2Centro de Informática–Universidade Federal de Pernambuco, Av. Jornalista Anibal Fernandes s/n, Cidade Universitária Recife - PE 50740-560, Brasil Full list of author information is available at the end of the article
volume of data produced but also from their character-istics, in particular the relative smaller read size and the platform-specific sequencing errors.
Mainstream competing HTSTs offer different trade-offs in terms of throughput, cost and sequence characteristics, including read length and accuracy [2]. Common to them all is the use of highly parallelisedsequencing-by-synthesis
procedures that dispense with the laborious bacterial clone library preparation in favour of specialised forms of in vitro amplification of the single-stranded DNA library templates. In the pyrosequencing methodology [3] commercialised by Roche/454 Life Sciences through their GS FLX™ platform [4] the process is carried out in cycles during which a solution of each of the four distinct deoxribonucleotide triphosphates (dNTP) is, in turn, flowed into a substrate containing the immobilised single stranded DNA template and the DNA polymerase. The eventual polymerase-mediated incorporation of complementary dNTPs to the template triggers a chain
of reactions involving chemiluminescent enzymes also present in the medium resulting in the emission of a burst of light of intensity proportional to the number of nucleotides added. This process is highly parallelised as the solid-phase substrate (the PicoTiterPlate) is organ-ised as an array of over a million and a half independent spots, each corresponding to a well containing one bead to which million copies of a same template molecule are attached. The light emitted at each cycle and at each spot is captured by a coupled digital imaging device, producing a series of pictures which are processed by an image-analysis program, giving rise to theflowgrams(the pyrosequencing counterparts of Sanger chromatograms) from which the identity of the templates can be inferred.
The GS FLX system yields reads a few hundred bases long with an overall quality that has allowed forde novo
as well as reference-basedresequencingprojects to be car-ried out successfully [5,6]. Nevertheless, like other HTSTs, it cannot prescind from error modelling and correction strategies. They remain indispensable in order to compen-sate for the platform-specific sequencing artefacts and to tell them apart from natural variability.
In the pyrosequencing method, the greatest source of error corresponds to under or over-estimation of the number of incorporated bases at each cycle because of the noise in the luminescence signal. Actually, the sig-nal intensity is translated into a numerical value (the flow value) which roughly corresponds to the number of incorporated bases. However this value can some-times be ambiguous. For instance a flow value of 3.5 may corresponds to three or four incorporated bases? It is the job of the base caller program to take care of this uncertainty and call the correct number of bases. Base callers like PyroBayes [7] use Bayesian methods to calculate the maximum a posteriori (MAP) estimate for the number of incorporated bases ngiven a flow value
f, using prior probabilities for the homopolymer lengths
P(n)and the likelihood of the observed flow value given the homopolymer lengths,P(f|n). These latter values are estimated from alignments of test fragments to a ref-erence sequence. PyroNoise [8] handles the problem of flowgram noise in a similar fashion but considering a data set of flowgrams (reads) as a whole. The method is based on a ‘distance’ that reflects the probability that a flowgram was generated by a given sequence. It then considers the set of flowgrams as being generated by a mixture model in which each component corresponds to a different sequence and the mixing coefficients indi-cate the relative abundance of the sequences in the set. Then it uses an EM algorithm (using latent variables that indicate which sequence gave rise to each flowgram) to estimate the model parameters, thus obtaining the de-noised set of sequences that most likely originated the flowgrams.
A few studies have been published which investigate the sequencing error characteristics of GS FLX data through the analysis of the sequence data. An early study by Huse et al. [9] assessed the quality of reads of a PCR amplicon library prepared from 43 reference templates containing rRNA genes produced with the GS20 technology. The observed overall error rate was of 0.49%, of which over 60% were insertion or deletions (indels) and 16% substi-tutions. Errors were found to be evenly distributed within each read but not among reads, with a very small percent-age of low quality reads accounting for a large fraction of the errors. This analysis was challenged on a recent study by Gilles et al. [10] which considered reads obtained from control DNA fragments over three runs of the GS FLX Titanium protocol. They analysed the effect of sev-eral variables on the error rate distribution, including read length, the position of the error within the read, homopolymer effects, and the physical position of the bead on the PicoTiterPlate. Not only the mean error rate was higher than the one reported by Huse et al., 1.07%, but the conclusions also diverged in many important ways. Gilles and collaborators observed that virtually 90% of the reads contained errors (as opposed to only 18% observed by Huse and coauthors) and that the errors were nonran-domly distributed within these reads, with a degradation towards the 3’ end. They observed a significant effect of the other variables but found that none of them alone accounted for the error rate distribution, suggesting that the variation in the error rate resulted from higher order interactions of the explanatory variables.
to build an empirical model for the errors. This model takes into account the nucleotide type, the position in the read, and the sequence context in which the errors occur by considering the three bases preceding the error and the base following the error. The analysis of a 454 data set containing aligned plasmid control sequences revealed average error rate figures inline with previous studies, but with a very limited positional effect. Homopolymer effects were also reported based on the analysis of the most common sequence error contexts.
Despite the aforementioned efforts to understand the error distributions of GS FLX data, no model is yet estab-lished as a standard. Application-specific error models are generally employed for some flexibility in the use of the reads, whether in de novo or resequencing applica-tions. This usually amounts to scoring local alignments between a read and some other reads in the data set or a reference sequence, allowing for mismatches, inser-tions and deleinser-tions according to certain penalty schemes. A read may be classified as erroneous (and hence dis-carded) if its best alignment score deviates significantly from an exact match score. Most read alignment algo-rithms use an affine error model which penalises insertion or deletion (indel) gaps by attributing a fixed cost to a gap initiation and then a fixed cost to each additional gap position. This approach is simple to interpret and bene-fits from efficient quadratic-time dynamic programming implementations [14] but, due to the nature of pyrose-quencing, it is debatable whether this uniformity is faithful to the underlying phenomena. Indeed, most studies seem to confirm that errors in long homopolymers are more common and so should be less heavily penalised. One could argue whether a convex penalty model, in which gap costs increase, for instance, according to a logarith-mic function, would me more appropriate. Such models have already been successfully shown to fit biological sequence alignment data [15] and sub-cubic implementa-tions of the corresponding optimal alignment algorithm exist [16].
In this study, we aimed at analysing the quality of the reads produced by the GS FLX instruments. Apart from assessing the overall sequencing error rates, our spe-cific objective was to test whether the ubiquitous affine model is suitable for modelling high-throughput pyrose-quencing errors, in comparison with a convex error sat-uration model used, for instance, in protein sequence alignment. Likewise, we analyse whether the length of the gaps could be influenced by the length and compo-sition of the homopolymer in which they occur, which could motivate the use of a more specific model. Our procedure uses plain sequence data and can be used by users of most read mappers to estimate sensible values for the parameters corresponding to the costs of errors of various kinds.
Methods
The problem of modelling the errors of a specific sequenc-ing platform can be approached at many different levels of abstraction since each step of the process is prone to introduce errors. In the GS FLX automated sequencing-by-synthesis procedure, the prevalent type of error relates to the size of homopolymers. These errors can occur, for instance, because of an insufficient supply of free dNTPs at a given cycle, leading to an incomplete exten-sion of a homopolymer stretch. On top of those basic chemical-level issues, there is the problem of captur-ing and interpretcaptur-ing the weak and noisy luminescent signals to determine the exact number of incorporated bases, which becomes particularly hard as the length of the homopolymer grows. Taking into account errors at the lowest levels requires comprehensive and specialised knowledge and control over the process which are usually inaccessible to end users and even bioinformatics special-ists. Typically the lowest level data available are the SFF files containing the flowgrams. Some methods approach the issue of sequencing errors at this level by analysing data ‘in the flowspace’ [7,8,11,12].
The GS FLX pipeline includes conservative filters to rule out ambiguous spots, which usually results in a sig-nificant decrease in the number of useable reads, from about 1.6 million to a few hundred thousands. Despite that, one can still expect some errors to make it through to the sequence level, specially in genomes containing long homopolymers. Here we propose to tackle the problem at this level, which makes the method more universally accessible, even when the flowgrams are not available. Conceptually, our approach consists in comparing the reads produced by the instrument with the actual tem-plate sequences to count the number of sequencing errors of a few distinct types, and then fitting the values to an empirical model that reflects some basic knowledge about the ‘mechanics’ of the sequencing procedure.
Data preparation
thus need to somehow infer the most plausible alignments from the available data, using also some knowledge about the sequenced samples and the underlying sequencing technology.
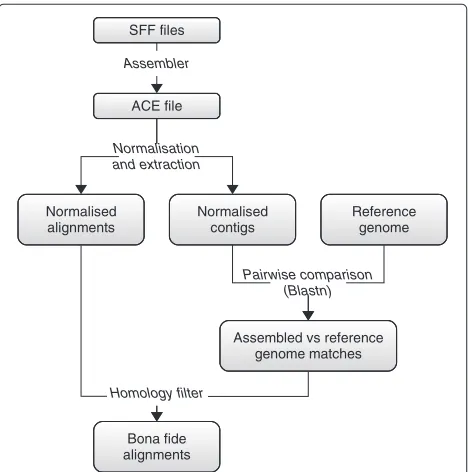
Our data set construction strategy, depicted in Figure 1, stands upon two concepts: redundancy (coverage) and homology (conservation). Starting with the flowgram files (SFF) produced by the sequencer, we use an automatic
de novo genome assembler to reconstruct the original genome. This results in an ACE file that describes how a certain number of contigs are formed from a patchwork of the original reads (or pieces of them). During the assem-bly, a minimum overlap is required between reads so that they can be stitched together. Consequently, every posi-tion of a contig is ‘covered’ by multiple overlapping reads. This redundancy is usually regarded as an indicator of the veracity of the assembled contigs, the idea being that errors eventually introduced in some reads are unlikely to be consistently reproduced over the other reads covering the same region.
At this point, we have an initial collection of matches of reads against the assembled contigs. Concretely, from the ACE file we extract a set of alignments{(Ci,Rj)}between pieces of contigs,Ci, and reads, or pieces of reads,Rj. As part of the assembly process, the reads can be padded so that they fit together, meaning that some positions of a givenRjorCimay actually be gaps ‘-’. We then distinguish four cases concerning individual columns of an alignment as follows. An alignment column xy, forx,y ∈ {A,G,C,T} means that the base xat that position was read asy. If
SFF files
ACE file
Normalised alignments
Normalised contigs
Assembler
Reference genome
Assembled vs reference genome matches
Bona fide alignments
Normalisation and extraction
Pairwise comparison (Blastn)
[image:4.595.57.291.466.702.2]Homology filter
Figure 1Data set construction workflow.Data set construction workflow.
x = ythen no error occurred, whereas ifx = ythen we have asubstitution error. An alignment column x-means that the basexof the contig (template) was skipped, i.e., not sequenced. We call this adeletion error. Similarly, an alignment column-ymeans thatywas introduced by error in the read. We call this aninsertion error. Finally, we can have an ill-defined column--, which may happen because, as said, the template is covered by multiple reads and we can have some of those reads with an insertion error at a given position and the others without this error. Neverthe-less, these latter will also have a ‘-’ padded at that position in order to comply with the former. For example, in the situation
Contig :AAGGCC-GTTGCGGC R1 :AAGGCC-GTT R2 : GGCC-GTTGCG
R3 : CCCGTTGCGGC
the read R3 has an extraCat its third position with respect to the other reads, and so a ‘-’ is inserted in the corre-sponding positions of the other reads. To correct this, we need to normalise the pairwise read-contig alignments, which essentially corresponds to removing these gap-only columns. After this step, we have a set of normalised alignments{(Ci,Rj)}.
Although a reasonable level of redundancy (coverage) confers some credibility to the obtained contigs, we take a further step to ensure that they do correspond to the actual sequences of the template molecules before taking their alignments into account. For this purpose, we look for homologous regions in the genome G of a closely related species, which we take as input. For each normalised alignment (Ci,Rj), we use BLASTN to find matches of Ci in G, using minimum identity and max-imum e-value cutoffs of Imin and Emax, to determine whether the hit corresponds to a sufficiently conserved region to be trusted. IfCipasses this homology filter, then we regard(Ci,Rj)as abone fidealignment. To summarise, our contention is that, if the obtained contigs are homol-ogous to sequences of a close, independently sequenced genome, then they must be real. Moreover, since they result from a multiple alignment of reads, then these align-ments, and hence the sequencing events they represent, are also assumed to be faithful.
Model evaluation
model can be crafted to capture its essential characteris-tics. However, the more information we add to the model, the more likely it is to become too complex and to overfit the data. Ideally, we would like to keep it simple enough so as to have convenient analytical and computational prop-erties, which may imply using known functional forms even at the cost of some accuracy.
It has already been reported that the most common sequencing errors in the GS FLX platform are insertions and deletions, with substitutions being much less fre-quent [9]. To assess the relative abundance of the different insertion and deletion (indel) gap lengths, we extracted the length of each observed gap from the alignment data and adjusted these values to two model distributions as follows.
In the first model, we assume that each position con-tributes equally to the overall probability of the gap. Put another way, the ratio between the probabilities of two consecutive gap lengths is constant. This is what is assumed by many tools (e.g. [17,18]), which use linear (or affine) functions to score the alignments. In this model, the probability for an observed gap to have length exactly
k=1, 2,. . .is given by
PG[X=k;β]=βk−1(1−β), (1)
where 0 ≤ β ≤ 1 is the contribution of each position. Since (1) is a geometric distribution, we refer to this as the
geometric model.
To contrast with the widespread geometric model, we considered fitting the data to a Zipfian distribution, which has the form
PZ[X=k;σ]= 1/kσ
L
j=11/jσ
=Ck−σ, (2)
whereσ > 0 is the parameter that controls the shape,L
is set to the maximum gap length andC=(Lj=11/jσ)−1 is a normalising constant. The Zipfian distribution has already been successfully employed to model indel gap lengths in other contexts [15] and it is used to derive convex scoring functions for the alignments [19].
In order to compare the adequacy of the two models, we obtain maximum likelihood estimators for each of them with respect to the gap length datax= (x1,. . .,xN), that is,β(ˆ x)andσ (ˆ x). We then measure the overall discrep-ancy between the observed frequencies of each gap length and its maximum likelihood prediction by computing the Pearson’sχ2statistic
χ2(x)=
L
k=1
(Ok−Ek)2/Ek (3)
where Ok is the observed number of gaps of length k andEk is its expected number of occurrences, given by
N ·P[k;βˆ] andN·P[k;σˆ] , for the geometric and Zip-fian models respectively. The bigger the value of χ2(x) the poorer the fit, since this value is a sum of squared residuals.
The indel errors in the massively parallel pyrosequenc-ing technique arise mainly due to the lack of precision in the conversion of the luminescence signal. It has been reported that this tends to be aggravated as the length of the homopolymer corresponding to the signal grows since a linear correspondence between signal intensity and sequence length cannot be assured beyond a certain number of bases [5]. To check to what extent this is indeed a problem in practice, we separate the gaps by homopoly-mercontext. We define the context of a gap as follows. Let us consider the general form of a homopolymer deletion gap (the insertion case is analogous), that is
· · ·xi· · ·xj xj+1· · ·xk xk+1· · ·xs· · · · · ·yi· · ·yj − · · · − yk+1· · ·ys· · ·,
where the sequence of identical non-gap symbolsxj+1 = · · · = xk = α have been deleted. The left flank of the context of this deletion is defined as the maximal
sequence of matches withxi = yi = · · · = xj = yj =
α. Similarly, the right flank of the context is defined as the maximal sequence of matches withxk+1 = yk+1 = · · · = xs = ys = α. Notice that either part may be empty. Then, the overall context of this gap of lenghk−j
[image:5.595.57.542.608.723.2]is the homopolymerxi· · ·xs. Hence, for example, in the
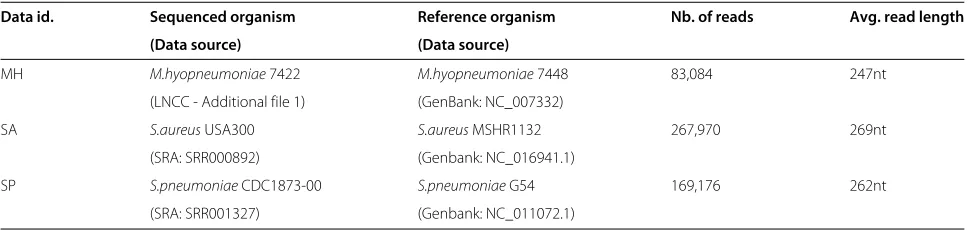
Table 1 Data sets
Data id. Sequenced organism Reference organism Nb. of reads Avg. read length
(Data source) (Data source)
MH M.hyopneumoniae7422 M.hyopneumoniae7448 83,084 247nt (LNCC - Additional file 1) (GenBank: NC_007332)
SA S.aureusUSA300 S.aureusMSHR1132 267,970 269nt
(SRA: SRR000892) (Genbank: NC_016941.1)
SP S.pneumoniaeCDC1873-00 S.pneumoniaeG54 169,176 262nt (SRA: SRR001327) (Genbank: NC_011072.1)
Table 2 Assembly data
Data id. Assembler Nb. of Assembly N50 / N80
contigs size
MH Newbler 102 981,106 27,323 / 10,189
Celera 282 1,011,888 10,963 / 4,287
SA Newbler 66 2,971,290 143,335 / 56,013
Celera 691 3,162,318 52,376 / 17,400
SP Newbler 178 2,223,061 30,556 / 18,166
Celera 671 2,331,216 15,133 / 6,442
Genome assemblies data summary. ‘Assembly size’ corresponds to the overall sum of the lengths of the contigs. The N50 (respectively N80) value corresponds to the largest contig lengthLsuch that the contigs of length≥Lcontain at least 50% (resp. 80%) of the bases in the assembly.
alignmentAACCCCCAATG-TAT-AC--CC---GGTG-, the gap contexts, from left to right, will beAA,CCCCC,AA,T,GGandT.
We perform two-sample Mann-Whitney tests for each pair of contexts to determine if their gap lengths come from the same distribution. Incidentally, these tests also serve to determine if there are significant differences in the gap lengths according to the composition of the contexts.
Results and discussion
We illustrate this discussion with the results of the analy-ses performed on three data sets, summarised in Table 1. To avoid an eventual instrument-specific bias, we used data obtained from different sites. The MH sequenc-ing was carried out at the LNCC, in Brazil. The SA and SP reads were obtained from the SRA, as indicated in Table 1, the sequencing data being provided by the WUGSC and the JCVI, respectively, both in the USA. Since we were interested in assessing the error charac-teristics of the GS FLX platform, our analyses considered the assemblies produced by the GS De NovoAssembler [4], commonly referred to as Newbler, which is pro-vided as the ‘official’ platform software. Because of the alignment data construction strategy discussed above and illustrated in Figure 1, the analysis will be, in principle, assembler-specific. The fact that we use only assembled fragments that match a reference sequence obtained inde-pendently will hopefully mitigate this influence of the
assembler tool. However, in order to check the robustness of our conclusions, we also performed the analyses with the Celera WGS assembler, which has been successfully adapted to work with GS FLX data [20]. All assemblies were produced with Newbler version 2.3 and Celera WGS assembler version 7.0 with default parameters.
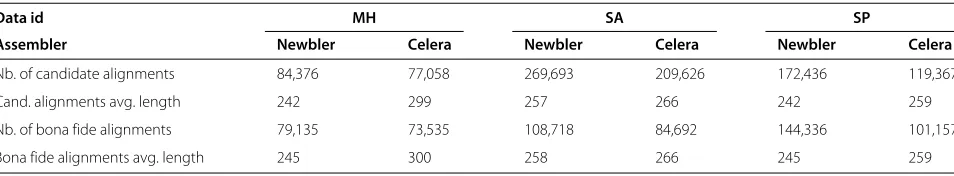
The results of the assembly step are summarised in Table 2. Although the overall assembly sizes are very sim-ilar, we see that Newbler consistently produced fewer contigs. Not only it yielded less contigs, but the N50/N80 statistics also favour Newbler over the WGS-assembler. That said, we note that those global properties of the assemblies are only of relative importance to our analysis because we care only about the local alignment informa-tion. The ACE files containing the automatic assemblies were processed according to the pipeline described in ‘Methods’, withIminandEmax set to 0.8 and 0.01 respec-tively. The number and average length of the extracted alignments, both the intermediate candidate alignments, obtained after normalisation, and the finalbona fideones, are shown in Table 3. For the analyses, we pooled together all these data, resulting in an a global data set of 332,189 alignments spanning 82,837,778 positions for Newbler, and 259,384 alignments spanning 70,835,968 positions for the WGS assembler.
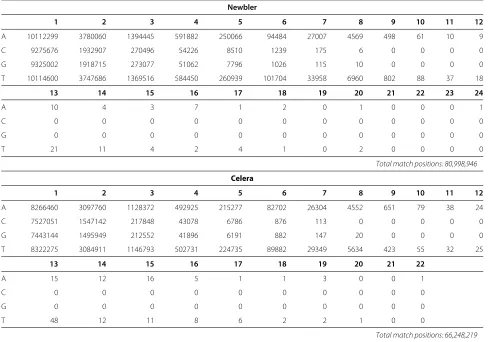
First, we examine the overall characteristics of the extracted errors. Table 4 summarizes the exact match occurrences. We group these occurrences by mers since the actual sequencing occurs one homopoly-mer at a time. We include here only exact matches between homopolymers that are not in the context of a gap (see Methods). We notice that the matches con-centrate on homopolymers of length up to 7-8, not only because they are easier to sequence but mainly because they are much more abundant. For Newbler, the exact match alignments cover 97.78% of the total aligned posi-tions, and for the Celera assembler, 93.52%, which indi-cates a very low sequencing error rate in general, and in particular when the official assembler is used, a testimony of the very conservative filters applied by this platform.
[image:6.595.59.536.636.724.2]The substitution errors are summarised in Table 5. We have observed 665,969 substitutions for Newbler which account for only 0.08% of the total positions. For the
Table 3 Alignment data summary
Data id MH SA SP
Assembler Newbler Celera Newbler Celera Newbler Celera
Nb. of candidate alignments 84,376 77,058 269,693 209,626 172,436 119,367
Cand. alignments avg. length 242 299 257 266 242 259
Nb. of bona fide alignments 79,135 73,535 108,718 84,692 144,336 101,157
Bona fide alignments avg. length 245 300 258 266 245 259
Table 4 Homopolymer exact match occurrences
Newbler
1 2 3 4 5 6 7 8 9 10 11 12
A 10112299 3780060 1394445 591882 250066 94484 27007 4569 498 61 10 9
C 9275676 1932907 270496 54226 8510 1239 175 6 0 0 0 0
G 9325002 1918715 273077 51062 7796 1026 115 10 0 0 0 0
T 10114600 3747686 1369516 584450 260939 101704 33958 6960 802 88 37 18
13 14 15 16 17 18 19 20 21 22 23 24
A 10 4 3 7 1 2 0 1 0 0 0 1
C 0 0 0 0 0 0 0 0 0 0 0 0
G 0 0 0 0 0 0 0 0 0 0 0 0
T 21 11 4 2 4 1 0 2 0 0 0 0
Total match positions: 80,998,946
Celera
1 2 3 4 5 6 7 8 9 10 11 12
A 8266460 3097760 1128372 492925 215277 82702 26304 4552 651 79 38 24
C 7527051 1547142 217848 43078 6786 876 113 0 0 0 0 0
G 7443144 1495949 212552 41896 6191 882 147 20 0 0 0 0
T 8322275 3084911 1146793 502731 224735 89882 29349 5634 423 55 32 25
13 14 15 16 17 18 19 20 21 22
A 15 12 16 5 1 1 3 0 0 1
C 0 0 0 0 0 0 0 0 0 0
G 0 0 0 0 0 0 0 0 0 0
T 48 12 11 8 6 2 2 1 0 0
Total match positions: 66,248,219
Homopolymer exact match occurrences. The row indicates the base of the homopolymer and the column indicates its length. Thus for example, there were 7796 exact match alignments ofGGGGGin the Newbler data set, and only 111 ofTTTTTTTTTTTTTTTin the Celera assembler data set.
Table 5 Base substitutions
Newbler
A C G T
A 0 (0%) 74588 (11.2%) 63823 (9.58%) 92787 (13.93%)
C 26505 (3.98%) 0 (0%) 49970 (7.5%) 41064 (6.17%)
G 23442 (3.52%) 48670 (7.31%) 0 (0%) 51326 (7.71%)
T 53587 (8.05%) 72148 (10.83%) 68059 (10.22%) 0 (%)
Total substitutions: 665,969
Celera
A C G T
A 0 (0%) 314368 (9.48%) 298435 (9%) 454647 (13.71%)
C 215248 (6.49%) 0 (0%) 155494 (4.69%) 220471 (6.65%)
G 214762 (6.48%) 155015 (4.67%) 0 (0%) 214063 (6.46%)
T 449989 (13.57%) 310634 (9.37%) 312819 (9.43%) 0 (0%)
Total substitutions: 3,315,945
The cell at rowxand columnyindicates the number of occurrences of the alignment columnxyin the data set, that is, the number of times the basexwas substituted
[image:7.595.57.540.508.711.2]Celera assembler, this absolute proportion was signifi-cantly higher, at about 4.6%. This, combined with the observation of the alignment lengths of Table 3 indicates that the WGS assembler privileges longer reads and is more permissive as for substitutions, which is not surpris-ing given its Sanger sequencsurpris-ing origins. With Newbler, although the substitution error rate is very low in absolute terms, if we regard the number of substitutions relative to the overall number of errors (including indels), we have that they account for about 50% of the total number of errors in this data set (665969/(665969+389063+287991)), which is quite significant, although in comparison this is a lower proportion than what is observed in other technologies [21]. With the Celera assembler, substitu-tions account for over 77% of the errors, again possibly
due to its excessive tolerance towards mismatches. We observe a bias towards C/G substitutions relative to A/T (∼ 22% vs.∼ 12% in Newbler, and∼ 27% vs.∼ 9% in Celera).
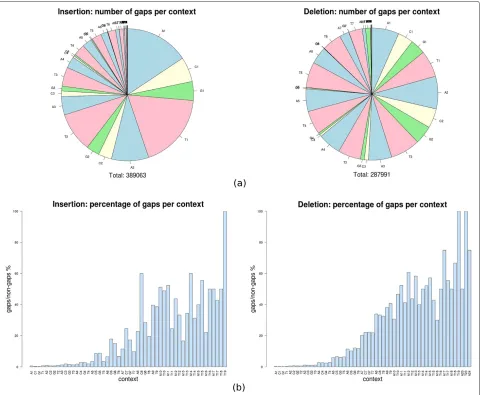
[image:8.595.59.542.292.687.2]Next, we examine the number of indel errors per con-text, which are illustrated in Figure 2(a). We notice that the absolute number of insertion gaps decreases with the size of the context, which is not surprising, given the relatively lower number of large contexts themselves. Indeed, if we compute the ratio between the number of occurrences of a given homopolymer as an indel context and the number of its exact match alignments, we observe a clear ten-dency for the chance of having a gap in a homopolymer to increase with its length, as can be seen in Figure 2(b). Data shown in Figure 2 concern the Newbler assembler. The
equivalent graphics for the WGS assembler reveal qualita-tively similar patterns and can be found in the Additional file 2.
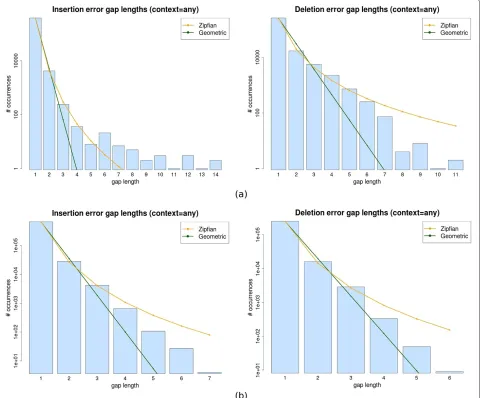
The distribution of gap lengths is illustrated in Figure 3, which shows the histograms of the lengths of insertion (left) and deletion (right) gaps for both Newbler (top) and Celera assembler (bottom). As it can be seen, there is a dominant abundance of gaps of size one and the histograms are somewhat evocative of a power-law distri-bution. We notice that the Celera gaps tend to be smaller in average, again in line with its Sanger sequencing origins. We wanted to compare the approximations of the gap length data with Geometric and Zipfian models, as explained in Methods. In order to visually compare the fits of these models, we plotted the residuals in the two
[image:9.595.60.541.293.691.2]scenarios using both the Newbler and WGS assembler data. This information is summarised in Figure 4 which shows the value of the Pearson’sχ2statistic for the max-imum likelihood fits of the insertion and deletion gap lengths for each context. The graphics show that the Zip-fian sums of squared residuals (yellow bars) are up to a few orders of magnitude smaller than the Geometric (green bars) ones (notice the log scale of the graph), thus evidenc-ing the fact that the Zipfian approximation is much closer to the actual distribution of gap lengths for any context (which is also suggested by the best fit curves in Figure 3). However, despite this difference, theχ2 goodness-of-fit tests do not allow us to claim that the Zipfian is the right approximation, with P-values varying haphazardly depending on the context, and often being not significant
Figure 4Goodness of fit assessment.χ2statistics of maximum likelihood fits per context (insertion gaps on the left, deletion gaps on the right) for the Newbler(a), and WGS assembler data(b). The first pair of bars in each graph correspond to any context (context=*). The remaining pairs of bars correspond to the contexts listed in the usual orderA1,C1,G1,T1,A2,C2,G2,T2,...
enough to support the null hypothesis (see Additional files 2 and 3 for the full results).
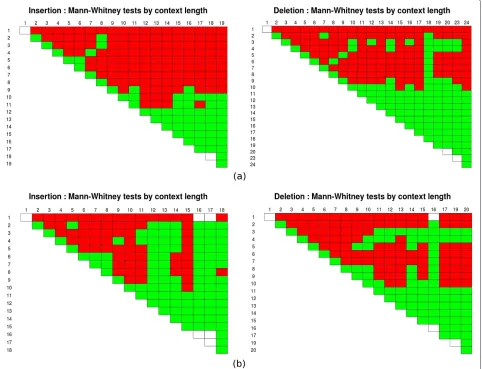
The next question to be addressed is whether there are significant changes in the gap length distributions according to the context. We tested whether the insertion and deletion gap lengths come from the same distribu-tion for each pair of contexts using both the Newbler and WGS assembler data. To help us establish a pattern and to circumvent the lack of data which may render the test approximations imprecise, we summarised this infor-mation by performing the same kind of test, this time grouping the contexts by length. The graphics in Figure 5 display the results of these tests (for the full results, see Additional files 2 and 3) for every pairwise combination of insertion (left) or deletion(right) context length. In the cell with coordinates (i,j), we have the test of the null
Figure 5Mann-Whitney tests for the gap length data.Mann-Whitney tests for the gap length data per context length using Newbler(a)and WGS assembler data(b). In each graphic, the cell(i,j)contains the result of the test of the null hypothesisH0: the gaps from contexts of lengthsi andjcome from the same distribution, against the alternative hypothesisH1: they do not come from the same distribution. The cell is shown in red if the null hypothesis is rejected at the significance levelα=1%, or in green otherwise.
are longer and hence the difference between their lengths relatively smaller, and for which there is much less data. These factors make the tests in those cases less accurate. Overall, these tests seem to confirm an influence of the context, in particular of its length to its corresponding gap lengths.
Conclusion
We have presented an empirical study aimed at char-acterising the sequencing errors occurring in massively parallel pyrosequencing technology. We have devised a procedure to generate data sets ofbona fidealignments in which these sequencing errors are represented as mis-matches and gaps. We evaluated general patterns of inci-dence of the substitutions and indel errors, and more specifically the distribution of the indel lengths and the influence of the sequence context to this length. Inspired
conservative filters applied by the GS FLX platform do enforce a high sequence quality, as demonstrated by the very low rates of error per base. We postulate, however that, for 454 pyrosequencing data, the procedure that we have implemented to carry out this study can still offer a viable alternative for the estimation of realistic parameters for alignment scoring functions in a principled manner, in contrast to arbitrary values often used by many tools in an
ad hocfashion.
Availability of supporting data
Additional files, including supporting data and source code for the software used in this study (Additional file 1), as well as the complete results (Additional files 2 and 3), are available from our supporting website http://kdbio.inesc-id.pt/∼pgsf/pyroseq_err.
Additional files
Additional file 1: Compressed archive containing the source code (in Shell script, Python and R) and the analysed data sets (ACE and FASTA files).
Additional file 2: Full results of the experiments for the Celera WGS assembler.
Additional file 3: Full results of the experiments for the Newbler assembler.
Competing interests
The authors declare that they have no competing interests.
Authors’ contributions
PF and AF conceived the study. JP, LA and AV produced the sequence data and genome assemblies. PF implemented the software and carried out the experiments. All authors have contributed to the analysis of the results. PF wrote the manuscript. All authors have revised, read and approved the manuscript.
Author details
1Instituto de Engenharia de Sistemas e Computadores: Investigação e
Desenvolvimento (INESC-ID), R. Alves Redol 9, Lisboa 1000-029, Portugal.
2Centro de Informática–Universidade Federal de Pernambuco, Av. Jornalista
Anibal Fernandes s/n, Cidade Universitária Recife - PE 50740-560, Brasil.
3Instituto de Investigação Científica Tropical (IICT), Centro de Florestas e dos
Produtos Florestais, Tapada da Ajuda, Lisboa 1349-018, Portugal.4Laboratório
Nacional de Computação Científica (LNCC), Laboratório de Bioinformática, Av. Getúlio Vargas, 333 Petrópolis, Rio de Janeiro, Brasil.5Instituto Superior
Técnico–Universidade Técnica de Lisboa (IST/UTL), Av. Rovisco Pais, Lisboa 1049-001, Portugal.
Acknowledgements
The authors would like to acknowledge Arlindo Oliveira and Susana Vinga for the helpful discussions. This work was supported by national funds through FCT—Fundação para a Ciência e a Tecnologia (Portugal), under projects PEst-OE/EEI/LA0021/2011 (PF) and PTDC/EIA-EIA/112283/2009 (PF, AF), by the FCT Ciência 2008 Research Contract financed by POPH/QREN (JP), and by the Brazilian CNPq and FAPERJ (LA, AV).
Received: 16 January 2012 Accepted: 27 November 2012 Published: 22 January 2013
References
1. Mardis ER:The impact of next-generation sequencing technology on genetics.Trends Genet2008,24(3):133–141. [http://www.ncbi.nlm.nih. gov/entrez/query.fcgi?db=pubmed&cmd=Retrieve&dopt=
AbstractPlus&list_uids=18262675]
2. Shendure J, Ji H:Next-generation DNA sequencing.Nat Biotechnol 2008,26(10):1135–1145. [http://www.ncbi.nlm.nih.gov/entrez/query.fcgi? db=pubmed&cmd=Retrieve&dopt=AbstractPlus&list_uids=18846087] 3. Ahmadian A, Ehn M, Hober S:Pyrosequencing: history, biochemistry
and future.Clin Chim Acta2006,363(1-2):83–94. [http://www.ncbi.nlm. nih.gov/entrez/query.fcgi?db=pubmed&cmd=Retrieve&dopt= AbstractPlus&list_uids=16165119]
4. Droege M, Hill B:The Genome Sequencer FLX System–longer reads, more applications, straight forward bioinformatics and more complete data sets.J Biotechnol2008,136(1-2):3–10. [http://www.ncbi. nlm.nih.gov/entrez/query.fcgi?db=pubmed&cmd=Retrieve&dopt= AbstractPlus&list_uids=18616967]
5. Margulies M, Egholm M, Altman WE, Attiya S, Bader JS, Bemben LA, Berka J, Braverman MS, Chen YJ, Chen Z, Dewell SB, Du L, Fierro JM, Gomes XV, Godwin BC, He W, Helgesen S, Ho CH, Irzyk GP, Jando SC, Alenquer MLI, Jarvie TP, Jirage KB, Kim JB, Knight JR, Lanza JR, Leamon JH, Lefkowitz SM, Lei M, Li J, Lohman KL, Lu H, Makhijani VB, McDade KE, McKenna MP, Myers EW, Nickerson E, Nobile JR, Plant R, Puc BP, Ronan MT, Roth GT, Sarkis GJ, Simons JF, Simpson JW, Srinivasan M, Tartaro KR, Tomasz A, Vogt KA, Volkmer GA, Wang SH, Wang Y, Weiner MP, Yu P, Begley RF, Rothberg JM:Genome sequencing in microfabricated high-density picolitre reactors.Nature2005,437(7057):376–380. [http://www.ncbi. nlm.nih.gov/entrez/query.fcgi?db=pubmed&cmd=Retrieve&dopt= AbstractPlus&list_uids=16056220]
6. Wheeler DA, Srinivasan M, Egholm M, Shen Y, Chen L, McGuire A, He W, Chen YJ, Makhijani V, Roth GT, Gomes X, Tartaro K, Niazi F, Turcotte CL, Irzyk GP, Lupski JR, Chinault C, zhi Song X, Liu Y, Yuan Y, Nazareth L, Qin X, Muzny DM, Margulies M, Weinstock GM, Gibbs RA, Rothberg JM:The complete genome of an individual by massively parallel DNA sequencing.Nature2008,452(7189):872–876. [http://www.nature.com/ nature/journal/v452/n7189/full/nature06884.html]
7. Quinlan AR, Stewart DA, Strömberg MP, Marth GT:Pyrobayes: an improved base caller for SNP discovery in pyrosequences.Nat Methods2008,5(2):179–181. [http://www.nature.com/nmeth/journal/v5/ n2/full/nmeth.1172.html]
8. Quince C, Lanzén A, Curtis TP, Davenport RJ, Hall N, Head IM, Read LF, Sloan WT:Accurate determination of microbial diversity from 454 pyrosequencing data.Nat Methods2009,6(9):639–641. [http://www. nature.com/nmeth/journal/v6/n9/full/nmeth.1361.html]
9. Huse SM, Huber JA, Morrison HG, Sogin ML, Welch DM:Accuracy and quality of massively parallel DNA pyrosequencing.Genome Biol2007, 8(7):R143. [http://genomebiology.com/2007/8/7/R143]
10. Gilles A, Meglécz E, Pech N, Ferreira S, Malausa T, Martin JF:Accuracy and quality assessment of 454 GS-FLX Titanium pyrosequencing.BMC Genomics2011,12:245. [http://www.biomedcentral.com/1471-2164/12/ 245]
11. Balzer S, Malde K, Lanzén A, Sharma A, Jonassen I:Characteristics of 454 pyrosequencing data–enabling realistic simulation with flowsim. Bioinformatics2010,26(18):i420–i425. [http://bioinformatics. oxfordjournals.org/content/26/18/i420.long]
12. Balzer S, Malde K, Jonassen I:Systematic exploration of error sources in pyrosequencing flowgram data.Bioinformatics2011,27(13):i304–i309. [http://bioinformatics.oxfordjournals.org/content/27/13/i304.long] 13. McElroy KE, Luciani F, Thomas T:GemSIM: general, error-model based
simulator of next-generation sequencing data.BMC Genomics2012, 13:74. [http://www.biomedcentral.com/1471-2164/13/74]
14. Gotoh O:An improved algorithm for matching biological sequences. J Mol Biol1982,162(3):705–708. [http://www.sciencedirect.com/science/ article/pii/0022283682903989]
15. Benner SA, Cohen MA, Gonnet GH:Empirical and structural models for insertions and deletions in the divergent evolution of proteins.J Mol Biol1993,229(4):1065–1082. [http://www.sciencedirect.com/science? _ob=ArticleURL&_udi=B6WK7-45PV5P8-8K&_user=
2474893&_coverDate=02]
16. Miller W, Myers EW:Sequence comparison with concave weighting functions.Bull Math Biol1988,50(2):97–120. [http://www.ncbi.nlm.nih. gov/sites/entrez?Db=pubmed&Cmd=Retrieve&list_uids=
3207952&dopt=abstractplus]
18. Langmead B, Salzberg SL:Fast gapped-read alignment with Bowtie 2. Nat Methods2012,9(4):357–359. [http://www.nature.com/nmeth/ journal/v9/n4/full/nmeth.1923.html].
19. Cartwright RA:Logarithmic gap costs decrease alignment accuracy.BMC Bioinformatics2006,7:527. [http://www.biomedcentral. com/1471-2105/7/527].
20. Miller JR, Delcher AL, Koren S, Venter E, Walenz BP, Brownley A, Johnson J, Li K, Mobarry C, Sutton G:Aggressive assembly of pyrosequencing reads with mates.Bioinformatics2008,24(24):2818–2824. [http:// bioinformatics.oxfordjournals.org/content/24/24/2818.long] 21. Dohm JC, Lottaz C, Borodina T, Himmelbauer H:Substantial biases in
ultra-short read data sets from high-throughput DNA sequencing. Nucleic Acids Res2008,36(16):e105. [http://nar.oxfordjournals.org/cgi/ content/full/36/16/e105]
doi:10.1186/1756-0500-6-25
Cite this article as:da Fonsecaet al.:Empirical assessment of sequencing errors for high throughput pyrosequencing data. BMC Research Notes 20136:25.
Submit your next manuscript to BioMed Central and take full advantage of:
• Convenient online submission
• Thorough peer review
• No space constraints or color figure charges
• Immediate publication on acceptance
• Inclusion in PubMed, CAS, Scopus and Google Scholar
• Research which is freely available for redistribution