Utilization of an Electrochemiluminescence Sensor for Atropine
Determination in Complex Matrices
Kelly Brown,
†Moira McMenemy,
†Matthew Palmer,
†Matthew J. Baker,
†David W. Robinson,
‡Pamela Allan,
†and Lynn Dennany
*
,††WestCHEM Department of Pure and Applied Chemistry, University of Strathclyde, Technology and Innovation Centre 99 George
Street, Glasgow, G1 1RD, United Kingdom
‡School of Forensic and Applied Sciences, University of Central Lancashire, Lancashire, PR1 2XT, United Kingdom
*
S Supporting InformationABSTRACT: A major challenge within forensic science is the development of accurate and robust methodologies that can be utilized on-site for detection at crime scenes and can be used for analyzing multiple sample types. The recent expansion of electrochemical sensors to tackle this hurdle requires sensors that can undergo analysis without any pretreatment. Given the vast array of samples that are submitted for forensic analysis, this can pose a major challenge for all electrochemical sensors, including electrochemiluminescent (ECL)-based sensors. Within this contribution, we demonstrate the capacity for an ECL-based sensor to address this challenge and it is potential to detect and quantify atropine from a wide range of samples
directly from herbal material to spiked solutions. This portable platform demonstrates satisfactory analytical parameters with linearity across a concentration range of 0.75 to 100μM, reproducibility of 3.0%, repeatability of 9.2%, and a detection limit of
∼0.75μM. The sensor displays good selectivity toward alkaloid species and, in particular, the hallucinogenic tropane alkaloid functionality within complex matrices. This portable sensor provides rapid detection alongside low cost and operational simplicity, thus, providing a basis for the exploitation of ECL-based sensors within the forensic arena.
T
he exploitation of illicit substances continues to be a global issue further exacerbated by the ever changing nature of the global drug market. This has proved particularly challenging with the increasing presence of novel psychoactive substances (NPS).1−3 Traditional methodologies such as high performance liquid chromatography mass spectrometry (HPLC-MS) and gas chromatography mass spectrometry (GC-MS) remain the gold standard laboratory based analytical techniques in forensic analysis. However, there is a growing need for rapid, sensitive, and inexpensive detection systems for in-field analysis of both illicit substances and poisons in clinical and law enforcement environments.4 The main screening methods currently in use, which primarily consist of colorimetric presumptive tests whose color changes indicate the presence of a specific drug class, are often inadequate for NPS, while their poor selectivity hinders their reliability across all drug classes.4 In addition, these screening methods cannot be ascribed effectively to all forensic samples, limiting their use in-field. Electrochemical platforms such as electrochemilumi-nescence (ECL) can address these challenges, presenting a unique opportunity to address the current gap in forensic practices for rapid and crude identification of illicit and poisonous substances.Atropine is a tropane alkaloid found within certain plants of thesolanaceusfamily, includingDaturaandAtropa belladonna.
Its anticholinergic hallucinogenic behavior, due to its antagonist actions toward the acetylcholine receptors, makes the tropane alkaloid ideal as a poison, while its hallucinogenic effects make it appealing as a recreational drug.5 Atropine is considered one of the most important tropane alkaloids used for medical purposes, where it is employed for the treatment of Parkinson’s disease6,7to slow down the progression of myopia8 and as a treatment for organophosphate poisoning.9In contrast to other popular naturally occurring recreational drugs, such as cannabis, atropine and scopolamine producing species remain largely unregulated in many countries; indeed, pharmaceutics containing the tropane alkaloid can often be obtained without a medical prescription.5
The use of atropine as a poison is not a novel concept, as is highlighted by the 1994 case of Dr. Paul Agutter. Dr Agutter, a biology professor at Edinburgh Napier University, attempted to murder his wife by spiking her gin and tonic with the deadly tropane alkaloid. Agutter subsequently attempted to divert suspicion by lacing multiple bottles of tonic, before returning the poisoned bottles to the supermarket shelf, resulting in mass panic when a number of people in the Edinburgh area fell ill.10
Received: June 26, 2019
Accepted: August 22, 2019
Published: August 22, 2019
Article
pubs.acs.org/ac Cite This:Anal. Chem.XXXX, XXX, XXX−XXX
© XXXX American Chemical Society A DOI:10.1021/acs.analchem.9b02905 Anal. Chem.XXXX, XXX, XXX−XXX License, which permits unrestricted use, distribution and reproduction in any medium,
provided the author and source are cited.
Downloaded via UNIV OF STRATHCLYDE on September 17, 2019 at 09:16:36 (UTC).
appealing, particularly for in-field applications. In addition, when considering the concentrations of 0.35 mM to 1 mM6 used by Paul Agutter did not result in any fatalities, it therefore becomes apparent that the higher concentrations required for effective poisoning and onset of symptoms could thus be easily detected utilizing basic electrochemical sensors.6
Although current electrochemical techniques have been applied to a wide variety of different sample matrices, including urine,1 6,1 8−2 0 blood,1 8,2 0 pharmaceutical prepara-tions,17,19,21−23,6,19,22−24 and nonideal buffers such as Coca-Cola,6 to date no one has reported the direct detection of atropine withinDaturaplant species without prior separation strategies14,15,24or lengthy extraction procedures employed to isolate the tropane alkaloid species.22
Here we report on the proof-of-concept for the potential application of an ECL-based detection strategy, using atropine as a model alkaloid-based drug, on several potential forensic samples. We have shown for thefirst time the ability to directly detect a species within plant material through mechanical application onto an electrode surface, eliminating the need to perform any extraction procedures, thus, providing a proof-of-concept for an in-field portable sensor using Datura to highlight potential applications of ECL sensors as drug screening tools with minimal sample preparation.
■
EXPERIMENTAL SECTIONMaterials.Tris (2,2′-bipyridyl)-dichlororuthenium(II) hex-ahydrate ([Ru(bpy)3]·Cl2·6H2O), atropine sulfate monohy-drate, lithium perchlorate (LiClO4), and nafion 117 (∼5% mixture of lower aliphatic alcohols and water) were purchased from Sigma-Aldrich. Absolute EtOH was purchased from VWR chemicals. All chemicals were used as received. All solutions were prepared in Milli-Q water (18 mΩ cm). Datura plant species were grown from seed in house and harvested as required.Solanum lycopersicum(tomato plant), Coca-Cola, and tonic water were commercially purchased.
Instrumentation.A CH instrument model 760D electro-chemical analyzer was used for all electroelectro-chemical and electrochemiluminescence measurements. GSI Technologies Electrochemical carbon screen-printed electrodes (SPE) with a 4 mm carbon working electrode, carbon counter electrode, and Ag reference electrode were used for all electrochemical measurements with a 100 μL sample volume. ECL emission was recorded via a Hamamatsu H10723-20 photomultiplier tube (PMT) enclosed within a light-tight Faraday cage. The PMT was positioned directly above the working electrode surface through the use of a specially designed sensor holder.
through ultrasonication in 10 mL of aqueous LiClO4adjusted to pH 8 for 30 min. For direct detection within plant material, Datura or tomato leaf was mechanically applied to the modified electrode surface and 100 μL of electrolyte cast on top to provide the required conductance.
■
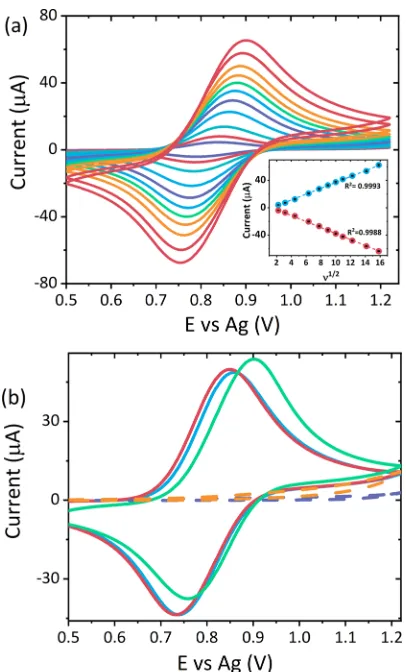
RESULTS AND DISCUSSIONElectrochemical Characterization. The electrochemical behavior of atropine was interrogated on both unmodified and nafion confined [Ru(bpy)3]2+-modified screen-printed carbon electrodes through CV.Figure 1a shows the typical voltammo-grams obtained for ruthenium-modified electrodes with 0.1 M LiClO4 across multiple scan rates. The modified electrode displayed the expected anodic and cathodic peaks of the Ru2+/ Ru3+couple at∼0.95 and∼0.82 V versus Ag, respectively. At sufficiently slow scan rates the peak-to-peak separation (ΔEp) is close to zero, the full width half-maximum (fwhm) is close to the theoretical value of 90.6 mV for a one electron process of surface-confined species,25,26 and peak current varies linearly with the square root of the scan rate, as shown in the inset of Figure 1a. The broad non-Gaussian peaks and the nonzero ΔEp at higher scan rates highlight deviation from the ideal behavior of surface-confined species. This is not unexpected and has been previously reported for nafion-based [Ru-(bpy)3]2+ films that display semi-infinite diffusion attributed to the cluster-type structure of nafion and slow mass transfer through the film accounting for the largeΔEp.27−29However, this behavior is consistent with semi-infinite linear diffusion and the homogeneous charge transfer diffusion coefficient, DCT, is in good agreement with those values previously reported.26,30
In contrast to previous studies,6,18−20,22 atropine displayed no distinctive electrochemical behavior at the concentrations of interest for the unmodified carbon screen printed electrodes across this potential range, as shown inFigure 1b. However, at higher concentrations, an anodic peak at∼0.89 V was observed (see Figure S1). Atropine has previously been shown to produce an ECL response in the presence of [Ru(bpy)3]2+by undergoing a similar mediated oxidation process, as observed for an amine species of similar structure.16,31−36By undergoing mediated oxidation via homogeneous electron transfer between the Ru3+ generated in situ and atropine within solution. The occurrence of the mediated oxidative process resulting in oxidation of atropine and the subsequent ECL response can be further confirmed by interrogation of the CV signals observed at the ruthenium-modified electrode at different atropine concentrations. As the concentration of
atropine increases, the oxidation peak of the Ru3+ species grows, while the reduction peak for the regeneration of the Ru2+species decreases, as shown byFigure 1b. This behavior is consistent with electrochemical reactions, which are mediated by Ru3+ centers.37 As the oxidation route of atropine is not kinetically favorable at the electrode surface, it mainly proceeds via the Ru3+centers to generate ECL emission shown inFigure 2. As such, there are fewer Ru3+ species available to undergo reduction to regenerate Ru2+on the reverse scan. As such, the reduction current is observed to decease as the atropine concentration, and hence, consumption of Ru3+increases.
ECL Detection of Atropine. Mechanisms recently
suggested for the production of atropine ECL signals propose a cyclic reaction mechanism, seeing the regeneration of atropine alongside Ru2+.17 However, here we observed the oxidation of atropine to be a chemically irreversible process, where the electro-oxidation of atropine results in the generation of formaldehyde and likely formation of a secondary amine at the tropane ring system as a result of electrolyticN-dealkylation. The presence of formaldehyde was confirmed through the Hehner’s test,38 where prior to any electrochemical reactions, atropine produced a negative result,
but following the generation of ECL, a violet ring was formed at the interface between the milk and H2SO4containing trace amounts of potassium persulfate. Our proposed oxidative-reduction mechanism is shown in eqs 1−5, where the Ru3+ species generated at the electrode surface oxidizes atropine, following eq 2, forming the highly reducing intermediated atropine•(a neutral radical species (b)). This intermediate acts as the coreactant, generating the excited Ru2+*state through homogeneous electron transfer, which in turn generates the imminium cation (c) as the product. Electrolytic N-deal-kylation, shown in Scheme 1, then occurs forming form-aldehyde (f) and the secondary amine species noratropine (e) via hydrolysis producing (d) and subsequent decomposition of the imminium cation. This dealkylation mechanism is consistent with those previously reported by Leroy et al.21 and Bagheri et al.19for the electro-oxidation of atropine via CV and with those observed for the electrochemical oxidation of tropanes and aliphatic tertiary amines.39,40
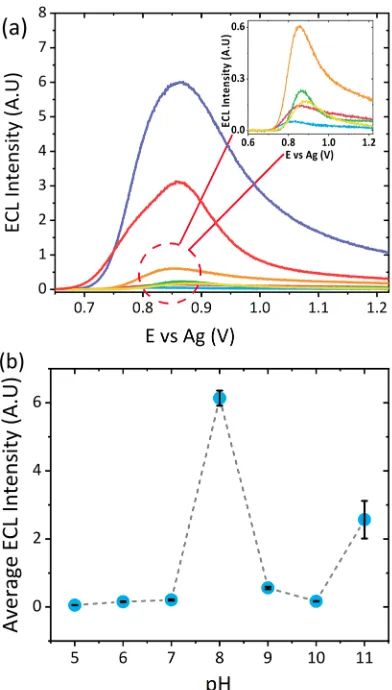
Effect of pH on ECL Response. pH influences the ECL response of atropine and similar amine species, where the greatest signal is obtained at values close to its pKa.16,17,23,35 The influence on pH was investigated between pH 5 and pH 11 at an atropine concentration of 50 μM. The ECL signal increased from pH 5 to pH 8, reaching a maximum at pH 8, which is close to the reported pKavalue of 9.85 and as such was chosen as the optimum pH upon which all further analyses were performed.41A further increase in pH above 8 resulted in a dramatic decrease in signal, before an increase was observed at pH 11, see Figure 3a. Upon reaching pH 9, the alkaline conditions likely lead to a signal decrease due to a quenching effect as a result of a side reaction between the hydroxyl anions and the generated [Ru(bpy)3]3+.16The subsequent increase in signal at pH 11 and the broadening of this peak suggest the emergence of a second electroactive species. The appearance of this second species is thought to be the result of a base-catalyzed degradation of atropine in the presence of a high concentration of hydroxide ions, likely leading to the formation of tropine and tropic acid.42The ECL responses observed for tropine and tropic acid can be found inFigure S2.
Ru(bpy)32 Ru(bpy)33 e
[ ] +↔ [ ]+ + − (1)
Ru(bpy)33 atropine atropine Ru(bpy)32
[ ]+ + → •++ [ ]+
[image:3.608.71.274.56.392.2](2) Figure 1. (a) CV responses of a ruthenium-modified electrode
between 5 and 250 mV s−1in 0.1 M LiClO
4over a potential range of
0.5≤ν≤1.22 V vs Ag. The inset shows the linear dependence of current against ν1/2. (b) Typical CV responses obtained from an
unmodified SPE carbon electrode with 50μM atropine sulfate (orange) and without (purple), ruthenium film modified electrode with no coreactant (blue) and in the presence of 50μM atropine sulfate (pink), and 1 mM atropine sulfate (green) at a scan rate of 100 mV s−1over the potential range 0.5≤ν≤1.22 V vs Ag with 0.1 M
LiClO4as the electrolyte.
Figure 2. ECL signals recorded simultaneously with the modified electrode traces fromFigure 1a at a PMT setting of 0.5 V.
[image:3.608.331.536.56.230.2]atropine•+→atropine• (3)
Ru(bpy)33 atropine Ru(bpy)32 (e) (f)
[ ]+ + •→ [ ] * ++ +
(4)
h
Ru(bpy)32 Ru(bpy)32 ν
[ ] * → [+ ]+ + (5)
Influence of Atropine Concentration. The impact of atropine concentration on ECL response was investigated across a concentration range of 0.75 to 100μM. This range is comparable to those previously reported for the detection of atropine via electrochemical methodologies6,16,17,22in addition to those achieved via chemiluminescence.43Furthermore, this range covers the concentrations observed for differentDatura species.44 As the concentration increased, the ECL signal in turn increased as shown inFigure 4. In addition to the increase in signal, a shift in potential is observed as atropine concentration increases. This shift, although unexpected, can likely be attributed to a combination of the following effects: first, the ruthenium becomes the rate limiting reagent, where the Ru3+centers are more rapidly consumed than produced via heterogeneous oxidation at the electrode surface.45Second, a slight shift in pH at the electrode surface as a result of the increased concentration of the electrogenerated byproducts: noratropine and formaldehyde. This is consistent with previous work, which saw a shift in theλECLmaxat a graphite electrode,46 highlighting the impact that pH can have. Further research, however, would be required to fully assess the impact to the sensor as a result of these effects. The response at maximum intensity was observed to be linearly proportional to atropine concentration with a coefficientR2 value of 0.997 (Figure 4, inset), with a detection limit of ∼0.75 μM (S/N = 3). Instrument precision, sensor reproducibility, and repeatability was determined across six replicate measurements, six
electrodes, and six days at an atropine concentration of 50
μM and found to be 4.5%, 3.0%, and 9.2%, respectively.
Sample Analysis. To demonstrate the wide potential scope of applications possible with the developed sensor, analysis of a variety of different matrices encountered within
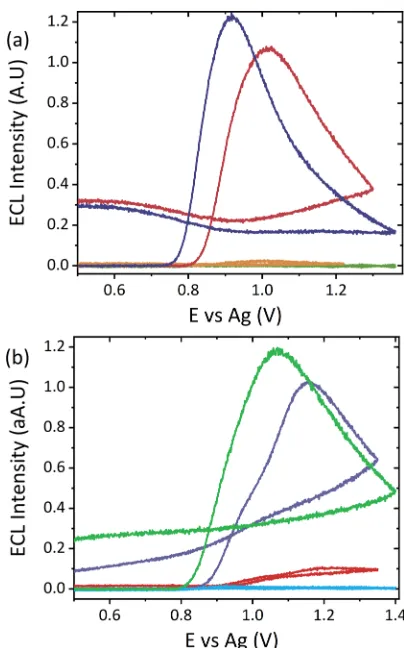
“real world” applications was performed, including plant material and drink samples. We report here for the first time a direct analysis method of Datura plant extracts alongside herbal material through mechanical application to the electrode surface without any prior separation or extraction techniques required. Despite the large number of species present alongside the tropane alkaloids, demonstrated in the LC-MS analysis of the leaf material performed (seeFigure S3), no interference was observed in either the CV (seeFigures 5a andS4) or ECL analysis obtained for the extracts (Figure 5b) or mechanical application (Figure 5c) outside of the potential region for oxidation of the tropane alkaloid species, with an ECL signal observed at approximately the same potential seen for atropine sulfate within the LiClO4 electrolyte. To ensure the signals obtained were not impacted by the vast number of species present within the complex herbal matrix, leaves from a tomato plant were used as a control. Tomato plants come from the same plant family asDatura, thesolanaceousfamily, but do not contain the hallucinogenic compounds of interest: atropine and scopolamine. Despite the control species not containing the hallucinogenic tropane alkaloids, a slight signal is still observed. This is believed to arise as a result of the naturally occurring glycoalkaloids found within all members of the solanaceousfamily.47The particular glycoalkaloid found within tomato plants is the steroid alkaloid tomatine, containing the piperidine alkaloid functionality.47It is therefore proposed that this functionality will result in the observed ECL signal, as is observed for other structurally similar amine species previously
reported.16,31−36 The emission onset of tomatine is seen to begin at a lower potential than atropine, attributed to the oxidation occurring at a the secondary amine within the piperidine alkaloid rather than a tertiary amine as is present within the tropane alkaloid functional groups. To further assess
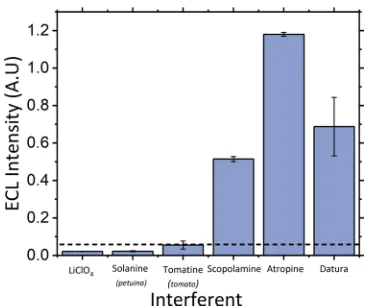
[image:5.608.342.532.58.520.2]selectivity of the developed sensor an interferent study was performed with other naturally occurring alkaloids present within Datura species. These interferents included scopol-amine, the second hallucinogenic tropane alkaloid present within Datura and the naturally occurring alkaloid solanine present within all plants of thesolanaceousfamily. These were assessed against the signals observed for tomatine, LiClO4, atropine, and Datura and can be found within Figure 6. As shown, the signal observed from the solanine species is comparable to that observed for pH 8 LiClO4 blank and, as Figure 3.(a) ECL response of 50μM atropine sulfate between pH
5−11 at a scan rate of 100 mV s−1over the potential range 0.5≤ν≤
1.22 V vs Ag at a PMT setting of 0.5 V with 0.1 M LiClO4 as the
[image:5.608.72.268.59.404.2]electrolyte. (b) Trend in ECL response with pH across triplicate measurements.
Figure 4. Dependence of ECL signal on atropine sulfate concentration between 0.75 to 100 μM in pH 8 0.1 M LiClO4at a
scan rate of 100 mV s−1across a potential range of 0.5 to 1.22 V vs Ag
at a PMT setting of 0.45 V. Inset shows the trend of maximum ECL signal against atropine sulfate concentration.
Figure 5. (a) CV responses obtained for Datura leaf (pink) and tomato leaf (yellow) extracts with [Ru(bpy)3]2+-modified electrode at
a scan rate of 100 mV s−1over the potential range 0.5≤ν≤1.36 V vs
Ag with 0.1 M LiClO4as the extraction solvent and electrolyte. (b)
ECL responses recorded simultaneously with (a) at a PMT setting of 0.45 V. (c) ECL responses obtained for mechanical application of matureDaturaleaf (green), youngDaturaleaf (purple), and tomato leaf (blue) material onto [Ru(bpy)3]2+-modified electrode surface
with 0.1 M LiClO4dropcast on top as the electrolyte, a scan rate of
100 mV s−1and a PMT setting of 0.45 V.
[image:5.608.67.293.470.623.2]such, is not believable to interfere with the signal obtained from the herbal material. The tomatine signal is, however, slightly larger at an intensity of 0.05 A.U., which may be a result of the secondary amine species present compared with the tertiary amine within solanine. Thus, to account for the impact the glycoalkaloids may have on the observed Datura signal, the concentrations reported inTable 1were calculated,
subtracting this threshold response from the overall ECL signal observed for herbal material. This does represent a limitation of the proposed system; however, this is outweighed by the potential screening ability of this portable ECL approach and the rapid results that can be obtained.
Although this current study focuses on the detection of atropine, it can be clearly seen from Figure 6that one of the closely related tropane alkaloid compounds, scopolamine, also generates a significant ECL emission. We know from the LC-MS analysis (seeFigure S3) performed on ourDaturamaterial that both atropine and scopolamine are present. These two compounds only differ by one epoxide group and are, as such, observed to oxidize at similar potentials, although scopolamine is observed to oxidize at a slightly later potential than atropine.
members of thesolanaceousfamily, thus, ensuring the observed signals are not a result of the other species naturally found within herbal material.
Analysis within alternative complex matrices of commonly encountered carbonated drinks were performed to simulate a
“real-world” scenario, which may be encountered within a forensic case involving potential drink spiking. Coca-Cola, a common mixer, and tonic water, the drink chosen by Paul Agutter in the attempted murder of his wife, were spiked to a final concentration of 50 μM atropine sulfate. To emphasize the field applicability of this protocol, spiked drink samples were diluted with the electrolyte to produce an ideal sample matrix and ran alongside neat samples that replicate a potential
“real-world”matrix. The natural acidity of Coca-Cola and tonic water, at ∼pH 2, prevented the detection of atropine within raw samples; refer toFigure S5for the corresponding CV and ECL signals.
As demonstrated inFigure 3, at acidic pH values, minimal ECL signal is obtained for atropine, attributed to the protonated form of the alkaloid dominating at these pH values. As such, it was necessary to adjust the drink matrices to more alkaline pH values to facilitate detection. By diluting the drink samples in a 1:1 ratio with the electrolyte recoveries of 99% and 96% were obtained for Coca-Cola, and tonic, respectively. This demonstrated a high degree of accuracy, with the ECL sensor producing recoveries above the 95% threshold typically required for analytical methodologies. Analysis of the neat samples demonstrated the ability of the drink matrices to provide the conductivity required to perform electrochemical measurements. As can be seen inFigure 7, the signals obtained from the neat samples displayed a slightly shifted and lower intensity signal. This is likely the consequence of the nonideal characteristics of this matrix, including higher solution resistance to charge transfer. As such, the recoveries obtained for the neat drink samples were below the typical 95% threshold value at 85% and 84% for Coca-Cola and tonic, respectively; concentrations calculated for all samples are reported inTable 2. Previously, Ramdani et al.6have reported the detection of atropine in diluted diet Coca-Cola via CV, but failed to identify atropine in tonic water as a result of interference from the electroactive alkaloid, quinine. As shown inFigure 7b, the influence of quinine can be almost negated by the employment of ECL alongside CV. The diluted tonic water displayed no significant interference from quinine at pH 8. However, it is likely that at alternative pH values a greater interference effect could be observed. The nonspiked neat tonic water displays a larger signal compared with the diluted sensor in the presence of different species naturally found within the
herbal material of the solanaceousfamily and compared against the signals observed for atropine sulfate in LiClO4 and Datura. The
[image:6.608.80.266.57.210.2]dotted line represents the threshold signal used to correct calculated concentrations of the alkaloids within the herbal material analyzed.
Table 1. Noncorrected and Corrected Alkaloid Concentrations Estimated from Extracts (E) and Mechanically Applied Samples (M) Obtained from ECL Analysis of Tomato and Young and Mature DaturaPlants, Where Corrections Were Performed through Subtraction of the Tomatine Threshold Signal
sample
ECL intensity
(A.U.)
corrected ECL intensity (A.U.)
[image:6.608.52.293.449.589.2]noncorrected [alkaloid]
(μM)
corrected [alkaloid] (μM)
tomato leaf (E)
0.0213 0 2.49 0
tomato leaf (M)
0.0818 0 4.92 0
Datura(E) 0.0539 0.0357 3.07 3.07
mature Datura (M)
0.683 0.591 29.0 25.3
young Datura (M)
0.303 0.249 13.8 11.6
blank. This can likely be attributed to the higher concentration of quinine present in the nondilute sample. This interference effect in combination with the nonideal matrix effects previously discussed could account for the lower recovery obtained within neat tonic water samples. Despite the lower recoveries obtained, this protocol has shown its strength for detection of atropine within nonideal matrices with minimal sample preparation required and, as such, makes an ideal candidate for alternative screening methodologies for employ-ment within a forensic arena. However, the reliance on the pH of samples does present a significant limitation to the proposed
protocol for field employment, where the ability to accurately adjust samples to a specified pH would be challenging. As a screening protocol, however, the ability to accurately quantify samples is not required, and as such, a wide range of pH values, as shown by Figure 3, would result in an indicative signal, warranting further testing. As such, it is hoped that this protocol would be applicable to a range of different drink matrices across a range of pH values.
■
CONCLUSION [image:7.608.69.271.56.380.2]In this work we demonstrated the ability of a simple nafi on-[Ru(bpy)3]2+film modified screen-printed carbon electrode to detect atropine within a variety of complex sample matrices. In spite of the complex nature of the plant-based material, we have observed no significant interference effects, despite the vast number of species present within such material. The developed sensor demonstrates a degree of selectivity toward alkaloid species, with a preference toward tropane alkaloids observed. Although a slight signal is observed for other naturally occurring glycoalkaoids found within herbal material, these signals are negligible compared with the hallucinogenic tropane alkaloids of interest, and as such, these naturally occurring alkaloids can be used as a threshold value above which it can be determined if hallucinogens are present or not. The current methodology, however, does show limited selectivity between different tropane alkaloid species, as is apparent when comparing the emission signals between atropine and scopolamine. Further work is ongoing, with the hope of understanding the impact that scopolamine has on the detected signal within herbal material. However, this initial proof-of-concept demonstrates an appropriate screening method for the identification of hallucinogenic tropane alkaloids within herbal material for the first time via direct analysis of a species within its native form both in mature and young plants via ECL. This proposed protocol would negate the need to perform complex, expensive, and lengthy extraction procedures prior to analysis, making it ideal for field employment. In addition to this, analysis of atropine within complex matrices of Coca-Cola and tonic water, with and without the addition of electrolyte, with good % recoveries was achieved. Not only does this demonstrate the ability of ECL to be applied to nonideal matrices, but also the ability to detect emission through colored matrices, without any interference effects. These new methodologies would be ideal for future implementation intofield analysis where often a rapid result is required with access to limited knowledge or facilities. However, limited selectivity is currently observed between species within the same class, and a dependence on pH to obtain emission may require samples to be pH-adjusted in-field prior to analysis. Despite this, these initial results have shown promise for the use of ECL sensors for direct detection of species within their native form. This is a concept we are continuing to explore and hope to expand past atropine and scopolamine. Further work is currently investigating potential techniques that could be employed to improve the selectivity of the developed sensor in order to differentiate between compounds within the same class, such as atropine and scopolamine.
Figure 7. (a) ECL responses obtained for neat pH 8 Coca-Cola (orange), LiClO4diluted pH 8 Cola (lime), neat pH 8
Coca-Cola spiked with 50μM atropine sulfate (pink), and LiClO4diluted
pH 8 Coca-Cola spiked with 50μM atropine sulfate (purple) with a [Ru(bpy)3]2+-modified electrode at a scan rate of 100 mV s−1over the
potential range 0.5≤ν≤1.36 V vs Ag at a PMT setting of 0.45 V. (b) ECL responses obtained for neat pH 8 tonic water (red), LiClO4
diluted pH 8 tonic water (blue), neat pH 8 tonic water spiked with 50μM atropine sulfate (purple), and LiClO4diluted pH 8 tonic water
spiked with 50 μM atropine sulfate (green) with [Ru(bpy)3]2+
-modified electrode at a scan rate of 100 mV s−1 over the potential
range 0.5≤ν≤1.4 V vs Ag at a PMT setting of 0.45 V.
Table 2. Calculated Atropine Sulfate Concentrations and % Recoveries Obtained from ECL Analysis of Spiked pH 8 Coca-Cola and Tonic Water Samples
sample avg concn calcd (μM) % recovery
neat Coca-Cola 42.3 85
diluted Coca-Cola 49.3 99
neat tonic water 42.1 84
diluted tonic water 47.9 96
[image:7.608.53.292.560.621.2]■
AUTHOR INFORMATIONCorresponding Author
*E-mail:[email protected].
ORCID
Lynn Dennany: 0000-0002-5481-1066
Author Contributions
The manuscript was written through contributions of all authors.
Notes
The authors declare no competingfinancial interest.
All data underpinning this publication are openly available from the University of Strathclyde KnowledgeBase athttps:// doi.org/10.15129/f678fa16-df1e-47b1-ba25-0a0728f6b9f5.
■
ACKNOWLEDGMENTSThe authors would like to acknowledge The Carnegie Trust for the Universities of Scotland for the Ph.D. scholarship funding that has supported this work and the AHRC AH/ M008894/1.
■
REFERENCES(1) Tettey, J.; Crean, C. Philos. Trans. R. Soc., B 2015, 370, 20140265.
(2) Shaw, L.; Dennany, L.Curr. Opin. Electrochem.2017,3, 23−28. (3)World Drug Report 2018, United Nations Publications, 2018. (4) Banks, C.; Smith, J.Analytical Scientist2016, 41−43.
(5) Reichert, S.; Lin, C.; Ong, W.; Him, C. C.; Hameed, S.Canadian family physician Medecin de famille canadien2017,63, 369−370.
(6) Ramdani, O.; Metters, J. P.; Figueiredo-Filho, L. C. S.; Fatibello-Filho, O.; Banks, C. E.Analyst2013,138, 1053−1059.
(7) Srivanitchapoom, P.; Pandey, S.; Hallett, M. Parkinsonism & related disorders2014,20, 1109−1118.
(8) Gwiazda, J.Optometry and vision science: official publication of the American Academy of Optometry2009,86, 624−628.
(9) Eddleston, M.; Buckley, N. A.; Eyer, P.; Dawson, A. H.Lancet
2008,371, 597−607.
(10) Johnson, D. Chemistry World; Royal Society of Chemsitry, 2013.
(11) Dräger, B.J. Chromatogr. A2002,978, 1−35.
(12) Auriola, S.; Martinsen, A.; Oksman-Caldentey, K.-M.; Naaranlahti, T.J. Chromatogr., Biomed. Appl.1991,562, 737−744.
(13) Namera, A.; Yashiki, M.; Hirose, Y.; Yamaji, S.; Tani, T.; Kojima, T.Forensic Sci. Int.2002,130, 34−43.
(14) Li, J.; Chun, Y.; Ju, H.Electroanalysis2007,19, 1569−1574. (15) Yuan, B.; Zheng, C.; Teng, H.; You, T.J. Chromatogr. A2010,
1217, 171−174.
(16) Yang, X.-Y.; Xu, C.-Y.; Yuan, B.-Q.; You, T.-Y. Chin. J. Anal. Chem.2011,39, 1233−1237.
Electrochemical Methods: Fundamentals and Applications; Wiley: New York, 1980; Vol.2.
(26) O’Reilly, E. J.; Keyes, T. E.; Forster, R. J.; Dennany, L.Analyst
2013,138, 677−682.
(27) Rubinstein, I.; Bard, A. J.J. Am. Chem. Soc.1980,102, 6641− 6642.
(28) Rubinstein, I.; Bard, A. J.J. Am. Chem. Soc.1981,103, 5007− 5013.
(29) Qu, Y.; Liu, X.; Zheng, X.; Guo, Z.Anal. Sci.2012,28, 571− 576.
(30) O’Reilly, E. J.; Keyes, T. E.; Forster, R. J.; Dennany, L.
Electrochem. Commun.2018,86, 90−93.
(31) Xu, Y.; Gao, Y.; Wei, H.; Du, Y.; Wang, E. J. Chromatogr. A
2006,1115, 260−266.
(32) Song, C.; Zhang, J. In PEM Fuel Cell Electrocatalysts and Catalyst Layers: Fundamentals and Applications; Zhang, J., Ed.; Springer: London, 2008; pp 89−134.
(33) Cai, Q.; Chen, L.; Luo, F.; Qiu, B.; Lin, Z.; Chen, G. Anal. Bioanal. Chem.2011,400, 289−294.
(34) Meti, M. D.; Nandibewoor, S. T.; Chimatadar, S. A. Synth. React. Inorg., Met.-Org., Nano-Met. Chem.2014,44, 263−272.
(35) McGeehan, J.; Dennany, L.Forensic Sci. Int.2016,264, 1−6. (36) Takahashi, F.; Nitta, S.; Shimizu, R.; Jin, J. Forensic Toxicol.
2018,36, 185−191.
(37) Forster, R. J.; Hogan, C. F.Anal. Chem.2000,72, 5576−5582. (38) Rosenheim, O.Analyst1907,32, 106b−108.
(39) Portis, L. C.; Bhat, V. V.; Mann, C. K.J. Org. Chem.1970,35, 2175−2178.
(40) Laube, B. L.; Asirvatham, M. R.; Mann, C. K. J. Org. Chem.
1977,42, 670−674.
(41) Dettbarn, W. D.; Heilbronn, E.; Hoskin, F. C. G.; Kitz, R.
Neuropharmacology1972,11, 727−732.
(42) Zvirblis, P.; Socholitsky, I.; Kondritzer, A. A. J. Am. Pharm. Assoc., Sci. Ed.1956,45, 450−454.
(43) Greenwood, P. A.; Merrin, C.; McCreedy, T.; Greenway, G. M.
Talanta2002,56, 539−545.
(44) Boros, B.; Farkas, Á.; Jakabova, S.; Bacskay, I.; Kilá ́r, F.; Felinger, A.Chromatographia2010,71, 43−49.
(45) Oja, S. M.; Zhang, B.ChemElectroChem2016,3, 457−464. (46) Shen, L.-H.; Wang, H.-N.; Chen, P.-J.; Yu, C.-X.; Liang, Y.-D.; Zhang, C.-X.J. Food Drug Anal.2016,24, 199−205.
(47) Friedman, M.J. Chromatogr. A2004,1054, 143−155.