Shakedown analysis of engineering structures under multiple variable
1mechanical and thermal loads using the stress compensation method
2Heng Penga, Yinghua Liua,*, Haofeng Chenb and Jun Shena 3
aDepartment of Engineering Mechanics, AML, Tsinghua University, Beijing 100084, People’s Republic of China 4
bDepartment of Mechanical and Aerospace Engineering, University of Strathclyde, Glasgow G1 1XJ, UK 5
*Corresponding author: [email protected] 6
7
Abstract
8The determination of shakedown load or shakedown domain is an important task in 9
structural design and integrity assessment. In this paper, a novel numerical procedure based 10
on the Stress Compensation Method (SCM) is developed to perform shakedown analysis of 11
engineering structures under multiple variable mechanical and thermal loads. By applying the 12
compensation stress on the yield regions that occur at every load vertex of the prescribed 13
loading domain to adjust the total stress to the yield surface and re-solving the equilibrium 14
equations, the statically admissible residual stress field for static shakedown analysis is 15
constructed. A robust and effective iteration control technique with some convergence 16
parameters is used to check the change of the compensation stress in the inner loop and to 17
update the shakedown load multiplier in the outer loop. For the purpose of general use, the 18
method is implemented into ABAQUS platform. The shakedown problems for the Bree plate, 19
a square plate with a central circular hole and a practical thick vessel with nozzles under some 20
two-dimensional and three-dimensional loading domains are effectively solved and analyzed. 21
Both alternating plasticity mechanism and ratchetingmechanism to determine the shakedown 22
boundary of these structures are revealed. Numerical applications show that the proposed 23
method has good numerical stability, high accuracy and efficiency, and is well suited for 24
shakedown analysis of large-scale practical engineering structures. 25
Keywords: Plasticity; Shakedown analysis; Stress Compensation Method; Cyclic loading; 26
Multi-dimensional loading domain 27
2
1
Introduction
29
In many practical engineering fields, such as electric power, nuclear energy, aerospace, 30
petrochemical and civil industries, structural components are usually subjected to variable 31
repeated mechanical and thermal loads. On the one hand, for making full use of the 32
load-carrying capability of materials, these structural components are allowed to operate in 33
plasticity state. On the other hand, in order to ensure structures to be safe and serviceable, the 34
applied variable loads cannot be beyond the safety margin, i.e. shakedown domain, so that the 35
structural components cannot fail due to alternating plasticity (low-cycle fatigue) or ratcheting 36
(incremental collapse). Therefore, the shakedown analysis has a wide application prospect 37
because of its important theoretical significance and practical engineering value for 38
strengthening the security of structures and reducing costs. Moreover, the determination of 39
shakedown load or shakedown domain of structures becomes the important task in structural 40
design and integrity assessment. 41
Many designers hope to determine the shakedown limit by the step-by-step incremental 42
elastic-plastic analysis [1, 2], but for complicated loading history the computation is 43
cumbersome and time-consuming. In addition, the exact loading history is often uncertain in 44
practical situations. The shakedown analysis [3-6] based on the lower bound theorem by 45
Melan [3] and the upper bound theorem by Koiter [4] provides an effective approach to 46
calculating the shakedown limit of structures, where the exact loading history is not 47
concerned but only the bounding box of these loads. Since the two classical shakedown 48
theorems [3, 4] were established, the studies on shakedown analysis have attracted broad 49
attention in structural engineering and academic circles (see Refs. [5-44]), mainly involving 50
the theoretical extensions [5-16] and development of numerical methods [7, 17-44] for 51
shakedown analysis. 52
The two classical shakedown theorems rest on the assumptions [5] of perfectly plastic 53
material, associated temperature-independent constitutive laws, small displacement, 54
negligible inertia and creeping effects. In some engineering situations, these assumptions may 55
be unrealistic. To extend the theory to make it applied in more practical applications, some 56
non-associated flow rules [6, 7], geometrical nonlinearities [8], dynamic effects [9, 10], 58
damaging inelastic material [11, 13] and nonlinear kinematic hardening material[12-16] have 59
been investigated. 60
However, although the shakedown theories are proposed and extended, a bigger difficulty 61
in practical engineering applications lies on the numerical method for solving the shakedown 62
problem. Shakedown analysis based on the upper and lower bound theorem is mostly 63
transformed as a mathematical programming problem [7, 17-29], which aims to minimize or 64
maximize a goal function with plenty of independent variables and constraint conditions [17]. 65
As one of pioneers in limit and shakedown analysis field, Maier [6] adapted shakedown 66
theory to the linear programming method using piecewise linearization of yield surfaces. If 67
the von Mises yield criterion is used, the mathematical programming formulation for 68
shakedown analysis leads to a complicated nonlinear optimization problem. Over the last four 69
decades, with the rapid development of numerical methods, some powerful algorithms such 70
as the nonlinear Newton-type iteration algorithm [7, 20-22], the second order cone 71
programming (SQCP) [23, 24] and the interior point method (IPM) [25-29] have been 72
developed to solve the nonlinear optimization problem. Besides, some other computational 73
methods [30-35] of structural analysis instead of traditional finite element method have been 74
combined with shakedown theory to solve the shakedown problem. 75
Going around the difficulties of optimization, Ponter and Chen [36-39, 45] developed the 76
elastic compensation method (ECM) or the linear matching method (LMM) to solve the 77
shakedown problem. Using more physical arguments, the LMM matches the linear behavior 78
to the nonlinear plastic behavior by performing a sequence of linear solutions with spatially 79
varying moduli [38], and the incompressible and kinematically admissible strain rate history 80
is also constructed at the same time. Then a series of monotonically reducing upper bounds 81
are generated by an iterative scheme making full use of the upper shakedown theorem.More 82
recently, the residual stress decomposition method for shakedown (RSDM-S) [41, 46] was 83
proposed for the shakedown analysis of some simple two-dimensional structures under 84
mechanical and thermal loads. 85
4
are calculated. However, it should be mentioned that most of these applications are restricted 88
to some specific cases (plane problem and axisymmetric shells under two loads) and the 89
computational models are relatively simple. In practical industrial applications, engineering 90
structures are often complex and subjected to multiple variable loads. After mesh 91
discretization, the large number of optimization variables and constraints generally result in a 92
tremendous mathematical programming problem, which implies these methods are of low 93
computational efficiency. Moreover, the computing scale of the mathematical programming 94
problem is multiplied with the increase of the vertices of the loading domain. 95
The purpose of this paper is to develop a novel and effective numerical procedure based 96
on the Stress Compensation Method (SCM) to solve the practical shakedown problems of 97
large-scale engineering structures under multiple variable mechanical and thermal loads. 98
Differing from the LMM that modifies elastic moduli of the material to match the stress to the 99
yield surface, the SCM directly adjusts the stress to the yield surface by applying the 100
compensation stress on the yield regions. The residual stresses for static shakedown analysis 101
are calculated iteratively at the end of a load cycle instead of at every load vertex, by which 102
the proposed method achieves the good performance that the computational time has little 103
relationship with the number of dimensions of loading domain. Moreover, an iterative 104
procedure rather than mathematical programming formulation is established to generate a 105
sequence of descending load multipliers approaching to the shakedown limit. Over the whole 106
procedure, the global stiffness matrix is decomposed only once, which ensures the high 107
computational efficiency of shakedown analysis regardless of the number of the vertices of 108
the loading domain. Different types of Bree problem with two-dimensional loading domain 109
are tested for the verification purpose of the proposed method. A square plate with a central 110
circular hole considering different load combinations in three-dimensional loading space is 111
calculated and analyzed. Finally, the method is effectively applied for solving the practical 112
shakedown problems of a thick vessel with nozzles from nuclear reactor plant. 113
2 Basic theory of shakedown analysis
114cyclic history of mechanical and thermal loads, the following situations are possible with the 116
increase of the applied loads [5]: 117
(1) Elastic behavior: If the loads remain sufficiently low, the structural response is perfectly 118
elastic throughout the cycle. 119
(2) Shakedown: The plastic deformation occurs in some local parts of the structure during the 120
initial several load cycles. Afterwards, the development of plastic deformation terminates 121
and the body possesses a time-independent residual stress field that keeps the total stress 122
within yield. 123
(3) Alternating plasticity: The plastic strain increments change sign in every load cycle, but 124
the accumulation of strains over the cycle is equal to zero. 125
(4) Ratcheting: The plastic strains will accumulate in every load cycle. Moreover, the total 126
strains can become so large after a number of cycles that the structure departs from its 127
original form and loses its serviceability. 128
(5) Plastic collapse: If the loads become sufficiently high, the body plastically collapses at the 129
first load cycle. 130
The main purpose of the shakedown analysis is to evaluate the shakedown limits or 131
loading domains of structures under variable repeated loads. 132
2.1 Static shakedown theorem by Melan 133
As formulated for a three-dimensional situation by Melan [3] in 1938, the static 134
shakedown theorem can be stated as follows: the structure will shake down to the variable 135
repeated loads, i.e., its behavior after several initial load cycles will become purely elastic, if 136
there exists a time-independent distribution of residual stress field ρ x
such that its 137superposition with the fictitious elastic stress field σ xE
,t multiplying by a multiplier , 138satisfies yield criterion of material at any point of the structure under any combination of 139
loads inside prescribed limit, namely: 140
,t E
,t σ x σ x ρ x (1)
6
, 0
in on t
f t t
,
σ x x Ω
ρ x 0 Ω
ρ x n 0 Γ
(2)
142
Here, σ x
,t is the total stress field; f
denotes the yield function; is the shakedown 143load multiplier; denotes the divergence operator; ρ x
represents a self-equilibrated 144residual stress field which satisfies the equilibrium conditions within the body Ω and the 145
boundary conditions on the part Γt of the surface; and n is the unit outward normal vector 146
of the boundary Γt. 147
2.2 Loading domain and shakedown load multiplier 148
If a structure is subjected to an arbitrary finite number N of loadings P xi
,t . The 149loading history P x
,t can be described as the combinations of the N loading cases, where 150each loading case P xi
,t can be decided by time-dependent multiplier i
t and the 151constant load system Pi0
x , that is 152
01 1
, ,
N N
i i i
i i
t t t
P x P x P x (3)
153
If the bounding values of each multiplier are given as follows: 154
, 1, ,i i t i i N
(4)
155
Eq. (3) will describe a domain Ω of these loads. The loading domain Ω is usually a 156
convex hyper-polyhedron defined by the vertices in the space of load parameters. 157
For an elastic body, the elastic stress field is unique to the applied loads of the structure. 158
Thus, the loading domain Ω will produce the unique domain E of the elastic stress at every 159
point of the body. As shown in Fig. 1, a two-dimensional fictitious elastic domain E with four 160
vertices B B1, 2, B B3, 4 is taken as an example. If the applied loads (or the structural stresses) 161
vary within the loading domain Ω (or the fictitious elastic domain E), the structural safety 162
load multiplier being used for zooming the loading domain Ω and allowing for the 164
shakedown of the structure. 165
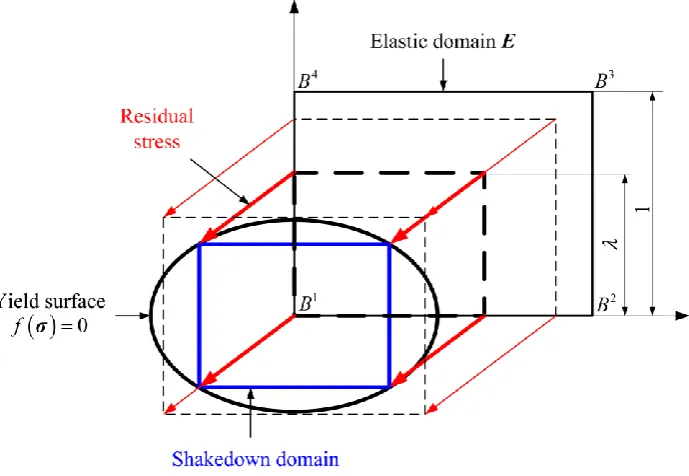
2.3 A geometrical interpretation of static shakedown analysis 166
From the geometrical point of view, the basic ideas of static shakedown analysis can be 167
illustrated in Fig. 1. The elastic domain E at every point of a structure should be placed into 168
the geometric space formed by the yield surface f
σ 0. However, all these elastic 169domains E can only be adjusted by means of translation and scaling, and the mutual 170
movement among these elastic domains must satisfy certain inherent relations. The 171
corresponding physical interpretation is as follows: the translation of these elastic domains 172
compels the residual stress to be constant over a load cycle; the inherent relations represent 173
the self-equilibrium conditions of the residual stress field of the whole body; and the 174
maximum scaling factor is the shakedown load multiplier. Thus, the most critical task for 175
shakedown analysis is to search the optimum residual stress field. 176
[image:7.595.129.474.426.664.2]177
Fig. 1. Illustration of the basic ideas of static shakedown theorem. 178
3 Novel SCM for mechanical and thermal loads
1798
Drucker’s postulate. The strain rate ε
t is decomposed into three parts: 181
E
r t t t t
ε ε ε ε (5)
182
where εE
t is the elastic strain rate corresponding to the fictitious elastic stress rate σE
t ; 183
t
ε is the thermal strain rate; and εr
t is the residual strain rate. It is worth noting that 184the residual strain rate εr
t consists of the plastic part εp
t and the elastic part εer
t , 185and the elastic term εer
t is generated to satisfy the deformation compatibility of the whole 186body. Then Eq. (5) is written as 187
E
p
e
r t t t t t
ε ε ε ε ε (6)
188
According to the constitutive law of elastic-perfectly plastic material with the associated 189
flow rule, the stresses and strains are related by: 190
E t E t
σ D ε (7)
191
e
r
t t
ρ D ε (8)
192
p f
t
ε
σ (9)
193
where D is the elastic stiffness matrix; f is the yield function; εp
t is the plastic strain rate 194whose direction is along the outer normal of the yield surface; and is the plastic 195
multiplier. 196
For a finite element model, the strains and the stresses are calculated at the Gauss points 197
of the element. The strain rate ε
t at the Gauss point is related to the nodal displacement 198rate u
t of the element: 199
t
tε B u (10)
200
where B is the strain-displacement matrix. 201
Substituting Eq. (6) into (8), the residual stress rate at the Gauss point is written as 202
E
p
t t t t t
ρ D ε ε ε ε (11)
203
kinematically admissible, the principle of virtual work states as follows: 205
T0
V t t dV
ε ρ (12)206
where the superscript T denotes the symbol of transpose and ε
t is the virtual strain rate. 207Substituting Eqs. (10) and (11) into Eq. (12), we get 208
T T
0
E p
V
t t t t t dV
u
B D B u ε ε ε (13) 209Since Eq. (13) holds for any virtual displacement rate u
t , the integral formula consisting 210in the equation must vanish, i.e. 211
T
T E
T p
V dV t V t t dV V t dV
B D B u
B D ε ε
B D ε (14)212
We replace the term D ε p
t with σC
t which is named as the compensation stress 213here, and substitute Eqs. (7) and (10) into Eqs. (14) and (11). Then Eqs. (14) and (11) become, 214
respectively 215
T E
T
T C
V V V
T V
t t dV t dV t dV
dV
K u B σ B D ε B σ
K B D B
(15) 216
E
C
t t t t t
ρ D B u σ D ε σ (16)
217
where K is the global stiffness matrix of the structure. Then the residual stress for 218
shakedown analysis is calculated by 219
t t
t
t t t
t dtρ ρ ρ (17)
220
For load vertex i, the total stresses at all the Gauss points in a body are calculated: 221
E
i i i
t t t
σ σ ρ (18)
222
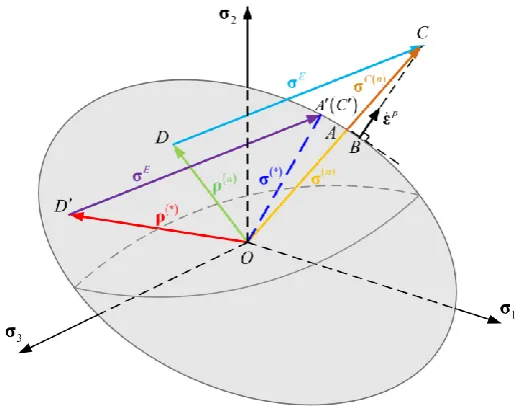
It should be noted that ti denotes the stress state of the body at the load vertex i. As illustrated
223
in Fig. 2, the total stress vector OC (σ
ti ) is equal to the sum of the residual stress vector 224OD (ρ
ti ) and the fictitious elastic stress vector DC (σE
ti ), and the part in excess of 225the von Mises yield surface is defined as the compensation stress vector AC (σC
ti ) which 22610
0 i y i y C ii i i i
i y
t
t t
t t t t
t ,
σ σ (19)
228
If we substitute Eq. (19) into (15), the nodal displacement rate u
ti can be obtained by 229solving the equilibrium equations in Eq. (15). Then, a new residual stress field ρ
ti can be 230updated by Eq. (17). 231
[image:10.595.167.426.236.439.2]232
Fig. 2. Von Mises yield surface and stress superposition schematic. 233
Because the equilibrium equations in Eq. (15) are established for every load vertex, it will 234
require more time to solve these equilibrium equations with the increase of the number of 235
vertices. Now, we superpose all the expressions (Eq. (20)) of residual stress rates over a load 236 cycle. 237
1 1 1 1 1
2 2 2 2 2
E C
E C
E C
NV NV NV NV NV
t t t t t
t t t t t
t t t t t
ρ D B u σ D ε σ
ρ D B u σ D ε σ
ρ D B u σ D ε σ
(20)
238
Then the residual stress rates can be written as 239
* * * * * * 0 1 E Ct t t t t
t NV
ρ D B u σ D ε σ
ρ ρ (21)
240
* 1 2 * 1 2 * 1 2 * 1 2 * 1 2 NV NVE E E E
NV
NV
C C C C
NV
t t t t
t t t t
t t t t
t t t t
t t t t
ρ ρ ρ ρ
u u u u
σ σ σ σ
ε ε ε ε
σ σ σ σ
(22)
242
Here, ρ0 is the updated residual stress rate of the structure for shakedown analysis, and NV 243
denotes the number of vertices within a load cycle. By this way, the equilibrium equations in 244
Eq. (15) just need to be solved only once forevery load cycle. 245
The iterative procedure can be summarized as follows, for the iteration m: 246
(1) If m1, the residual stress field ρ 01 is initialized to zero. Calculate the total stresses 247
m
i tσ at all the Gauss points in a body for each load vertex i. 248
0 , 1, 2, ,
m k E m
i i
t t i NV
σ σ ρ (23)
249
(2) Check whether the total stress σ m
ti at every Gauss point of the body exceeds the von 250Mises yield surface f
σ 0 for the NV vertices of a load cycle, and calculate the 251corresponding compensation stress σC m
ti . 252(3) Solve the global equilibrium equations in Eq. (24) to obtain the nodal displacement rate 253
m 1
*t
u for next iteration. Then a new residual stress field ρ0m1 can be updated by 254
Eqs. (25)-(27). 255
1
*
1 NV
m k T E T C m
i i i
V V
i
t t t dV t dV
K u B σ D ε B σ
(24)
256
* 1
*
1NV
m k E k C
i i i
i
t t t t t
ρ D B u σ D ε σ
(25)
257
* 0 1 t NV ρ ρ
(26)
258
*
1
0 0 0
t t m m t dt
ρ ρ ρ
(27)
259
(4) Check the change of the value of the compensation stress σC m
ti , and repeat the steps 26012
It is worth noting that the convergence of the compensation stress σC m
ti is equivalent 262to Condition (28) 263
1
1
m m
i i
t t tol
(28)
264
where tol1 is a tolerance parameter which dynamically reduces according to the value of 265
m
i t .
266
The above procedure provides an efficient strategy to search the statically admissible 267
constant residual stress field for shakedown analysis. Each iteration will generate a new 268
self-equilibrated residual stress field. For every vertex of a load cycle, the conditions of the 269
static shakedown theorem are examined. If the conditions of the static shakedown theorem are 270
violated, the compensation stress σC
t will be added to adjust the total stress to the yield 271surface, and then a new self-equilibrated residual stress field is updated again. When the 272
iterative process converges, the residual stress field no longer changes and the evolution of 273
compensation stress σC
t is also obtained. Thus, the compensation stress can be 274considered as a symbol for estimating whether the structure shakes down, i.e., whether all the 275
conditions of the static shakedown theorem are satisfied. If the compensation stresses at all 276
Gauss points of the body for every vertex of a load cycle vanish, the structure shakes down. 277
4 Numerical procedure of the SCM for shakedown analysis
278In section 3, the SCM presents an approach to calculating constant residual stress field for 279
shakedown analysis and provides a symbol to estimate whether the structure made up of the 280
elastic-perfectly plastic material shakes down. In this section, an iterative procedure well 281
suitable for shakedown analysis is proposed. 282
4.1 Evaluation of an initial load multiplier 283
The numerical procedure starts with an initial load multiplier ini and the fictitious 284
elastic stresses σE
ti . The fictitious elastic stresses σE
ti can be obtained via some 285by 287
1 ini 1 NV y i V i NV E E i i V i dVt t dV
σ ε(29)
288
where εE
ti is the elastic stain corresponding to the fictitious elastic stress σE
ti , and i 289is the effective strain of εE
ti . Then the value of the initial load multiplier must be bigger 290than that of the shakedown limit. 291
4.2 Iterative procedure for shakedown analysis 292
The numerical procedure is made up of two iteration loops. The inner one controlled by 293
iteration m is used to obtain the compensation stress σC
ti at every load vertex and the 294constant residual stress field for shakedown analysis. The outer one controlled by iteration k is 295
used to update the shakedown load multiplier. The iterative steps are then followed, for the 296
outer iteration k: 297
(1) Complete all of the steps in the inner loop, which is summarized in Section 3. 298
(2) Calculate the maximum value of the variable m+1
ti at all the Gauss points for all 299load vertices at the end of load cycle, that is 300
1
1
max max k m i t (30) 301
(3) The following judgments are examined: 302 1 max max
2 and 0.1 k
k tol
, (31)
303
where tol2 usually takes 0.1~0.2; the initial value of max 1 is 1.0; and is a convergence 304
parameter with an initial value 0.1~0.5. If Condition (31) holds, the load multiplier is 305 modified by 306
1 max 1 1 max 1 2 1 k k k k (32)
14 and then the convergence parameter is halved: 308
2
(33)
309
otherwise, a new load multiplier is calculated by the following expression: 310
1
1
max 1
k k k
(34)
311
where k is the previous load multiplier; and k1 is the updated load multiplier. 312
(4) A desired tolerance tol3 is given to estimate whether maxk1 approaches to zero or not 313
1
max 3
k tol
(35)
314
(5) Repeat the steps 1~4. If condition (35) is satisfied, the calculated load multiplier becomes 315
the shakedown limit multiplier sh, i.e. 316
1 sh k
(36)
317
otherwise, a new outer iteration starts. 318
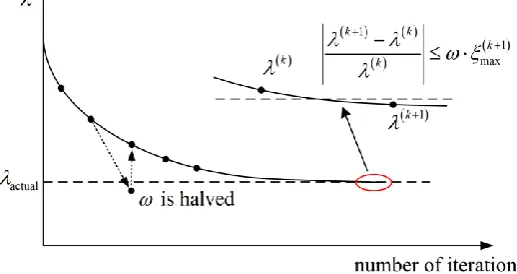
4.3 Convergence and accuracy considerations 319
A robust and effective iterative control technique and some tolerance parameters are 320
adopted in the numerical procedure to ensure the calculation accuracy and efficiency of the 321
method. Beginning with an initial load multiplier above the shakedown limit, the novel SCM 322
procedure for the shakedown analysis will generate a series of descending load multipliers 323
that converge to the shakedown limit. 324
The tolerance parameter tol1 used to stop the inner loop, is the key factor to balance the 325
accuracy and efficiency of the algorithm. Small value of tol1 that represents the strict 326
convergence criteria will lead to a more sophisticated calculation of constant residual stress 327
field for shakedown analysis. The calculated shakedown limit multiplier is mainly determined 328
by the finally convergent solution that satisfies the entire conditions of the static shakedown 329
theorem, and has few relations with the solution in the intermediate process where the 330
conditions of the static shakedown theorem are not satisfied. Therefore, the dynamically 331
varying values of tol1, which is large in the beginning of the iterative procedure and becomes 332
improve the speed of convergence. A final value of tol1 10 4 turns out to be enough for a 334
good calculation accuracy. 335
An initial convergence parameter 0.5 does not prohibit the load multiplier from 336
overshooting below the target solution at shakedown limit, and hence the numerical scheme 337
shown in Eqs. (31)-(33) is followed to deal with this problem. Then even though the 338
overshooting dose still occur, its value becomes negligible. If Condition (31) is satisfied, the 339
calculated load multiplier will increase till its value exceeds the shakedown limit, and then the 340
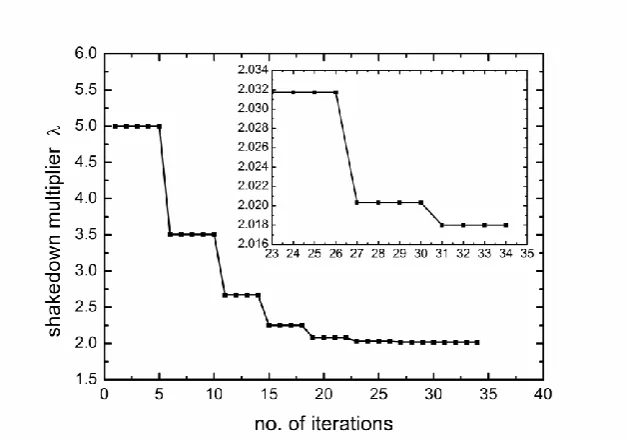
iterative procedure goes on. A typical convergence procedure of the SCM for shakedown 341
analysis is illustrated in Fig. 3. 342
Since that, the adopted shakedown criterion is based on the static shakedown theorem and 343
the entire conditions of the theorem are satisfied when the iterative procedure converges, the 344
calculated shakedown limit multiplier will be a lower bound to the actual shakedown solution. 345
In fact, the criterion in Eq. (35) is equivalent to the following form: 346
1
1 max
k k
k k
(37)
347
Because the value of is no more than 0.5, the relative error of the calculated shakedown 348
limit multiplier is no more than 0.1%. 349
[image:15.595.169.428.495.632.2]350
Fig. 3. Typical convergence procedure of the SCM for shakedown analysis. 351
5 Numerical applications
352In this section, three different numerical examples of shakedown analysis for structures 353
16
considered. The presented algorithm is implemented into the commercial finite element 355
software ABAQUS [47] via user subroutine UMAT and is used to calculate the shakedown 356
limits of these structures. 357
All the structures are made up of homogeneous, isotropic and elastic-perfectly plastic 358
material with von Mises yield surface. The material parameters are assumed independent of 359
the applied temperature and constant with time. All the calculations are carried out on the 360
personal computer with 16GB RAM and Intel Core i7 at 3.39GHz. 361
5.1 Bree problem 362
The first example is the Bree problem [37, 40, 46, 48, 49], which is a common benchmark 363
example of shakedown analysis for structures under mechanical and thermal loads. As 364
illustrated in Fig.4, the thin plate is subjected to a tension p and a temperature difference 365
t
that is linearly distributed along the width of the plate, and the deformation due to the 366
thermal gradient is restrained by boundary constraints. The tension p and the temperature 367
difference
t may vary in three different loading paths, as shown in Fig. 5. The finite 368element model of the plate consists of 630 8-node quadratic plane stress elements (ABAQUS 369
CPS8) with 33 Gauss integration points. The material properties of the plate are given in 370
Table 1. 371
The plane stress Bree cases considering two loading paths (Fig. 5a and b) have been 372
studied numerically and analytically by some authors [40, 49], and the two loading paths 373
correspond to two types (Type-I and Type-II) of the Bree problem. Here, three different 374
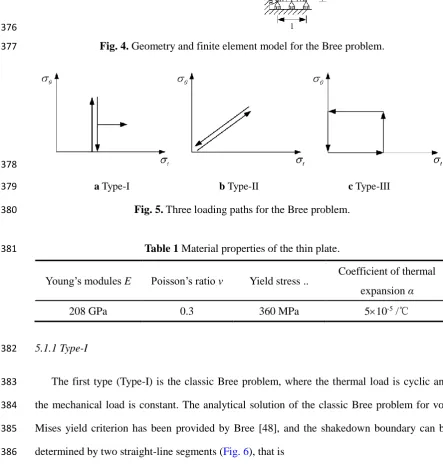
376
Fig. 4. Geometry and finite element model for the Bree problem. 377
378
a Type-I b Type-II c Type-III
[image:17.595.205.390.73.300.2]379
Fig. 5. Three loading paths for the Bree problem. 380
Table 1 Material properties of the thin plate. 381
Young’s modules E Poisson’s ratio v Yield stress .. Coefficient of thermal expansion α
208 GPa 0.3 360 MPa 510-5 /℃
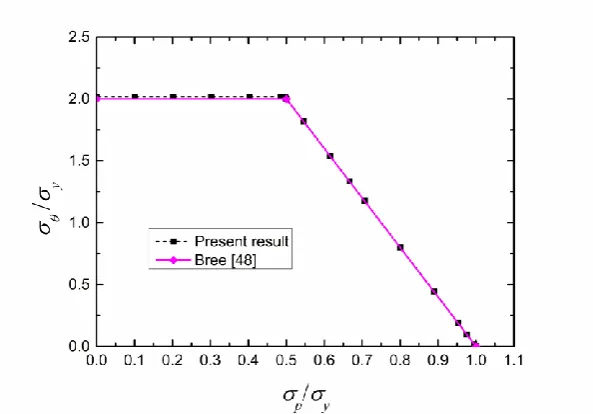
5.1.1 Type-I 382
The first type (Type-I) is the classic Bree problem, where the thermal load is cyclic and 383
the mechanical load is constant. The analytical solution of the classic Bree problem for von 384
Mises yield criterion has been provided by Bree [48], and the shakedown boundary can be 385
[image:17.595.55.499.272.739.2]18
1
2 0
2
1 1
1 1
4 2
p
y y
p p
y y y
(38)
387
where is the maximum thermal elastic stress due to the fluctuating temperature 388
difference
t . 389The SCM is used to calculate shakedown limits of the plate under various ratios of the 390
constant tension and the fluctuating temperature difference. As a result, the corresponding 391
numerical results are displayed in Fig. 6, where the tension p and the maximum thermal 392
stress are normalized by the uniaxial yield stress. 393
[image:18.595.151.448.316.523.2]394
Fig. 6. Shakedown limits calculated by the SCM and its comparison with the analytical 395
solution by Bree [48] for Type-I Bree problem. 396
It can be seen from Fig. 6 that the numerical results by the SCM are in good agreement 397
with the analytical solution, apart from some slight differences in the segment where p y 398
ranges from 0.0 to 0.5. This segment just corresponds to the alternating plasticity region of 399
shakedown boundary. The slight differences can be explained with the failure mechanism of 400
the structure when it fails to shake down. If the alternating plasticity mechanism is decisive 401
for shakedown, the maximum stress point in the structure will dominate the shakedown limit. 402
no Gauss points on them. The stress via the finite element calculation will be slightly lower 404
than the actual stress at the edge. Thus, the computed shakedown limit by the SCM is slightly 405
higher than the analytical solution in the alternating plasticity region. This merely 406
demonstrates that the difference is due to the finite element solution. If the finite element 407
discretization is finer, we will obtain a nearer solution to the exact one. 408
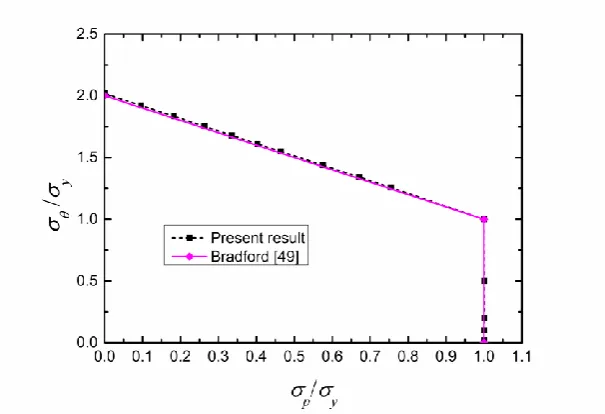
5.1.2 Type-II 409
The second type (Type-II) is the modified Bree problem, where the thermal load and the 410
mechanical load vary proportionally. The analytical solution of the Type-II Bree problem for 411
von Mises yield criterion has been obtained by Bradford [49], and the shakedown boundary 412
shown in Fig. 7 can be determined by 413
2 1 2
1 0 1
p
y y y
p
y y
(39)
414
The SCM is used to calculate the shakedown boundary of the Type-II problem, and the 415
corresponding numerical results are displayed in Fig. 7. That the maximum relative error 416
between the numerical results and the analytical solutions is no more than 0.9% demonstrates 417
the good accuracy of the SCM. 418
[image:19.595.147.450.512.719.2]419
Fig. 7. Shakedown limits calculated by the SCM and its comparison with the analytical 420
20
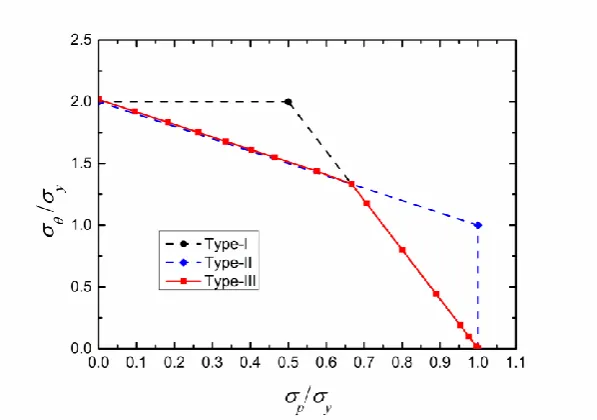
5.1.3 Type-III 422
The third type (Type-III) is another modified Bree problem, where the thermal load and 423
the mechanical load vary independently. Fig. 8 shows the numerical results of the shakedown 424
analysis by the SCM. 425
[image:20.595.150.449.182.392.2]426
Fig. 8. Shakedown limits calculated by the SCM for Type-III Bree problem. 427
It can be seen from Fig. 8 that the shakedown boundary of the Type-III Bree problem is 428
the lower envelope of the shakedown boundaries of the Type-I Bree problem and the Type-II 429
Bree problem. Therefore, a more stringent shakedown domain can be obtained when the 430
mechanical and thermal loads vary independently in a rectangle loading domain. Thus, the 431
loading condition of structural components must be assessed carefully in practical engineering 432
design. 433
For the three types of the Bree problems above, the procedures of the SCM for shakedown 434
analysis all present good convergence and the numerical results are in good agreement with 435
these analytical solutions. A typical iterative convergence process of the shakedown multiplier 436
for the load combination p0 is depicted in Fig.9, where the horizontal line segment 437indicates that the procedure of the SCM is being carried out in its inner iterative loop and the 438
jump point indicates the procedure of the SCM is being carried out in its outer iterative loop. 439
As a result, the y-axial component residual stress field of the plate is displayed in Fig. 10 440
442
Fig. 9. A typical iterative convergence process of the shakedown multiplier for the Bree 443
problem. 444
445
Fig. 10. Y-axial component residual stress field of the plate. 446
5.2 Square plate with a central circular hole 447
Tube sheets are usually used as supporting elements in heat exchangers and boilers. When 448
heated fluid passes through the tubes, the tube sheets undergo temperature difference, which 449
may cause thermal stresses in their bodies. The representative cell including a square plate 450
with a central circular hole (Fig.11) is established to investigate the load-carrying capability 451
[image:21.595.252.340.357.573.2]22
Due to the symmetry of the structure and the loading, only one quarter of the holed plate 453
is considered. The geometry of the structure and its quarter finite element model are shown in 454
Fig.11. The ratio between the diameter D of the circular hole and the length L of the square 455
plate is 0.2. The ratio between the thickness d of the plate and its length L is 0.05. The mesh 456
discretization consists of 432 8-node quadratic plane stress elements (ABAQUS CPS8) with 457
33 Gauss integration points. The material properties of the plate are the same as those given 458
in Table 1. 459
[image:22.595.118.459.247.425.2]460
Fig. 11. Geometry of the holed plate and its quarter finite element model. 461
The plate is subjected to three loads that consist of a temperature difference
t 462between the edge of the hole and the outer edge of the plate, and two uniform normal 463
tractions P1 and P2 at the vertical edge and the horizontal edge of the plate respectively. For 464
the convenience of comparison, the variation of the temperature with radius r is assumed the 465
same distribution as in [39, 46]: 466
0ln 5 2 ln 5
D r
(40)
467
which is an approximation to the temperature field corresponding to
0
at the edge 468of the hole and
0 around the outer edge of the plate. 469For the calculations of different initial elastic stress fields, P1*P2*360MPa,
00 470and * 90.2℃ have been adopted. The maximum von Mises stress at the edge of the 471
proposed procedure for shakedown analysis of the plate under multiple mechanical and 473
thermal loads, three different loading conditions have been considered here. 474
(1) Case I 475
We consider that the three loads vary independently in the following ranges: 476
* 1 1 1
* 2 2 2
* 3 0 0 0 P P P P (41) 477
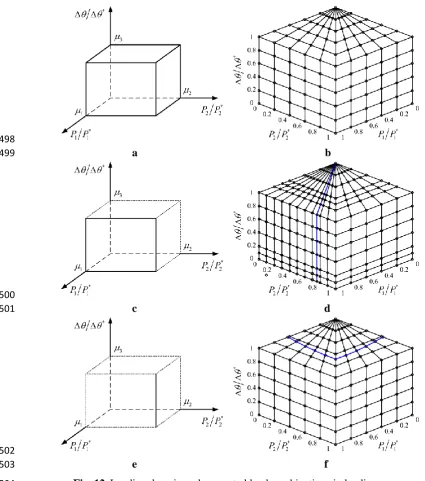
Then the loading domain becomes a cuboid in the space of load parameters, as shown in Fig. 478
12a. Considering the different ratios among
1,
2 and
3, 111 load combinations in the 479three-dimensional loading space are chosen for shakedown analysis of the plate, as illustrated 480
in Fig. 12b. 481
(2) Case II 482
Here we considerthat the mechanical load P1 keeps constant, and the mechanical load P2 483
and the thermal load vary independently, that is 484
* 1 1 1
* 2 2 2
* 3 0 0 P P P P (42) 485
Then the loading domain becomes a plane in the space of load parameters, as shown in Fig. 486
12c. In order to depict the shakedown domain clearly, 205 load combinations in the 487
three-dimensional loading space are chosen for shakedown analysis of the plate, as illustrated 488
in Fig. 12d. It is worth noting that the blue line plotted in Fig. 12d denotes these load 489
combinations of 2 1=0.761. 490
(3) Case III 491
Now we considerthat the mechanical loads P1 and P2 keep constant, and the thermal load 492
varies, that is 493
* 1 1 1
* 2 2 2
* 3 0 P P P P (43) 494
Then the loading domain becomes a line in the space of load parameters, as shown in Fig. 12e. 495
24 analysis of the plate, as illustrated in Fig.12f. 497
498
a b 499
500
c d 501
502
[image:24.595.57.483.99.581.2]e f 503
Fig. 12.Loading domain and computed load combinations in loading space. 504
The proposed algorithm is adopted to calculate the shakedown limits of the plate for the 505
three cases. Fig. 13a, b and c show the three-dimensional shakedown domains of the plate for 506
case I, case II and case III, respectively. 507
From Fig. 13a, one can observe that the 111 shakedown limit points are located in two 508
intersecting planes, i.e., the plane A-B-C and the plane B-C-D. It is worth noting that the 509
shakedown limit points in these two planes are both dominated by alternating plasticity 510
B-C-D-E and the surface A-B-E, and that the shakedown domain expands comparing to that 512
in Fig. 13a. Moreover, the blue line B-D in Fig. 13b denotes the shakedown limits 513
corresponding to the load combinations of 2 1=0.761, which are plotted as blue line in 514
Fig. 12d. It is worth noting that the shakedown limit points in the plane B-C-D-E are 515
dominated by alternating plasticity mechanism, and the points in the surface A-B-E are 516
dominated by ratcheting mechanism. From Fig. 13c, one can observe that the shakedown 517
boundaries consist of two surfaces A-B-E-D, B-C-F-E and the plane D-E-F-G, and the 518
shakedown domain further expands comparing to that in above two cases. It should be noted 519
that the shakedown limit points in the plane D-E-F-G are dominated by alternating plasticity 520
mechanism, and the points in both the surface A-B-E-D and the surface B-C-F-E are 521
dominated by ratcheting mechanism. 522
In order to verify the failure mechanism that dominates the shakedown boundaries of the 523
plate for different cases, several individual step-by-step incremental elastic-plastic 524
calculations are conducted, as depicted by the red, black and blue markers with capital letters 525
M, N and P in Fig. 13b and c. In both Fig. 13b and Fig. 13c, the load combination marked 526
with red “M” indicates shakedown behavior, while the load combination marked with black 527
“N” indicates alternating plasticity behavior and the red load combination marked with blue 528
“P” illustrates ratcheting behavior. As results, details relating to the effective plastic strains 529
over the first 15 load cycles at a Gauss point of the plate from the load combinations M, N and 530
P (Fig. 13b) are displayed in Fig. 14. Fig. 15 shows the effective plastic strains over the first 531
30 load cycles at a Gauss point of the plate from the three load combinations M, N and P (Fig. 532
13c). These results illustrate that the three load combinations M, N and P depicted in both Fig. 533
13b and Fig. 13c exhibit shakedown, alternating plasticity and ratcheting behavior, 534
respectively. The results from step-by-step incremental elastic-plastic analysis clearly reveal 535
26 537
a for case I 538
539
b for case II 540
541
[image:26.595.160.432.61.746.2]c for case III 542
544
Fig. 14. Effective plastic strains over the first 15 load cycles at a Gauss point of the plate from 545
load combinations M, N and P for case II. 546
547
Fig. 15. Effective plastic strains over the first 30 load cycles at a Gauss point of the plate from 548
load combinations M, N and P for case III. 549
To describe quantitatively these shakedown domains of the plate, numerical results of 550
shakedown analysis for some typical computed load combinations are given in Table 2. It is 551
worth noting that these calculated shakedown limits are marked with capital letters in Fig.13. 552
Assuming that one of the loads is equal to zero, the three-dimensional loading space 553
degenerates into the two-dimensional loading space. Then the shakedown limit points will be 554
presented as two-dimensional plot. Fig. 16a shows the shakedown domains of the plate in 555
[image:27.595.157.437.336.528.2]28
[image:28.595.59.508.120.578.2]when the mechanical load P2 vanishes for the three cases considered above. 558
Table 2 Numerical results of shakedown analysis in three-dimensional loading space. 559
Computed load combination
Shakedown limit (P1 y , P2 y , y )
Case I Case II Case III
A (0.609, 0, 0) (0.798, 0, 0) (0.798, 0, 0)
B (0.442, 0.442, 0) (0.798, 0.608, 0) (0.894, 0.894, 0)
C (0, 0, 2.002) (0, 0.609, 0) (0, 0.798, 0)
D (0, 0.609, 0) (0, 0, 2.002) (0.608, 0, 2.002)
E ---- (0.608, 0, 2.002) (0.685, 0.685, 2.002)
F ---- ---- (0, 0.608, 2.002)
G ---- ---- (0, 0, 2.002)
560
561
a thermal load vanishes b mechanical load P2 vanishes 562
Fig. 16. Shakedown domains of the plate in two-dimensional loading space. 563
As a typical example, the shakedown analysis of the holed plate under two loads has been 564
studied by several authors [28, 30, 39, 46, 50]. For the comparison purpose, some results from 565
[39, 46, 50] are plotted in Fig. 16 additionally. From Fig. 16a, we can observe that the present 566
results are in good agreement with the solutions from [50] but have some differences with 567
these from [39]. It should be stated that the discrepancy of the shakedown limits between our 568
results and these from [39] is mainly due to the different mesh discretization. From Fig. 16b, 569
we can observe that the present results are in good agreement with these from [39] but have 570
between our results and these from [46] is also due to the different mesh discretization. 572
5.3 Thick vessel with nozzles
573The third example is a thick vessel with nozzles, which is the key part of nuclear reactor 574
plant. One quarter of the geometric model is shown in Fig. 17. During the regular operation, 575
the reactor plant works under steady temperature and pressure. However, the vessel will be 576
subjected to a large temperature gradient and varying pressure while the reactor plant shuts 577
down, starts up or undergoes abnormal operating cases. In order to conveniently simulate the 578
cyclic process of the start-up, shutdown and abnormal operating case during the whole service, 579
we assume that the temperature history
t 0
t on the inside surface of the vessel 580with nozzles follows the curve in Fig. 18 and the internal pressure varies in the range 581
0, 0
P P . Due to the insulation treatment, the outside surfaces of the vessel and the nozzles 582
sustain constant temperature. The initial temperature of the structure and the environment 583
temperature are both 0 20℃. It is worth noting that the constant temperature period of the 584
temperature history depicted in Fig. 18 is long enough for the reactor plant to reach the steady 585
operation state. 586
[image:29.595.129.464.489.689.2]587
30 589
Fig. 18. Temperature history on the inside surface of the vessel and the nozzles. 590
Considering the symmetry of the structure and the loading, only one quarter of the thick 591
vessel with nozzles is established. Fig. 19 shows the finite element model of the structure, 592
where thesymmetric boundary conditions are used and the forces acting on the ends of the 593
vessel and nozzles are replaced with the equivalent uniformly distributed tensions to consider 594
closed end condition. In order to optimize the efficiency and accuracy of the calculation, the 595
finite element meshes around the stress concentration areas are refined properly. The mesh 596
discretization consists of 3358 elements and 16655 nodes. In calculations, the 20-node 597
quadratic brick elements (ABAQUS C3D20D) are used for the determination of the 598
temperature distribution and the 20-node quadratic brick elements with reduced integration 599
(ABAQUS C3D20R) are used for the structural stress analysis. 600
The material properties of the vessel with nozzles are given in Table 3. 601
602
Fig. 19. Finite element model of the thick vessel with nozzles. 603
604
[image:30.595.79.500.561.681.2]Table 3 Material properties of the thick vessel with nozzles. 606
Young’s modules E 2.1×10⁵ MPa
Poisson’s ratio v 0.3
Yield stress y 200 MPa
Density ρ 8100 kg/m3
Thermal conductivity 18 W/(m℃)
Specific heat capacity 430 J/(kg℃)
Coefficient of thermal expansion α 1.8×10⁻⁵ 607
5.3.1 Heat transfer analysis and elastic stress calculation 608
First, the transient heat transfer analysis is carried out to calculate the temperature field 609
history of the entire body. As a result, temperature histories of nodes 1282 and 1345 are 610
shown in Fig.20, each of which represents a node on the inside or the outside surface of the 611
vessel respectively. Then the structural stress analysis is followed to calculate the thermal 612
elastic stress field and the mechanical elastic stress field. The dangerous moments for the 613
vessel with nozzles under thermal load are at 12000 s and 48000 s, which are just the final 614
moments of the start-up and the shutdown respectively. Fig. 21a and b show the temperature 615
field distributions of the vessel with nozzles at 12000 s and 48000 s, respectively. The 616
corresponding von Mises elastic stress fields are displayed in Fig. 22a and b, respectively. It 617
should be noted that although the distributions of von Mises elastic stress field in Fig.22a and 618
b are the same, the directions of stress fields at 12000 s and 48000 s are opposite, and thus the 619
structure suffers from the maximum stress range between the two moments. The von Mises 620
32 622
Fig. 20. Temperature histories of nodes 1282 and 1345. 623
624
[image:32.595.57.504.296.649.2]a at 12000 s b at 48000 s 625
Fig. 21. Temperature distributions of the thick vessel with nozzles. 626
627
a at 12000 s b at 48000 s 628
[image:32.595.76.503.495.637.2]630
Fig. 23. Von Mises elastic stress field of the thick vessel with nozzles under internal pressure. 631
5.3.2 Shakedown analysis 632
The SCM is used to calculate the shakedown limit of the thick vessel with nozzles. 633
Considering the randomness of the varying temperature gradient and internal pressure, four 634
vertices are used to define the loading domain (Fig. 24), which include two instants for 635
thermal load at t = 12000 and 48000 s and two instants for pressure load at P = 0 and 15.5 636
MPa. The applied total elastic stress history consists of thermal and pressure components: 637
0
is the von Mises elastic thermal stress which is associated with the current thermal load 638
0
, and
0
P
is the von Mises elastic stress corresponding to the internal pressure 639
0 15.5 MPa
P . The load multiplier
is determined so that0
and
0
P
become the 640
shakedown limit, for various proportions of the two components. For the simplicity of 641
description, the angle
ranging from 0° to 90° is introduced to denote the different 642proportions of the two stress components. 643
644
[image:33.595.220.376.607.740.2]34
On basis of the previously calculated elastic stress fields (Fig. 22 and Fig. 23), the 646
shakedown limit multipliers
are computed for different angles
in two-dimensional 647loading space considering the thermal load and mechanical load P varying 648
independently. The numerical results of the shakedown analysis by the SCM as well as the 649
corresponding computing time are all listed in Table 4. The shakedown domain of the thick 650
vessel with nozzles is shown in Fig.25. 651
The shakedown boundary curve is defined by three segments with the intersection points 652
at 30 and 56 , which are plotted in Fig. 25 additionally. It is worth noting that the 653
three segments of shakedown boundary are all dominated by alternating plasticity mechanism, 654
and the difference is due to the different locations of the maximum von Mises stress point. 655
Under various combinations of the mechanical and thermal loads, all the calculations by 656
the SCM for shakedown analyses of the thick vessel with nozzles present good convergence. 657
As an example, Fig. 26 depicts the iterative convergence process of the shakedown multiplier 658
for the load combination
0 P P0
which corresponds to 45 . It is worth noting 659
that although the procedure initiates at a relatively high load multiplier, the load multiplier 660
decreases rapidly to a steady value, and then it approaches smoothly to the shakedown limit. 661
Moreover, the von Mises residual stress field of the thick vessel with nozzles for this case is 662
shown in Fig.27 when the shakedown limit reaches. 663
According to the conclusions in [12], the shakedown limit of the thick vessel with nozzles 664
is the minimum one of its plastic limit and its double elastic limit when the system is 665
subjected to the single internal pressure. For the applied internal pressure P0= 15.5 MPa, the 666
maximum von Mises elastic stress occurs at the corner of the vessel with nozzles (Fig. 23) 667
and its value is 217.9 MPa. Therefore, the corresponding shakedown limit multiplier
668(according to double elastic limit criterion) under the internal pressure is calculated as 669
follows: 670
2 200MPa
1.836 217.9MPa
(44)
671
The value is in excellent agreement with the numerical result by the SCM, which has the 672
same load multiplier 1.836. This also indicates that the alternating plasticity mechanism is 673
In order to evaluate the computational efficiency of the novel SCM for shakedown 675
analysis, the CPU time to calculate shakedown limit of the thick vessel with nozzles under 676
load combination
0= 0
P P
by the SCM, the linear matching method (LMM) [38] 677
and the step-by-step analysis are compared in Table 5. It can be seen from Table 5 that, with 678
necessary accuracy of these calculations, the CPU time by the step-by-step analysis is more 679
than 40 times that by the SCM while the CPU time by the LMM is about 3 times that by the 680
SCM. The usage of the SCM is much cheaper and more efficient than the LMM and the 681
[image:35.595.67.513.318.692.2]step-by-step analysis. 682
Table 4 Numerical results and computing time for the shakedown analysis of the thick vessel 683
with nozzles. 684
0
P P
0
CPU time (s)
0° 1.836 0 190
5° 1.671 0.146 193
10° 1.531 0.270 211
15° 1.410 0.378 187
20° 1.301 0.474 190
25° 1.203 0.561 186
30° 1.112 0.642 209
35° 1.021 0.715 199
40° 0.934 0.784 195
45° 0.851 0.851 185
50° 0.768 0.915 187
55° 0.687 0.981 188
56° 0.669 0.992 160
60° 0.586 1.014 156
70° 0.388 1.066 151
80° 0.196 1.113 130
90° 0 1.160 128
685