Report Card Grades on the Physical Activity of Children and Youth
Comparing 30 Very High Human Development Index Countries
Salomé Aubert, Joel D. Barnes, Nicolas Aguilar-Farias, Greet Cardon, Chen-Kang Chang, Christine Delisle Nyström, Yolanda Demetriou, Lowri Edwards, Arunas Emeljanovas, Aleš Gába,
Wendy Y. Huang, Izzeldin A.E. Ibrahim, Jaak Jürimäe, Peter T. Katzmarzyk, Agata Korcz, Yeon Soo Kim, Eun-Young Lee, Marie Löf, Tom Loney, Shawnda A. Morrison, Jorge Mota,
John J. Reilly, Blanca Roman-Vinas, Natasha Schranz, John Scriven, Jan Seghers,˜
Thomas Skovgaard, Melody Smith, Martyn Standage, Gregor Starc, Gareth Stratton, Tim Takken, Tuija Tammelin, Chiaki Tanaka, David Thivel, Richard Tyler, Alun Williams, Stephen H.S. Wong,
Paweł Zembura, and Mark S. Tremblay
Background: To better understand the childhood physical inactivity crisis, Report Cards on physical activity of children and youth were prepared concurrently in 30 very high Human Development Index countries. The aim of this article was to present, describe, and compare thefindings from these Report Cards.Methods: The Report Cards were developed using a harmonized process for data gathering, assessing, and assigning grades to 10 common physical activity indicators. Descriptive statistics were calculated after converting letter grades to interval variables, and correlational analyses between the 10 common indicators were performed using Spearman’s rank correlation coefficients. Results: A matrix of 300 grades was obtained with substantial variations within and between countries. Low grades were observed for behavioral indicators, and higher grades were observed for sources of influence indicators, indicating a disconnect between supports and desired behaviors.Conclusion: This analysis summarizes the level and context of the physical activity of children and youth among very high Human Development Index countries, and provides additional evidence that the situation regarding physical activity in children and youth is very concerning. Unless a major shift to a more active lifestyle happens soon, a high rate of noncommunicable diseases can be anticipated when this generation of children reaches adulthood.
Keywords: children physical activity, sedentary behavior, international comparison, Global Matrix
Aubert, Barnes, and Tremblay are with Healthy Active Living and Obesity Research Group, CHEO Research Institute, Ottawa, Ontario, Canada. Aguilar-Farias is with the Department of Physical Education, Sports and Recreation, Universidad de La Frontera, Temuco, Chile; and UFRO Actívate Research Group, Universidad de La Frontera, Temuco, Chile. Cardon is with the Department of Movement and Sports Sciences, Ghent University, Ghent, Belgium. Chang is with the Department of Sport Performance, National Taiwan University of Sport, Taichung, Taiwan. Delisle Nyström is with the Department of Biosciences and Nutrition, Karolinska Institutet, Huddinge, Sweden. Demetriou is with the Department of Sport and Health Sciences, Technical University of Munich, Munich, Germany. Edwards, Stratton, and Tyler are with Applied Sport Technology Exercise and Medicine Research Centre, Swansea University, Swansea, United Kingdom. Emeljanovas is with Lithuanian Sports University, Kaunas, Lithuania. Gába is with the Faculty of Physical Culture, Palacký University Olomouc, Olomouc, Czech Republic. Huang is with the Department of Sport and Physical Education, Hong Kong Baptist University, Hong Kong, China. Ibrahim is with Aspetar Orthopedic and Sports Medicine Hospital, Doha, Qatar. Jürimäe is with the Faculty of Medicine, Institute of Sport Sciences and Physiotherapy, University of Tartu, Tartu, Estonia. Katzmarzyk is with Pennington Biomedical Research Center, Baton Rouge, LA, USA. Korcz is with the Department of Didactics of Physical Activity, PoznańUniversity of Physical Education, Poznań, Poland. Kim is with the Department of Physical Education, Seoul National University, Seoul, South Korea; and the Seoul National University Institute of Sports Science, Seoul, Republic of Korea. Lee is with the School of Kinesiology and Health Studies, Queen’s University, Kingston, Ontario, Canada. Löf is with Group MLÖ, Department of Biosciences and Nutrition, Karolinska Institutet, Solna, Sweden; and the Department of Medicine and Health Sciences, Linköping University, Linköping, Sweden. Loney is with the College of Medicine, Mohammed Bin Rashid University of Medicine and Health Sciences, Dubai, United Arab Emirates. Morrison is with the Faculty of Health Sciences, University of Primorska, Izola, Slovenia. Mota is with the Centro de Investigação em Atividade Física Saúde e Lazer (CIAFEL-FADEUP), University of Porto, Porto, Portugal. Reilly is with the Physical Activity for Health Group, University of Strathclyde, Glasgow, Scotland. Roman-Vinas is with Nutrition Research Foundation, Barcelona, Spain; the School of Health and Sport Sciences (EUSES),˜ Universitat de Girona, Salt, Spain; and the CIBER Physiopathology of Obesity and Nutrition (CIBEROBN), Instituto de Salud Carlos III, Madrid, Spain. Schranz is with the Alliance for Research in Exercise, Nutrition and Activity, School of Health Sciences, University of South Australia, Adelaide, South Australia, Australia. Scriven is with Jersey Sport Foundation, Jersey, United Kingdom. Seghers is with the Department of Movement Sciences, KU Leuven, Leuven, Belgium. Skovgaard is with the Research and Innovation Centre for Human Movement and Learning, University of Southern Denmark, Odense, Denmark; and the Research Unit for Active Living, Department of Sports Science and Clinical Biomechanics, University of Southern Denmark, Odense, Denmark. Smith is with the School of Nursing, The University of Auckland, Auckland, New Zealand. Standage is with the Department for Health, Centre for Motivation and Health Behaviour Change, University of Bath, Bath, United Kingdom. Starc is with the Faculty of Sport, University of Ljubljana, Ljubljana, Slovenia. Takken is with Wilhelmina Children’s Hospital, University Medical Center Utrecht, Utrecht, The Netherlands. Tammelin is with the LIKES Research Centre for Physical Activity and Health, Jyväskylä, Finland. Tanaka is with the Division of Integrated Sciences, J. F. Oberlin University, Machida, Japan. Thivel is with the Laboratory of Metabolic Adaptations to Exercise Under Physiological and Pathological Conditions (AME2P), Research Center for Human Nutrition (CRNH Auvergne), Clermont Auvergne University, Clermont-Ferrand, France. Williams is with Guernsey Education Services, St. Peter Port, Guernsey. Wong is with the Department of Sport and Physical Education, The Chinese University of Hong Kong, Hong Kong, China. Zembura is with Social Challenges Unit, The Robert B. Zajonc Institute of Social Science, University of Warsaw, Warsaw, Poland.Tremblay (mtremblay@cheo.on.ca) is corresponding author.
S298
Journal of Physical Activity and Health,2018, 15(Suppl 2), S298-S314
https://doi.org/10.1123/jpah.2018-0431
A compelling body of empirical work shows moderate to high levels of physical activity to be associated with a lower risk of cardiovascular disease and all-cause mortality among adults.1 Con-versely, physical inactivity has been recognized by some as “the biggest public health problem of the 21st century.”2,3Among school-aged children and adolescents, meeting physical activity guidelines is associated with positive physical, psychological, social, and cognitive health indicators,4,5 while physical inactivity, defined as not meeting physical activity guidelines, is associated with adverse physical, mental, social, and cognitive health outcomes.4–7
The Human Development Index (HDI) is a composite index, ranging from 0 to 1, calculated using education, life expectancy, and per capita income.8 This index was created by the United Nations Development Programme to rank countries on a scale of human development conceptualized in terms of capabilities of humans within the countries to function.9 To be classified as very high HDI, the score of a country must be equal or superior to 0.80. Among children living in countries categorized as being very high by the HDI, moderate- to vigorous-intensity physical activity (MVPA) was positively related to markers of cardiovas-cular health10–13and self-reported health-related quality of life.14 Physical inactivity has been estimated to be responsible for at least 10% and 9% of all-cause mortality in North American and in European countries, respectively.15Furthermore, very high-income countries bear the largest proportion of economic burden of physical inactivity worldwide (81% of health care costs and 60% of indirect costs).16However, the majority of children17–21 and youth19–25 do not meet the current recommendations of 60 minutes of MVPA per day26in very high HDI European and North American countries and regions. Similar findings were observed among children and/or adolescents from other very high HDI countries or regions such as Australia,6Chile,27Chinese Taipei (Taiwan),28Hong Kong,29Japan,30South Korea,31Qatar,32 and the United Arab Emirates.32–34Very high HDI countries share similar characteristics in terms of education, life expectancy, and income; however, differences also exist geographically, politically, culturally, religiously, and environmentally that may influence physical activity behavior differently across the very high HDI countries. Cooper et al35 found that there was substantial between-country variation in objectively measured MVPA in the International Children’s Accelerometry Database, even between apparently similar countries, and concluded that further research is needed to explore environmental and sociocultural explanations for these differences.
To develop a better understanding of childhood physical activity and inactivity across countries, the first Global Matrix (Global Matrix 1.0) of Report Card grades on physical activity was launched in 2014.36Report Cards, based on the Canadian Report Card model,37were developed by research teams from 15 countries (including 8 very high HDI countries) using a harmonized process for data gathering, assessing, and assigning grades.36 For each participating country, grades were assigned to 9 common physical activity indicators: Overall Physical Activity, Organized Sport Participation, Active Play, Active Transportation, Sedentary Be-haviors, Family and Peers, School, Community and Environment, and Government Strategies and Investments. Global Matrix 1.0 grades provided new information upon which researchers, advo-cates, practitioners, and policy-makers could reflect and derive inspiration for children’s physical activity research projects and promotion activities around the world.36
Building on the Global Matrix 1.0, investigators from each participating country committed to repeat and further develop the
Global Matrix initiative along with teams of researchers from 23 new countries. The Global Matrix 2.0, which was released in 2016 in Bangkok, presented a comprehensive summary of the physical activity behaviors and sources of influence indicators from 38 countries (including 24 very high HDI countries).38 Findings suggested the presence of a complex variety of strengths and limitations across the participating countries, with some universal patterns emerging when comparing countries by continent, HDI, or income inequality. For example, a strong positive correlation was found between the source of influence grades (combining the grades from Family and Peers, School, Community and Environment, and Government Strategies and Investments) and HDI.38
In 2017, the Active Healthy Kids Global Alliance39(AHKGA) called for more countries to participate in the Global Matrix 3.0. Forty-nine countries registered and followed the harmonized steps to develop their country’s Report Card. Out of the 49 participating countries, 30 (61%) were very high HDI countries, from 5 different continents: Asia (n = 6), Europe (n = 19), North America (n = 2), Oceania (n = 2), and South America (n = 1). The aim of this article is to present, describe, and compare the Report Card grades from the very high HDI countries and regions participating in the Global Matrix 3.0: Australia, Belgium (Flanders), Canada, Chile, Taiwan, Czech Republic, Denmark, England, Estonia, Finland, France, Germany, Guernsey, Hong Kong, Japan, Jersey, Lithuania, The Netherlands, New Zealand, Poland, Portugal, Qatar, Scotland, Slovenia, South Korea, Spain, Sweden, the United Arab Emirates, the United States, and Wales. Companion papers published in this issue of the Journal of Physical Activity and Healthpresent the collective results from the low and medium HDI countries, and the high HDI countries.
Methods
The AHKGA distributed an open call through established networks for interested countries and opened registration for the Global Matrix 3.0 in April 2017. As a result, 49 countries from 5 different continents fully participated in the Global Matrix 3.0. Workgroups consisting of experts and stakeholders were established in each country to gather the highest quality and most recently published and unpublished evidence. The workgroups critically appraised the available evidence and reported on 10 common indicators (Overall Physical Activity, Organized Sport and Physical Activity, Active Play, Active Transportation, Sedentary Behaviors, Physical Fitness, Family and Peers, School, Community and Environment, and Government) for school-aged children and youth (∼5–17 y old). Through a harmonized and transparent Report Card develop-ment process, each country’s workgroup compiled the available evidence from local, national, or international studies, national surveys, and official reports, and then synthesized findings and reached consensus for the grading of each indicator. Full details of the Report Card development process based on the Canadian Report Card model37 have been previously described and the detailed methods for the Global Matrix 3.0 are described in a companion paper published in this issue of theJournal of Physical Activity and Health.40
For each of the 49 registered countries, up to 3 joint Report Card leaders were charged with forming a multidisciplinary research workgroup (including physical activity experts, stake-holder groups, and communication specialists) to manage the Report Card project, and to ensure the effective communication between AHKGA and the Report Card team. The workgroups
identified andfinalized the list of indicators to be graded (ie, the 10 common indicators and potential additional ones that would be included in their national Report Card but not in the Global Matrix 3.0), and compiled potentially relevant data sets and documents that would be used to inform the grades. Countries were advised to consider and synthesize the best available evidence from approxi-mately the past 5 years for each indicator. Common benchmarks, presented in Table1, and a common grading scheme, shown in Table 2, were provided by the AHKGA to the 49 Report Card workgroups. Experts in each country evaluated the compiled evidence and reached consensus on the grade assigned for each indicator. Draft country Report Card grades were submitted along with their rationale and were audited by the members of the AHKGA Executive Committee to ensure that the grades were consistent with the harmonized benchmarks and grading scheme. The Report Card leaders were also asked to report details
concerning the data sets used to inform their overall physical activity grade (ie, subjective or objective measures, representative-ness, instrument used, age range, and sample size).
For analysis purposes, the 49 participating countries and regions were divided into 3 categories using the United Nations’ HDI groupings (low or medium, high, and very high). The results and analyses presented in this article are on the 30 very high HDI participating countries.
[image:3.612.40.584.284.756.2]Descriptive statistics (average grade and SD) were calculated after converting categorical variables (letter grades) to interval variables (see corresponding numbers in Table2), and the incom-plete grades (INC) converted into“No Grade”which was treated as a missing value. Averages were calculated from the interval values and thefloor (for a given value, the greatest integer less than or equal to the average value) was converted back to a letter grade. Three scores were computed for analysis: (1) overall score,
Table 1 Global Matrix 3.0 Indicators and Benchmarks Used to Guide the Grade Assignment Process
Indicator Benchmark
Overall Physical Activity
% of children and youth who meet the Global Recommendations on Physical Activity for Health, which recommend that children and youth accumulate at least 60 minutes of moderate- to vigorous-intensity physical activity per day on average. Or % of children and youth meeting the guidelines on at least 4 days a week (when an average cannot be estimated). Organized Sport and
Physical Activity
% of children and youth who participate in organized sport and/or physical activity programs.
Active Play % of children and youth who engage in unstructured/unorganized active play at any intensity for more than 2 hours a day. % of children and youth who report being outdoors for more than 2 hours a day.
Active Transportation % of children and youth who use active transportation to get to and from places (eg, school, park, mall, friend’s house). Sedentary Behaviors % of children and youth who meet the Canadian Sedentary Behaviour Guidelines (5- to 17-year-olds: no more than 2 hours of
recreational screen time per day). Note: the Guidelines currently provide a time limit recommendation for screen-related pursuits, but not for non-screen-related pursuits.
Physical Fitness Average percentile achieved on certain physicalfitness indicators based on the normative values published by Tomkinson et al.41
Family and Peers % of family members (eg, parents, guardians) who facilitate physical activity and sport opportunities for their children (eg, volunteering, coaching, driving, paying for membership fees and equipment). % of parents who meet the Global Recommendations on Physical Activity for Health, which recommend that adults accumulate at least 150 minutes of moderate-intensity aerobic physical activity throughout the week or do at least 75 minutes of vigorous-moderate-intensity aerobic physical activity throughout the week or an equivalent combination of moderate- and vigorous-intensity physical activity. % of family members (eg, parents, guardians) who are physically active with their kids.
% of children and youth with friends and peers who encourage and support them to be physically active. % of children and youth who encourage and support their friends and peers to be physically active.
School % of schools with active school policies (eg, daily PE, daily physical activity, recess,“everyone plays”approach, bike racks at school, traffic calming on school property, outdoor time).
% of schools where the majority (≥80%) of students are taught by a PE specialist.
% of schools where the majority (≥80%) of students are offered the mandated amount of PE (for the given state/territory/ region/country). % of schools that offer physical activity opportunities (excluding PE) to the majority (>80%) of their students. % of parents who report their children and youth have access to physical activity opportunities at school in addition to PE classes. % of schools with students who have regular access to facilities and equipment that support physical activity (eg, gymnasium, outdoor playgrounds, sportingfields, multipurpose space for physical activity, equipment in good condition). Community and
Environment
% of children or parents who perceive their community/municipality is doing a good job at promoting physical activity (eg, variety, location, cost, quality). % of communities/municipalities that report they have policies promoting physical activity.
% of communities/municipalities that report they have infrastructure (eg, sidewalks, trails, paths, bike lanes) specifically geared toward promoting physical activity.
% of children or parents who report having facilities, programs, parks and playgrounds available to them in their community. % of children or parents who report living in a safe neighborhood where they can be physically active.
% of children or parents who report having well-maintained facilities, parks and playgrounds in their community that are safe to use.
Government Evidence of leadership and commitment in providing physical activity opportunities for all children and youth. Allocated funds and resources for the implementation of physical activity promotion strategies and initiatives for all children and youth. Demonstrated progress through the key stages of public policy making (ie, policy agenda, policy formation, policy implementation, policy evaluation and decisions about the future).
JPAH 15 Supplement 2, 2018 S300 Aubert et al
(2) behavioral score (Overall Physical Activity, Organized Sport and Physical Activity Participation, Active Play, Active Transpor-tation, and Sedentary Behaviors), and (3) sources of influence score (Family and Peers, School, Community and Environment, and Government). Scores for each group of indicators were calculated by summing the relevant interval data. INC grades were removed and the scores were reweighted accordingly. Categorical variables (letter grades) were grouped into 1 of 4 levels (“A–B,” “C,” “D–F,” and“No Grade”) based on the overall score. These categories were then used to rank countries by letter grade/score and category level in scatter plot data visualizations. Correlational analyses between the 10 common indicators were performed using Spearman’s rank correlation coefficients. Pairwise deletion was used to treat missing data (INC) instead of other techniques (eg, listwise deletion) in order to minimize the number of cases excluded from the analysis. All statistical analyses were performed using R (version 3.4.1; The R Foundation for Statistical Computing, Vienna, Austria). Several packages were loaded to extend base R including corrplot,42 ggplot2,43UpSetR,44and VIM.45In addition, descriptive statistics of the qualitative information regarding the measurement of overall physical activity were performed.
Results
The sociodemographic characteristics of the 30 very high HDI countries are presented in Table3. The HDI scores ranged from 0.840 for the United Arab Emirates to 0.985 for Jersey. Chile was the country with the lowest gross national income per capita, the highest Gini index (highest income inequality), and the highest child poverty rate (0.225). Qatar had the highest gross national income per capita, the lowest relative public health expenditure, and the highest Gender Inequality Index. Slovenia had the lowest Gini index (least income inequality) and the lowest percentage of urban population (49.8%). The life expectancy at birth was above 80 years for most of the countries (23 countries, 77%), with a maximum of 84.2 years for Hong Kong. Lithuania had a notably lower life expectancy of 73.5 years compared with other countries. The mean years of schooling ranged from 8.9 years in Portugal to
13.3 years in the United Kingdom nations (England, Scotland, and Wales). Finally, population density ranged from 3.2 people/km2of land area for Australia, to 6987.2 people/km2of land area for Hong Kong. In summary, despite all 30 countries being within the very high HDI category, countries varied substantially in other characteristics.
The 30 country grades for the 10 core Report Card indicators (300 grades or INC in total) and the average grades for each country are shown in Table4, and the corresponding descriptive informa-tion is presented in Table5. In total, 233 letter grades and 67 INC grades were assigned (Table 4). The country with the highest average grade was Slovenia with“B,”and the countries with the lowest average grade were Chile and the United States with“D.” All 30 countries assigned a grade to Sedentary Behaviors, 29 countries (97%) to Overall Physical Activity, and 28 countries (93%) to Organized Sport and Physical Activity and to Active Transportation. Active Play was the indicator with the largest number of INC grades (n = 20), followed by Physical Fitness (n = 13), and Family and Peers (n = 13). The indicator with the highest average grade was Community and Environment with“B −,”while the indicator with the lowest average grade was Overall Physical Activity with “D−.” An average grade of “D+” was obtained for the behavioral indicators combined, “C+” for the source of influence indicators combined, and“C−”was the overall average for the 233 grades. Qatar’s Report Card workgroup decided not to evaluate Active Transportation and considered it “not applicable” because of unsafe road conditions and the hot climate during most times of the year.56 Correlation analyses showed that there were no relationships between the Overall Physical Activity grade and any of the other 9 core indicator grade (results not shown). Frequency plots illustrating the distribution of the overall 233 grades as well as the behavioral and the sources of influence indicators are presented in Figures 1Aand1B, respec-tively. A normal distribution of the letter grades is evident in both Figures 1Aand 1B, with the mode being “C”for the 233 letter grades overall,“D”for the behavioral indicators, and“B”for the sources of influence indicators.
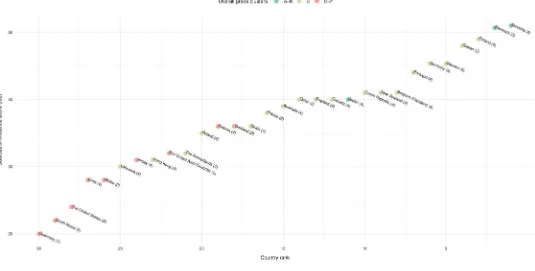
[image:4.612.36.580.83.289.2]A plot for the overall score for each country estimated from the 10 indicators is presented in Figure2, and the behavioral and the Table 2 Global Matrix 3.0 Grading Rubric
Grade Interpretation
Corresponding number for analysis
A+ 94%–100% 15
A We are succeeding with a large majority of children and youth (87%–93%) 14
A− 80%–86% 13
B+ 74%–79% 12
B We are succeeding with well over half of children and youth (67%–73%) 11
B− 60%–66% 10
C+ 54%–59% 9
C We are succeeding with about half of children and youth (47%–53%) 8
C− 40%–46% 7
D+ 34%–39% 6
D We are succeeding with less than half but some children and youth (27%–33%) 5
D− 20%–26% 4
F We are succeeding with very few children and youth (<20%) 2
INC Incomplete—insufficient or inadequate information to assign a grade No Grade
Table 3 Sociodemographic Information of the 30 Very High HDI Countries in the Global Matrix 3.0 Country HDI a GNI per capita a Public health expenditure (% of GDP) a GII a Life expectancy at birth a Mean years of schooling a Gini index b Global food security index c Child pove rty rate d Urban population percentage e
Population density (people/km
2 ) f Australia 0.939 42,822 6.3 0.12 82.5 13.2 34.7 83.3 0.13 89.4 3 Belgium 0.896 41,243 8.3 0.073 81.0 11.4 27.7 79.8 0.11 97.5 374 Canada 0.92 42,582 7.4 0.098 82.2 13.1 34.0 82.2 0. 171 80.8 4 Chile 0.847 21,665 3.9 0.322 82.0 9.9 47.7 74.7 0. 225 89.4 24 Czech Repu blic 0.878 28,144 6.3 0.129 78.8 12.3 25.9 75.8 0. 105 73.4 137 Denmark 0.925 44,519 9.2 0.041 80.4 12.7 28.2 80.3 0. 029 87.1 136 England 0.909 37,931 7.6 0.131 80.8 13.3 33.2 84.2 0. 112 79.7 271 Estonia 0.865 26,362 5.0 0.131 77.0 12.5 32.7 0. 121 69.5 31 Finland 0.895 38,868 7.3 0.056 81.0 11.2 27.1 81.0 0. 037 83.8 18 France 0.897 38,085 9.0 0.102 82.4 11.6 32.7 82.3 0. 113 86.4 122 Germany 0.926 45,000 8.7 0.066 81.1 13.2 31.7 82.5 0. 095 74.1 236 Guernsey f 0.975 82.6 40.0 850 Hong Kong 0.917 54,265 84.2 11.6 100.0 6987 Japan 0.903 37,268 8.6 0.116 83.7 12.5 32.1 79.5 91.9 348 Jersey g 0.985 81.9 41.0 845 Lithuania 0.848 26,006 4.4 0.121 73.5 12.7 37.4 0. 191 67.2 46 The Netherlands 0.924 46,326 9.5 0.044 81.7 11.9 29.3 82.8 0. 102 83.6 506 New Zealand 0.915 32,870 9.1 0.158 82.0 12.5 81.0 0. 141 86.3 18 Poland 0.855 24,117 4.5 0.137 77.6 11.9 31.8 74.1 0. 134 60.8 124 Portugal 0.843 26,104 6.2 0.091 81.2 8.9 35.5 79.0 0. 155 61.6 113 Qatar 0.856 129,916 1.9 0.542 78.3 9.8 73.3 98.9 221 Scotland 0.909 37,931 7.6 0.131 80.8 13.3 33.2 84.2 0. 112 79.7 271 Slovenia 0.89 28,664 6.6 0.053 80.6 12.1 25.4 49.8 103 South Korea 0.901 34,541 4.0 0.067 82.1 12.2 31.6 0. 071 83.5 526 Spain 0.884 32,779 6.4 0.081 82.8 9.8 36.2 78.1 0. 221 77.6 93 Sweden 0.913 46,251 10.0 0.048 82.3 12.3 29.2 81.7 0. 091 85.4 24 Taiwan h 0.885 45,582 80.2 33.6 United Arab Emirates 0.84 66,203 2.6 0.232 77.1 9.5 70.9 84.7 111 United States 0.92 53,245 8.3 0.203 79.2 13.2 41.5 84.6 0. 199 82.6 35 Wales 0.909 37,931 7.6 0.131 80.8 13.3 33.2 84.2 0. 112 79.7 271 Abbr eviatio ns: GDP, Gross Dome stic Pro duct ; GII, Ge nder In equality Index; GNI, Gross Natio nal Incom e; HDI, Hum an Deve lopmen t Index. Sou rces of inf ormation: aUni ted Na tions De velopm ent Pro gramm e. 8 b,f The World B ank. 46 , 47 cThe Econ omist Inte lligenc e Unit. 48 dOrganisatio n for Eco nomic C o-opera tion an d Develo pme nt Chil d (OECD) Well-Bei ng Data Por tal. 49 eUnite d N ations, Depa rtment of Econom ic and Soc ial Affairs. 50 fFor Guerns ey, the HDI sourced from the Unite d Natio ns Econ omic and Socia l C ommission for Asia an d the Paci fi c, 51 the life expec tancy at birth, po pulation size, and the po pulation density sour ced from the Unite d States Centr al Inte lligenc e Agen cy, 52 an d the Gini inde x sourced from the State of Guer nsey . 53 gFor Jersey, the HDI sour ced from the Uni ted Na tions Eco nomic and Soc ial Comm ission for Asia and the Paci fi c, 51 and the life expec tancy at birth , popu lation size , and the popula tion density sou rced from the United States C entral In telligen ce Agen cy, 52 and the Gin i index sourced from the Stat e o f Jers ey. 54 hFor Tai wan, the HDI , the GNI per capita , the life expec tancy at birth, and the Gini index com e from the Natio nal Statistics, Republic of China (Taiw an). 55 For Eng land, Scotland , and Wa les, the of fi cial data fo r the Unite d Kingd om we re repo rted.
S302 JPAH 15 Supplement 2, 2018
[image:5.612.62.554.60.746.2]source of influence scores in Figures3and4, respectively. For the overall score, Slovenia rankedfirst while Chile ranked 30th (see more rankings in Figure2). In terms of the grading completion, the United Arab Emirates had only 4 graded indicators that were included in the calculation of this score, while 4 other countries (Slovenia, Finland, Czech Republic, and Canada) had all 10 indicators graded. For the behavioral score, Japan ranked first while Estonia ranked 30th (see more rankings in Figure 3). The United Arab Emirates had only 2 out of 5 indicators, and Japan and Qatar only had 3 graded indicators that were included in the calculation of the behavioral score. Similar to the overall score, Slovenia also rankedfirst for the sources of influence score, while Guernsey, with only one out of 4 graded indicators available, ranked 30th (see more rankings in Figure4).
Finally, the description of the data sources used to inform the Overall Physical Activity grade for each country (except for Japan that had an INC) are presented inSupplemental Material[available online]. In total, 87 surveys or studies informed the grades of the
[image:6.612.38.574.93.497.2]very high HDI countries, representing a total sample size of 1,005,989 children and youth. A total of 21 surveys/studies used an objective measurement of physical activity, while 66 used a subjective method, mostly via self-administered question-naires. Out of 21 surveys/studies that measured physical activity objectively, 20 used accelerometry and one study used pedometry. A minimum wear time for accelerometer ranged between 3 and 7 consecutive days, and 9 different accelerometer cut points were applied for analysis across 20 surveys/studies with the most commonly used cut points (n = 8) from Evenson et al.57Regarding the subjective measurement of physical activity, survey-specific questionnaires were used in a significant number of surveys (n = 35), followed by original or adapted versions of the Health Behaviour in School-Aged Children questionnaire (n = 14), uniquely in European countries, theGlobal School-based Student Health Survey questionnaire (n = 5), the Youth Risk Behavior Surveillance Systemquestionnaire (n = 4), theInternational Physi-cal Activity Questionnaire(n = 3), and others (n = 5).
Table 4 Grades Assigned to the 10 Core Physical Activity Indicators for the 30 Very High HDI Countries of the Global Matrix 3.0
PA SP AP AT SB PF FAM SCH COM GOV AVG
Australia D− B− INC D+ D− D+ C+ B+ A− D C−
Belgium (Flanders) F B INC C+ C INC C+ B− B B C
Canada D+ B+ D D− D+ D C+ B− B+ C+ C−
Chile D− D− INC F C− D F D B B− D
Czech Republic D B− D− C+ D− C+ C+ B+ B C+ C
Denmark D− A− INC B+ D+ INC INC A− B+ A− B−
England C− D+ INC C− D+ C− INC B+ C INC C−
Estonia D− C F D F INC D C+ B B D+
Finland D C+ C B+ D− C B− A B+ A− C+
France D C− INC C− D− B− INC B INC C C−
Germany D− B D− C− D− INC B− B+ B+ INC C
Guernsey D C+ INC D C INC INC INC INC D D+
Hong Kong C− C INC B+ C− D D− C B C C−
Japan INC B− INC A− C− A C− B+ B− B B−
Jersey D− INC INC D+ C D C B− C D D+
Lithuania C− C INC C− C− C+ D C+ C C C−
The Netherlands C B B B− C− INC INC C INC INC C+
New Zealand D− B C+ C− D INC C B− B B+ C
Poland D− D INC C D C− C− B C C+ C−
Portugal D B− INC C− C− C C A B B C+
Qatar D D+ INC N/A D+ INC INC C INC B+ C−
Scotland F B INC C F INC INC INC B− C D+
Slovenia A− C+ D C B+ A− B+ A B A B
South Korea F C INC B+ D D+ INC D+ INC D D+
Spain D B C− B− B+ INC INC C+ INC INC C+
Sweden D+ B+ INC C C+ INC INC C+ A B C+
Taiwan F D− INC C− C− B− INC B+ B+ B+ C
United Arab Emirates F INC INC INC C− INC INC D− INC B+ D+
United States D− C INC D− D C− INC D− C INC D
Wales D+ C+ C− D+ F INC D INC INC C+ D+
Abbreviations: AP, Active Play; AT, Active Transportation; AVG, average; COM, Community and Environment; FAM, Family and Peers; GOV, Government; HDI, Human Development Index; INC, incomplete grade; N/A, not applicable; PA, Physical Activity; PF, Physical Fitness; SB, Sedentary Behaviors; SCH, School; SP, Organized Sport and Physical Activity Participation.
Discussion
The objective of this paper was to present, describe, and compare the Report Card grades from the 30 very high HDI countries and nations participating in the Global Matrix 3.0. A wide range of grades was observed for most indicators across countries. These 30 countries are geographically distributed across Asia, Europe, North America, Oceania, and South America and have very different climatic, geographic, demographic, and cultural charac-teristics. Despite these contextual differences, most of these coun-tries shared concerning low grades for Overall Physical Activity and Sedentary Behaviors. No country was consistently leading nor falling behind the others across the 10 common indicators, how-ever, some countries showed greater or less success than others.
The characteristics of the most and the least successful countries are discussed below, followed by a discussion of thefindings for each indicator, and an integrated discussion of thefindings including the strengths and limitations of this study.
Most Successful Countries
[image:7.612.43.576.92.288.2]Slovenia had sufficient data to inform the 10 indicators and obtained the best grades for Overall Physical Activity (“A−”), Family and Peers (“B+”), and Government (“A”), as well as on average (“B”); and shared the best grades for Sedentary Behaviors with Spain (“B+”), and for School (“A”) with Finland and Portugal. A notable feature of Slovenia is the importance of sport for the culture of this almost 30-year old country as“Slovenes tend to view Table 5 Descriptive Statistics of the Grades by Indicator and Group of Indicators for the Very High Human Development Index Countries of the Global Matrix 3.0
Grade count
Incomplete grades
Mean number
grade SD
Mean letter
grade Range
Overall Physical Activity 29 1 4.9 2.2 D− F to A−
Organized Sport and Physical Activity Participation 28 2 9 2.4 C+ D−to A−
Active Play 10 20 6.2 2.7 D+ F to B
Active Transportation 28 2 7.8 2.7 C− F to A−
Sedentary Behaviors 30 0 6.1 2.4 D+ F to B+
Physical Fitness 17 13 7.9 2.7 C− D to A
Family and Peers 17 13 7.5 2.6 C− F to B+
School 27 3 9.9 2.9 C+ D−to A
Community and Environment 22 8 10.7 1.7 B− C to A
Government 25 5 9.6 2.7 C+ D to A
Behavioral indicators 30 0 6.8 1.6 D+ D−to B−
Sources of influence indicators 30 0 9.3 2 C+ D to A−
All indicators 30 0 7.9 1.5 C− D+ to B
Note: Behavioral indicators = average of Overall Physical Activity, Organized Sport Participation, Active Play, Active Transportation, and Sedentary Behavior indicator grades; source of influence indicators = average of Family and Peers, School, Community and Environment, and Government Strategies and Investments indicator grades. Physicalfitness was not included in the behavioral indicators cluster. There are no missing grades for the bottom 3 rows because these scores are adjusted for missing grades.
Figure 1 — Frequency plot by letter grade among 30 very high Human Development Index countries in the Global Matrix 3.0. (A) For the 10 core indicators. (B) For the behavioral indicators and for the source of influence indicators. Note: Behavioral indicators = average of Overall Physical Activity, Organized Sport Participation, Active Play, Active Transportation, and Sedentary Behavior indicator grades; source of influence indicators = average of Family and Peers, School, Community and Environment, and Government Strategies and Investments indicator grades. Physicalfitness was not included in the behavioral indicators cluster.
JPAH 15 Supplement 2, 2018 S304 Aubert et al
[image:7.612.49.566.349.520.2]sports as an effective tool in fostering national identity among citizens and making successful global identity claims.”58 Every April since 1987, a national school-based surveillance system of physicalfitness (namedSlofit) takes place, targeting the majority of
[image:8.612.40.578.73.336.2]Slovenian school children and youth aged 6–19 years.59Negative trends in motor skills and physicalfitness were observed for over 2 decades in Slovenia, but since 2011, these trends have been reversed after the implementation of a health-oriented physical Figure 2 — Plot of the overall score estimated for the 10 core indicators for the 30 very high Human Development Index countries of the Global Matrix 3.0. Note: The overall score was adjusted for missing and incomplete grades. The number in parenthesis shows the number of grades available for the calculation of the score.
Figure 3 — Plot of the behavioral score estimated for the very high Human Development Index countries of the Global Matrix 3.0. Note: The overall score was adjusted for missing and incomplete grades. The number in parenthesis shows the number of grades available for the calculation of the score.
[image:8.612.41.575.395.665.2]activity intervention program, which offers children 2 (optional) additional hours of physical activity per week.60 The estimated proportion of Slovenian children and youth meeting the recom-mended levels of daily physical activity is now high (over 80%), and this encouraging outcome seems to be the result of the collective support for childhood physical activity from the govern-ment, the educational system, and the parents themselves.61
The next 2 most successful countries were Denmark and Japan with an average grade of “B−.” The positive result for these 2 countries should be interpreted with caution as both had “INC” grades for some indicators. Active Play, Physical Fitness, and Family and Peers for Denmark, and Overall Physical Activity and Active Play for Japan were not graded due to the lack of data. Nonetheless, Denmark was the country with the best grade for Organized Sport and Physical Activity (“A−”), and also obtained a grade of“A−”for both School and Government indicators. Sport is an important part of the Danish culture, and considered important not only for individual and population health, but also in relation to issues such as social inclusion and community cohesion.62Despite Denmark performing rather well on the strategic and political levels, low grades were attributed to Overall Physical Activity (“D−”) and Sedentary Behaviors (“D+”), indicating an implemen-tation gap between the governmental and individual levels.63
Japan had the best grades for Active Transportation (“A−”) and Physical Fitness (“A”), and had no grades lower than“C−.”In fact, Japan has a highly established“walking to school practice” that has been implemented since the School Education Act enforce-ment order, enacted in 1953, stating that public eleenforce-mentary schools should be sited within no more than 4 km, and for public junior high schools no more than 6 km from the student’s home. This policy is still successful today at promoting active transportation
among Japanese children and youth.64The Physical Fitness grade was assigned based on the performance of Japanese children and youth on the 20-m shuttle run test. On average, Japanese children were in the 90th percentile,65 based on age- and sex-specific international normative data.41The Organized Sport and Physical Activity Participation (graded “B−”) and the favorable School environment (graded“B+”) may explain this high level of physical fitness; however, this is speculative and more research is necessary. It was observed that only a minority of time in physical education classes was spent in MVPA (27.3%/45 min/class) in Japanese primary school students.66
Least Successful Countries
Chile and the United States were the 2 countries with the lowest average grade: “D.” They were followed by Guernsey, Jersey, Scotland, South Korea, the United Arab Emirates, and Wales, who obtained an average grade of“D+.”Chile had the lowest grades for Active Transportation (“F”), Family and Peers (“F”), and shared the lowest grades for Organized Sport and Physical Activity with Taiwan (“D−”), and for Physical Fitness with Canada, Hong Kong, and Jersey (“D”). In Chile’sfirst Report Card (2016), all indicators had low grades, and data from different surveys indicated that there were consistent disparities across genders, socioeconomic status, and school types.67 In 2018, Chile’s grades remained low in comparison with thefirst Report Card in 2016 but progress was made on environmental and policy aspects,68 raising hope that these improvements will positively affect behavioral indicators in the future.
[image:9.612.40.575.68.339.2]The low average grade of the United States should be inter-preted carefully because 3 indicators were assigned an “INC” Figure 4 — Plot of the source of influence indicators score for the very high Human Development Index countries of the Global Matrix 3.0. Note: The overall score was adjusted for missing and incomplete grades. The number in parenthesis shows the number of grades available for the calculation of the score. These estimates of sources of influence score are interpreted with a high degree of caution as they are likely imprecise estimates of sources of influence due to the level of missing data used to determine this score.
JPAH 15 Supplement 2, 2018 S306 Aubert et al
grade: Active Play, Family and Peers, and Government. The United States shared the lowest grades with the United Arab Emirates for School (“D−”), and the Community and Environment (“C”) with England, Jersey, Lithuania, and Poland. Overall, none of the indicators were graded above “C” in the United States. This is the third Report Card for the United States, and the grade for Overall Physical Activity (“D−”) remained consistent with the 2014 and 2016 Report Card.69,70 Similarly to Chile, major dis-parities in physical activity participation across gender, race/eth-nicity, age, and socioeconomic status were observed.71
Overall Physical Activity
Among the 30 very high HDI countries, only Japan assigned an “INC”grade for Overall Physical Activity. The grades ranged from “F”to “A−” for this indicator; however, Slovenia was the only country with a“good”grade (“A−”), and all the other countries’ grades fell between“F”and“C.”Five countries received an“F” (Flanders, Scotland, South Korea, Taiwan, and the United Arab Emirates), 4 countries assigned“C”grades (England, Hong Kong, Lithuania, and The Netherlands), and all the remaining countries had a“D−,” “D,”or“D+.”The comparison and interpretation of the Overall Physical Activity grades should be conducted carefully given the important variation in the methods used to measure Overall Physical Activity between the countries, as seen in Supplemental Material [available online]. In fact, objective data were used in 13 of 29 countries with an Overall Physical Activity letter grade, and subjective data in 27 countries (11 countries combined subjective and objective data to inform their Overall Physical Activity indicator). In addition, even among the subjective or the objective data, the methods differed largely in terms of instruments, analysis, age range, sample size, and representative-ness of samples.
The correlational analyses showed that there was no relation-ship between Overall Physical Activity and the physical activity-related indicators (Organized Sport and Physical Activity, Active Play, and Active Transportation). For example, only 56% of children and 33% of adolescents met the international physical activity recommendations in The Netherlands despite a high level of Organized Sport and Physical Activity, Active Play, and Active Transportation (graded “B,” “B,” and “B−,” respectively).72 A similar pattern was observed in Belgium (Flanders), Denmark, Scotland, South Korea, and Spain where Overall Physical Activity was graded“F”or“D/D−”despite the fact that grades between“A” and“C”were assigned to Organized Sport and Physical Activity, Active Play, and Active Transportation (note: an“INC”grade was assigned to Active Play for Flanders, Denmark, Scotland, and South Korea).63,73–76 The opposite situation was observed in
Slovenia where Overall Physical Activity was graded“A−,”while Organized Sport and Physical Activity, Active Play, and Active Transportation were graded“C+,” “D,”and“C,”respectively.
The absence of a relationship between Overall Physical Activ-ity and other behavioral indicators can potentially be explained by the aforementioned differences in methods used to measure these indicators and the diversity of benchmarks between countries. The recommended benchmark for physical activity was“% of children and youth [ . . . ] who accumulate at least 60 minutes MVPA per day on average, or % of children and youth meeting the guidelines on at least 4 days a week (when an average cannot be estimated)” (Table1). The available data in each country did not necessarily allow them to use either of these benchmarks strictly when estimating the prevalence of physically active children and youth
in their sample. For example, in France, a“high level of physical activity”corresponded to engage in physical activity 5 or more days a week, and the regular use of active transportation, for 6- to 10-year olds (reported by the parents); and practicing a MVPA at least 5 days a week for 11- to 17-year olds (self-reported).77While in England’s 2018 Report Card, the percentage of children and youth accumulating at least 1 hour of MVPA 7 days a week was evaluated.78 In addition, among the countries where objective methods were used to measure physical activity, the estimated number of children meeting the physical activity guidelines could also have been significantly affected by the cutoff point that defines the count per minute threshold for MVPA.79Although the majority of studies included in the Global Matrix 3.0 used the Evenson cutoff point,57several studies used different ones. For example, the Freedson cutoff point80was used in Hong Kong, while the Puyau cutoff point81was used in Canada (Supplemental Material [avail-able online]).
Notwithstanding the presented methodological issues across countries, 29 out of 30 very high HDI countries assigned a letter grade to the Overall Physical Activity indicator, and for 28 of them, this grade was between“C”and “F,”with an average of “D−.” These results are consistent with the current literature. A systematic review of physical activity in European children and adolescents found that 5% to 47% of children and adolescents when measured subjectively, or 0% to 60% of children and adolescents when measured objectively, achieved the recommended levels of physi-cal activity.82 In another study describing objectively measured physical activity and sedentary time patterns in children and youth in 10 countries (9 very high HDI countries and Brazil), only 9% of boys and 2% of girls accumulated≥60 minutes of MVPA on all measured days.35The present study provides additional evidence that the situation regarding the physical activity of children and youth is very concerning in very high HDI countries, and public investment to implement effective interventions for increasing physical activity opportunities is needed urgently. Unless a major shift to a more active lifestyle happens soon, a high rate of premature noncommunicable diseases can be anticipated when this generation of children will reach adulthood.
Organized Sport and Physical Activity
Most of the countries assigned a letter grade to Organized Sport and Physical Activity, excepting Jersey and the United Arab Emirates. With an average grade of “C+,” Organized Sport and Physical Activity was the most successful behavioral indicator in the very high HDI countries. Only 3 countries had a low grade for this indicator: Chile (“D−”), Taiwan (“D−”), and France (“C−”); while 12 countries had relatively higher grades (“B+,” “B,”and“B−”) behind the lead of Denmark (“A−”). In Canada, Organized Sport and Physical Activity was the only behavioral indicator with a high grade (“B+”),83in which the high participation rate (77%) has been relatively stable since 2005.84 Similarly, Organized Sport and Physical Activity was also the highest graded indicator in Swe-den.85In relation to its geographical and population size, Sweden is considered as one of the world’s most sporting nations: out of the 7 million inhabitants between the ages of 7 and 70, more than 3 million were active members of sport clubs and more than 2 million were competing regularly in 2012.86However, as presented before, these high rates of sport participation were not associated with a sufficient level of physical activity in the population.
Given that the benchmark for Organized Sport and Physical Activity (“% of children and youth who participate in organized
sport and/or physical activity programs”) does not specify inten-sity, duration, or frequency, we are missing important contextual information of this indicator. These characteristics should be evaluated to estimate the dose of physical activity associated with sport participation among children and youth. However, the popularity of sport among children and youth from very high HDI countries suggests that increasing organized sport op-portunities and accessibility could be a strategic solution to address the prevalence of childhood physical inactivity in these countries. Further research focusing on this indicator is needed to evaluate if the available organized physical activity opportunities are indeed saturated. Moreover, are all countries providing free or affordable and appealing physical activity and sport participation opportu-nities for the entire youth population including different age, gender, socioeconomic, ethnic, and special population groups (eg, children with learning and/or physical disabilities)?
Active Play
The main finding concerning Active Play was the amount of missing data: 20 out of the 30 very high HDI countries assigned an“INC”grade to this indicator. Among the 10 countries with a letter grade, The Netherlands attained the highest grade (“B”); Estonia the lowest grade (“F”); and the 8 remaining countries had “C”s or“D”s. The average grade of“D+”for this indicator suggests that there is a low level of engagement in this behavior, and/or that researchers were not able to detect it with the measurement instruments they used. Indeed, valid and reliable tools to assess active play are largely limited.87 In the Czech Republic, Active Play was measured using self-reports of unstructured/unorganized active play for at least 2 hours per day88; while in New Zealand, surveys asked parents/guardians or youth report to indicate if the children or youth had been active while playing (on their own or with others) in the last 7 days, if they had been active while playing for at least 7 hours in the last 7 days, and if they were allowed to go out on their own in the neighborhood.89 The development of standardized tools for the measurement of Active Play is chal-lenged by the need for consensus on a definition. In a recent systematic review synthesizing the literature to identify key con-cepts used to define and describe active play among young children, Truelove et al87 proposed the following definition: “a form of gross motor or total body movement in which young children exert energy in a freely chosen, fun, and unstructured manner.”But a consensus definition needs to be officially interna-tionally agreed upon and acknowledged to advance the develop-ment and acceptance of standardized measuredevelop-ment tools.
Active Transportation
For Active Transportation, the grades ranged from“A−”(Japan) to “F”(Chile), with an average of“C−.”Qatar and the United Arab Emirates were the only 2 countries that did not assign a letter grade to this indicator. Interestingly, 3 of the 4 countries from Eastern Asia are leading this indicator: Japan (“A−”), Hong Kong (“B+”), and South Korea (“B+”). The successful school policy that has been identified underlying this high prevalence of active transpor-tation among children and youth in Japan was discussed previously in this paper. In Hong Kong, a high proportion of children using active transportation can be explained by the very high population density of the city: most districts are highly self-contained so children usually attend schools close to their home.90 Similarly, because most students live within 10-minute walking distance to/
from school, national data showed that active commuting is prevalent in South Korea: 79.4% of children and youth reported that they take active modes of transport to/from places.75Previous research has shown that active transportation is associated with increased physical activity91; however, the Active Transportation indicator was not correlated with Overall Physical Activity among children in very high HDI countries in this study. Similar to Organized Sport and Physical Activity and Active Play, the benchmark for this indicator does not indicate duration or intensity of activity. Therefore, it is not possible to evaluate the extent to which this indicator is contributing to the Overall Physical Activity of children and youth.
Sedentary Behaviors
Sedentary behavior corresponds to any waking behavior charac-terized by an energy expenditure≤1.5 metabolic equivalents, while in a sitting, reclining, or lying posture.92For example, in children and youth, it includes to the use of electronic devices while sitting, reclining, or lying, as well as reading, writing, or drawing while sitting.92While reading is associated with positive outcomes such as higher academic achievement, screen time, often used as a proxy for sedentary behavior in research, has been shown to be associated with a variety of negative health outcomes among children and youth.93For this reason, guidelines focusing specifically on screen time were developed for thefirst time in Canada in 2011, recom-mending limiting screen time to 2 hours daily for the 5- to 17-year olds.94Consistent with the current guidelines, the benchmark for Sedentary Behaviors was solely based on screen time: “% of children and youth who meet theCanadian Sedentary Behaviour Guidelines(5- to 17-year-olds: no more than 2 hours of recreational screen time per day).”
Sedentary Behaviors was the only indicator without any “INC”grades. Estonia, Scotland, and Wales were the 3 countries with the lowest grade for this indicator (“F”), while Slovenia and Spain had the highest grade (“B+”). The remaining countries all had“C”s or“D”s, and the average for this indicator was“D+.”In total, only 5 out of the 30 very high HDI countries had a grade of “C”or higher. A small methodological difference was observed between the very high HDI as few countries such as Estonia, France, and Sweden reported the percentage of children and youth who had less than 2 hours (<2 h/d) of daily screen time, while most of the countries reported those spending 2 hours or less (≤2 h/d) in front of a screen. Another potential source of bias was not taking into account the potential multitasking use of screens (eg, using a phone while watching a movie) as it was the case for France, which could have led to an overestimation of screen time.77Despite these potential methodological issues, the grades observed for this indicator are extremely concerning among the very high HDI countries. In Estonia, the prevalence of children meeting the screen time recommendation was estimated as low as 7%.95The devel-opment of more effective interventions targeting the reduction of screen time among children and youth in very high HDI countries should be a public health priority.
Physical Fitness
This is thefirst time that Physical Fitness has been evaluated in the Global Matrix. Physicalfitness corresponds to a state characterized by an ability to perform daily activities with vigor, and a demon-stration of traits and capacities that are associated with a lower risk of the premature development of diseases associated with physical
JPAH 15 Supplement 2, 2018 S308 Aubert et al
inactivity.96The health-related components of physicalfitness are cardiorespiratory endurance, muscular endurance, muscular strength, body composition, andflexibility.97A recent systematic review of the relationship between the 20-m shuttle run perfor-mance and health indicators among children and youth found that performance on this test was associated with favorable indicators of adiposity, and some indicators of cardiometabolic, cognitive, and psychosocial health in boys and girls, and concluded that physical fitness can be used as a holistic indicator of population health in children and youth.98
The benchmark for this indicator was the average percentile achieved on certain health-related physical fitness component based on the normative values published by Tomkinson et al.41 On average, Physical Fitness was graded“C−.”The highest grade was obtained by Japan (“A”), closely followed by Slovenia (“A−”); and 4 other countries (Canada, Chile, Hong Kong, and Jersey) shared the lowest grade (“D”). An “INC”grade was assigned to Physical Fitness in 13 countries. Various health-related physical fitness components and different normative values were used to calculate the percentile achieved by their sample of children and youth and inform this indicator from one country to another. For example, in Hong Kong this indicator was graded based on peak oxygen consumption, estimated with the performance on the 20-m shuttle run performance among 9- to 17-year olds99; Jersey had data on cardiorespiratory fitness, muscular strength, muscular endur-ance,flexibility, and motor fundamental movement skills develop-ment for school-aged children.100Lithuania had data on endurance, lower-body muscular power, upper-body muscular endurance, and lower-body muscular endurance for 11- to 18-year olds. Given these significant variations, the comparison of the Physical Fitness indicator between very high HDI countries is compromised and this highlights the need for developing international standardized mea-surements of health-related physicalfitness components.
Family and Peers
Similarly to Physical Fitness, 13 countries assigned an“INC”grade to the Family and Peers indicator. On average, this indicator was graded“C−,”with Slovenia having the highest grade (“B+”) and Chile having the lowest grade (“F”). Parental support and significant others support has been identified as 2 of the 16 correlates that are consistently associated with physical activity of children and/or adolescents in a systematic review of reviews.101Because of the complexity of this indicator, several benchmarks were proposed for its evaluation (Table1), and measurement variations were observed. In Poland, the grade was based on self-report of their parents’ (material, emotional) support to their physical activity participation, on self-report of their parents’ regular participation in physical activity, and on the prevalence of youth who declared being regularly physically active with their father, their mother, and their siblings.102In Germany, the prevalence of parents regularly partici-pating in physical activity and the prevalence of children feeling that they receive positive support from their parents and friends to be physically active informed the Family and Peers indicator.103These findings show that there is still a need for an established definition of Family and Peer Influence, and then standardized and validated methods of measurement for the Family and Peers indicator.
School
The School indicator had an average of“C+,”and only 3 countries had an “INC”grade for this indicator: Guernsey, Scotland, and
Wales. The United Arab Emirates and the United States had the lowest grade (“D”), and Finland and Portugal shared the best grade for School (“A”). A variation in data was used to inform this indicator within the countries. In Finland, 87% of the schools participated in the nationalFinnish Schools on the Moveprogram. This program aims at achieving more pleasant and active school-days for children and encourages schools to increase physical activity during the schoolday as well as commuting.104In Portugal, physical education classes are mandatory for all students from preschool to 12th grade. The time allocated to physical education classes ranges from 90 to 150 minutes per week over 2 or 3 sessions/wk, and these classes are taught by a certified physical education teacher. In addition, 85% of Portuguese schools offer school clubs under the supervision of a physical education teacher, including competitions within and between schools.105The corre-lational analyses did notfind an association between the School and the Overall Physical Activity indicators, but similarly to other indicators, the heterogeneity of data used to inform the School indicator is potentially affecting this relationship.
A review of the relationship between academic performance and participation in school-based physical activities, including physical education, free school-based physical activity, and school sports, found that adding time to academic or curricular subjects by taking time from physical education programs does not enhance grades in the corresponding academic subjects, and could be detrimental to health.106On the contrary, the authors also suggested that more time can be allocated to physical activity from other subjects without the risk of hindering students’academic achieve-ment.106 These findings suggest that the school environment, policy, and curriculum have the potential to increase physical activity among children and youth, and more specific interventions targeting the creation of daily physical opportunities at school need to be developed in very high HDI countries.
Community and Environment
With an average of“B−,”Community and Environment was the highest graded indicator of the 10 core indicators among the 30 very high HDI countries. The lowest grade for this indicator was “C,” shared by 5 countries (England, Jersey, Lithuania, Poland, and the United States), and the highest grade,“A,”was assigned by Sweden. Eight countries assigned an“INC”grade for this indicator. With an “A−,” Australia was the second most successful country for this indicator. In the Australia’s 2018 Report Card, parent-report data showed that most of youth were not faced with problematic traffic in their home or school neighborhood, had access to good roads and footpaths and to public transport in their neighborhood, had a park or playground near their home, and lived in a safe neighborhood.107 In Taiwan, where this indicator was graded “B+,” 81% of 13- to 17-year olds felt that there were sufficient exercise facilities in their neighborhood, and they re-ported spending an average of 9.7 minutes to reach their primary exercise facilities.108 The lack of significant correlation between this indicator and the Overall Physical Activity does not align with some of the research available on access to facilities.101 For Community and Environment, in accordance with previous Global Matrices,36,38 the available evidence from this indicator may suggest that the characteristics of the built environment potentially influencing the physical activity of children are already meeting the criteria to be considered favorable in the very high HDI countries. This indicates that having favorable environmental infrastructure alone is not sufficient to promote physical activity in very high HDI
countries. Social factors such as family, home, school, and com-munity are also important to promote physical activity among children and youth.
Government
The average grade for the Government indicator was“C+,”and the grades ranged from “A”(Slovenia) to“D”(Australia, Guernsey, Jersey, and South Korea). Five countries assigned an“INC”grade to this indicator. With the exception of the 4 countries with a“D,” all the other very high HDI countries obtained a favorable grade (“C”or higher) for the Government indicator. Despite the recom-mended benchmark for this indicator, Government grades were informed by different types of data in different countries. For example, in Wales, 21 policy documents assessed across different sectors including Health, Sport, Education, Environment, Trans-port, and Urban Design/Planning were evaluated using the Health-Enhancing Physical Activity Policy Audit Tool, obtaining a final score of 54% that was converted to a letter grade of “C+.”109 In some other countries that did not have relevant quantitative data, a letter grade was graded primarily based on expert opinion. Although most countries reported government physical activity strategies and policies, the absence of a relationship between the Government grades and the Overall Physical Activity grades and the mostly low behavioral grades suggest that these actions are not singularly effective at increasing the prevalence of MVPA among children and youth.
Integrated Discussion
Generally, higher grades were reported for the source of influence indicators in comparison with the behavioral indicators among the 30 very high HDI countries integrated in this study. The average grade for the behavioral indicators was“D+”(ranging from“B−”to “D−”), while the average grade for the sources of influence indicators was “C+”(ranging from“A” to“D”). Thisfinding is consistent with previous Global Matrices,36,38and may be partially explained by the fact that more than half of the countries that participated in the Global Matrix 1.0 and 2.0 belonged to the very high HDI category.
Japan, The Netherlands, and Slovenia had the highest behav-ioral score, while Estonia, Chile and the United Arab Emirates had the lowest score (Figure3). This score was calculated based on the grades for 5 indicators, and most of the countries had 4 to 5 letter grades to inform the score, with the exception of the United Arab Emirates with only 2 letter grades, and Qatar, Jersey, and Japan with only 3 letter grades. The amount of“INC”grades for these 4 countries questions the accuracy of their ranking, in particular for Japan, in the leading position. For the sources of influence score, Slovenia, Denmark, and Finland led the ranking, while the United States, South Korea, and Guernsey ranked at the bottom (Figure4). While the calculation of the source of influence score was based on the letter grades for 4 indicators, 8 countries had only 2 letter grades to inform this score, and Guernsey, The Netherlands, and Spain had only one. The amount of“INC”grades challenges the correctness of this classification, in particular for the 3 countries with only one source of influence indicator graded. The comparison of these groups of indicators suggests that the adequate to good grades observed for the source of influence indicators are not translated in good behavioral grades for the very high HDI countries.
In total, 24 countries had 3 or less “INC” grades, but 6 countries were missing data to grade 4 to 6 indicators. Including
countries with a significantly large number of“INC”grades in the Global Matrix 3.0 is a limitation to this study as it limits the comparisons. For example, the United Arab Emirates had 6“INC” grades,110Guernsey had 5“INC”grades,111and Qatar had 4“INC” grades, and a“not applicable”for Active Transportation.56Another major limitation of this study is the diversity of the data that was used to inform the 10 core indicators, challenging the compara-tiveness of the grades within the same indicator. Two identical grades for the same indicator can potentially reflect very different situations from one country to another. An alternative approach would have been to exclude the countries with insufficient data from the Global Matrix 3.0, and to have assigned“INC”grades to all the countries with data that were not fitting exactly with the benchmarks for each indicator. Yet, this strategy would have considerably reduced the number of countries and indicators included in the analyses of this study and decrease the relevance of conducting international comparisons within an HDI category. Finally, a loss of information potentially occurs when translating original data to a letter grade, as letter grades provide less infor-mation than continuous variables.
The main strength of this study is the large number of participating countries who adopted the harmonized data gathering, assessing, and grading process, and the quantity of data that are informing the international physical activity comparisons. This was possible as a result of the inclusive strategy adopted by AHKGA. This project offers the opportunity to paint a picture of the characteristics of childhood physical activity in each country, as determined and explained by a diverse group of experts within each country. In addition, despite the presented methodological issues, this study allows the identification of major trends concerning the characteristics of the physical activity of children and youth among very high HDI countries. The need for the development and the international adoption of standardized methods to conceptualize and measure the 10 indicators was also highlighted in this paper. An“INC”grade can be useful for advocacy in individual countries in future cards, and the Global Matrix project has the potential to influence the physical activity national surveillance systems in the short to long term. Finally, the development of a national Report Card of physical activity for children and youth, and the participa-tion in the Global Matrix initiative, contributes to raising awareness on the childhood physical inactivity issue nationally and interna-tionally, building capacity within participating countries, and potentially influencing the creation of physical activity opportu-nities in the future.
Conclusion
This analysis and comparison of the Global Matrix 3.0 grades provide a comprehensive summary of the level and context of the physical activity of children and youth among the participating very high HDI countries. While methodological limitations and research gaps were identified, this work allowed the portrayal of major trends across the 10 physical activity indicators. The major-ity of very high HDI countries had better grades on the sources of influence levels, but this was not translated in positive outcomes concerning childhood physical activity and sedentary behavior, indicating an implementation gap between the policy/governmen-tal and individual level. This paper provides additional evidence that the situation regarding physical activity in children and youth living in very high HDI countries is extremely concerning. Strate-gic public investments to implement effective interventions within families, communities, and schools to increase physical activity
JPAH 15 Supplement 2, 2018 S310 Aubert et al