Allocation rules for global donors
Alec Morton
∗, Ashwin Arulselvan
†Ranjeeta Thomas
‡February 1, 2018
Abstract
In recent years, donors such as the Bill and Melinda Gates Foundation, have made an enormous contribution to the reduction of the global burden of disease. It has been argued that such donors should prioritise interven-tions based on their cost-effectiveness, that is to say, the ratio of costs to benefits. Against this, we argue that the donor should fundnot the most effective interventions, but rather interventions which are just cost-ineffective for the country, thus encouraging the country to contribute its own domestic resources to the fight against disease. We demonstrate that our proposed algorithm can be justified within the context of a model of the problem as a leader-follower game, in which a donor chooses to subsidise interventions which are implemented by a country. We argue that the decision rule we propose provides a basis for the allocation of aid money which is efficient, fair and sustainable.
1
Introduction
The last fifteen years have seen huge strides forward in humanity’s ability to protect itself against disease. According to the United Nations (2015), improved prevention and treatment has saved around 37 million lives over this period and 6.2 million lives from malaria (most of the latter being those of children). 13.6 million people living with HIV are now on antiretroviral therapy: many of these people would be dead without treatment.
Although some of this progress is due to economic growth and technological progress, a considerable share is due to aid money from rich countries and phil-anthropic individuals. In particular, the Global Fund to Fight Aids Tuberculosis and Malaria has disbursed $27 billion to low and middle income countries to assist them in funding treatments for these three diseases since its founding in 2002 (The Global Fund, n.d.).
∗Strathclyde Business School, University of Strathclyde. Corresponding author - email: [email protected]; postal address: Room 720, Sir William Duncan Wing, University of Strathclyde Business School, 199 Cathedral Street, GLASGOW, Scotland, G4 0QU, United Kingdom
†Strathclyde Business School, University of Strathclyde.
Of course, funding is not unlimited. Many rich countries are preoccupied with their own problems: slow growth, ageing populations, the hangover of the financial crisis, the threat of terrorism and the like. In this environment, overseas development aid can be a tough sell to a sceptical public. Private individuals are not constrained in the same way, but even the largest private fortunes are finite. This is reflected in the trends in development assistance for health (DAH). Between the 2000 and 2009 DAH rose at an annualised growth rate of 11.3% with an average annual increase of $290.4 mn (2015 US$) in the millennium development goals (MDG) focus areas and $98.6 mn (2015 US$) in the non-MDG focus areas. Between 2010 and 2015 however, the annualised growth rate fell to 1.2%, with DAH for HIV/AIDS and other focus areas (with the exception of maternal and newborn/child health) remaining flat or decreasing (Dielman et al 2016).
How, then, should aid money be spent? Several commentators have ad-vocated the use of cost-effectiveness analysis (Center for Global Development, 2013; Teerawattananon et al, 2013). In its simplest form, cost-effectiveness anal-ysis involves prioritising investments in decreasing order of benefit to cost ratio, that is to say “value for money”. In health economics in particular, the benefits are normally operationalised as some sort of health benefit: for example infec-tions averted or life years or quality adjusted life years (QALYs) gained (for more comprehensive expositions, see Tan-Torres Edejer et al, 2003, Drummond et al, 2015; Neumann et al, 2016 and Wilkinson et al., 2016). While assess-ing these cost-effectiveness ratios for a given set of healthcare interventions can involve substantial clinical and epidemiological expertise, the underlying cost-effectiveness principle is familiar and intuitive.
In this note we take issue with the argument that donors should fund the most cost-effective interventions, with cost-effectiveness defined as total cost of implementation per unit of benefit, at least when the partner countries are middle-income or at the upper end of the lower-income scale. We maintain that a disadvantage of such rules is that they result in the crowding out of indigenous financing of interventions, and thus result in under-allocation of resources to healthcare. We propose an alternative rule for such countries whereby donors subsidise interventions which are “at the margin” from the point of view of the recipient country, that is to say in interventions which are only just cost-ineffective for that country.
generalise the rules of cost-effectiveness analysis by showing how these rules can be derived within a formal optimisation model (e.g. Weinstein and Zeckhauser, 1973; Morton, 2014, van Baal et al., 2016; Morton et al, 2016; van Baal et al, 2018). The optimisation framework we use here is bilevel programming, which has to our knowledge not hitherto been used in this context: specifically the model which we use can be considered as a bilevel knapsack model. There are quite a few bilevel knapsack models that are present in the operations research literature (Caprara et al., 2013). Most of them cannot be applied to model our application as these models involve the leader and the follower competing for a common resource or the follower is pessimistic with a conflicting objective. Dempe and Richter’s (2000) model is perhaps the closest to the one that we are proposing. However, their model involves in the leader just determining the capacity of the follower’s knapsack and it does not offer the flexibility in terms of individual project subsidies.
The overall structure of the paper is as follows. In Section 2 we present the intuition behind our rule and demonstrate it with respect to a realistic numerical example. In Section 3, to make our argument precise, we provide a formal model of the problem of donor aid allocation as a leader-follower (Stackelberg) game and show that our Section 2 algorithm can be understood as a heuristic version of the optimal solution to this game. In Section 4, we discuss the prospects for using the model we propose to guide resource allocation to countries. Section 5 concludes.
2
Concept and example
A popular approach to prioritisation in healthcare is to evaluate possible health-care interventions (henceforth “projects”) on the basis of their incremental cost-effectiveness ratio (ICER). This ICER is the ratio of the incremental costs to the incremental benefits relative to the current standard of care, with the lat-ter measured in a metric such as QALYs. A common prescription is to invest only in those projects which meet some cost-effectiveness threshold. This idea has the merit of being both grounded in economic theory and also practically implementable: it informs decision making in many countries.
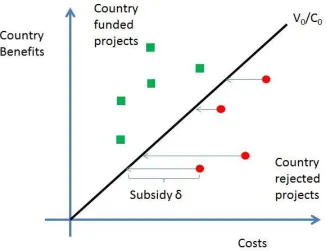
Suppose a donor (henceforth “D”) wishes to interact with a country (“C”) which makes decisions on this basis. How should D make decisions? What we propose in this paper is that D rather than selecting cost-effective projects on C’s behalf, D should frame its role as deciding which projects to subsidise in order to make them cost-effective for C.
Figure 1: Intuition behind the Donor’s allocation rule
This suggests an approach to prioritisation whereby D calculates its own Subsidy Effectiveness Ratio (SER) for projects by using the required subsidy, rather than the full cost of the project, as the numerator in the SER.
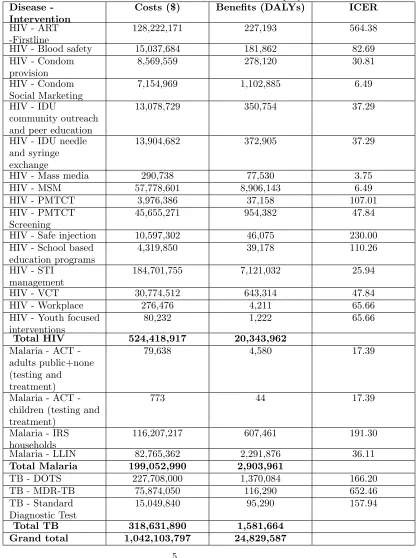
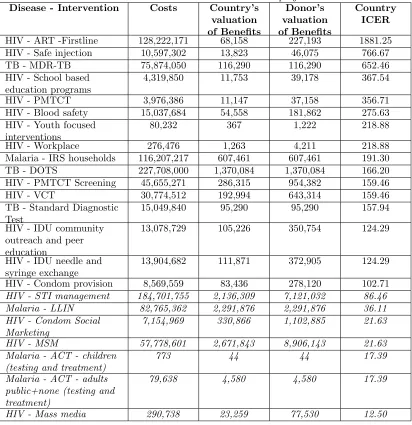
We demonstrate the approach numerically with the following example, based on earlier consultancy work. Consider a middle-income country which faces a range of projects in the areas of TB, malaria and HIV treatment and preven-tion, with costs and benefits (the latter measured in DALYs) and ICER as shown in Table 1. These projects may be considered to be targeted at separate populations and so are independent.
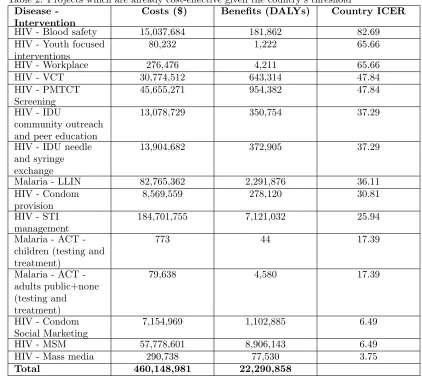
The first step is to order the projects in order of ICERs and identify those which have an ICER less than C’s threshold, which we consider for the purposes of this example to be $100 per DALY averted. These projects are shown in Table 2.
Table 1: Cost and benefit data for HIV, Malaria and TB projects Disease
-Intervention
Costs ($) Benefits (DALYs) ICER
HIV - ART -Firstline
128,222,171 227,193 564.38
HIV - Blood safety 15,037,684 181,862 82.69
HIV - Condom provision
8,569,559 278,120 30.81
HIV - Condom Social Marketing
7,154,969 1,102,885 6.49
HIV - IDU
community outreach and peer education
13,078,729 350,754 37.29
HIV - IDU needle and syringe exchange
13,904,682 372,905 37.29
HIV - Mass media 290,738 77,530 3.75
HIV - MSM 57,778,601 8,906,143 6.49
HIV - PMTCT 3,976,386 37,158 107.01
HIV - PMTCT Screening
45,655,271 954,382 47.84
HIV - Safe injection 10,597,302 46,075 230.00
HIV - School based education programs
4,319,850 39,178 110.26
HIV - STI management
184,701,755 7,121,032 25.94
HIV - VCT 30,774,512 643,314 47.84
HIV - Workplace 276,476 4,211 65.66
HIV - Youth focused interventions
80,232 1,222 65.66
Total HIV 524,418,917 20,343,962
Malaria ACT -adults public+none (testing and treatment)
79,638 4,580 17.39
Malaria ACT -children (testing and treatment)
773 44 17.39
Malaria - IRS households
116,207,217 607,461 191.30
Malaria - LLIN 82,765,362 2,291,876 36.11
Total Malaria 199,052,990 2,903,961
TB - DOTS 227,708,000 1,370,084 166.20
TB - MDR-TB 75,874,050 116,290 652.46
TB - Standard Diagnostic Test
15,049,840 95,290 157.94
Total TB 318,631,890 1,581,664
Table 2: Projects which are already cost-effective given the country’s threshold Disease
-Intervention
Costs ($) Benefits (DALYs) Country ICER
HIV - Blood safety 15,037,684 181,862 82.69
HIV - Youth focused interventions
80,232 1,222 65.66
HIV - Workplace 276,476 4,211 65.66
HIV - VCT 30,774,512 643,314 47.84
HIV - PMTCT Screening
45,655,271 954,382 47.84
HIV - IDU
community outreach and peer education
13,078,729 350,754 37.29
HIV - IDU needle and syringe exchange
13,904,682 372,905 37.29
Malaria - LLIN 82,765,362 2,291,876 36.11
HIV - Condom provision
8,569,559 278,120 30.81
HIV - STI management
184,701,755 7,121,032 25.94
Malaria ACT -children (testing and treatment)
773 44 17.39
Malaria ACT -adults public+none (testing and treatment)
79,638 4,580 17.39
HIV - Condom Social Marketing
7,154,969 1,102,885 6.49
HIV - MSM 57,778,601 8,906,143 6.49
HIV - Mass media 290,738 77,530 3.75
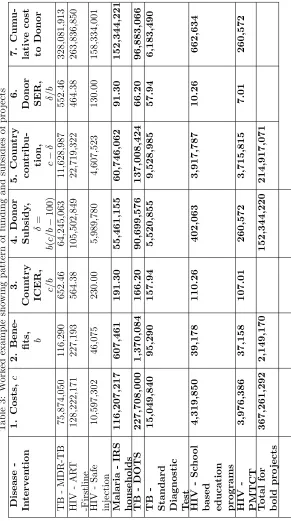
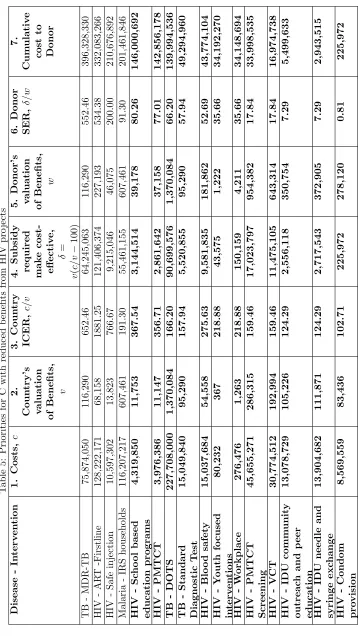
T able 3: W ork ed example sho wing pattern of funding and su bsidies of pro jects Disease -In terv en tion 1. Costs, c 2.
Bene- fits, b
3. Coun try ICER, c/b 4. Donor Subsidy , δ = b ( c/b − 100) 5. Coun try con
tribu-tion, c−
δ
6.
Donor SER, δ
/b 7. Cum u-lativ e cost to Donor TB -MDR-TB 75,874,050 116,290 652.46 64,245,063 11,628,987 552.46 328,081,913 HIV -AR T -Firstline 128,222,171 227,193 564.38 105,502,849 22,719,322 464.38 263,836,850 HIV -Safe injection 10,597,302 46,075 230.00 5,989,780 4,607,523 130.00 158,334,001 Malaria -IRS households 116,207,217 607,461 191.30 55,461,155 60,746,062 91.30 152,344,221 TB -DOTS 227,708,000 1,370,084 166.20 90,699,576 137,008,424 66.20 96,883,066 TB
-Standard Diagnostic Test
15,049,840 95,290 157.94 5,520,855 9,528,985 57.94 6,183,490 HIV -Sc ho ol
based education programs
[image:8.612.166.457.139.660.2]In this example C spends approximately $460m on interventions which are already cost-effective for it, before D’s financing begins to kick in. Had D spent money on these cost-effective interventions, it may well have crowded out financing from C. Instead, D’s additional financing leverages substantial amounts of additional funding ($215m) into the healthcare system over and above what the country would have spent if left to its own devices. Thus, D’s financing should be seen in the context of, and indeed as a stimulus to, sustainable financing of the whole system.
Now consider the case where C and D do not agree on the assessment of the benefits of the projects. There are many reasons why this might be so: for example, D may wish to give priority involving children, but C may wish to prioritise working age adults: or D may calculate gains in terms of DALYs and C in terms of productivity losses). We consider a the case where C has a preference for treating some diseases over others (perhaps because it deprioritises diseases which affect politically marginal and social stigmatised populations). Specifically we consider that while D’s assessment of the benefits remains as per Table 1, C takes the view that the HIV interventions only realise thirty percent of the benefits of Table 1 across the board. The country’s new priority ordering and funded projects are as shown in Table 4.
Because of C’s reassessment of the benefits,HIV–condom provision(for ex-ample) is no longer cost-effective for it. D calculates how much it will have to pay in order to induce C to introduce the other projects and calculates its own cost-effectiveness ratio for the projects which remain unfunded, as shown in Ta-ble 5. The calculations are similar to the those of TaTa-ble 3, differing only in that now instead of there being a single agreed benefitb, there is C’s valuation of the benefitsv, and D’s valuation of the benefitw– for the formulae see the column headings of the table. (Observe that the orderings by country ICER and donor SER respectively, are no longer the same). Again D has $153m to invest, and the top cost-effective projects on which to spend this money are again shown in bold. This time, from its point of view, the most cost-effective projects to subsidise are the HIV projects which C has left on the table. Because it uses its budget subsidising such projects, it no longer has enough money to fund the
Table 4: Priorities for C with reduced benefits from HIV projects Disease - Intervention Costs Country’s
valuation of Benefits
Donor’s valuation of Benefits
Country ICER
HIV - ART -Firstline 128,222,171 68,158 227,193 1881.25
HIV - Safe injection 10,597,302 13,823 46,075 766.67
TB - MDR-TB 75,874,050 116,290 116,290 652.46
HIV - School based education programs
4,319,850 11,753 39,178 367.54
HIV - PMTCT 3,976,386 11,147 37,158 356.71
HIV - Blood safety 15,037,684 54,558 181,862 275.63
HIV - Youth focused interventions
80,232 367 1,222 218.88
HIV - Workplace 276,476 1,263 4,211 218.88
Malaria - IRS households 116,207,217 607,461 607,461 191.30
TB - DOTS 227,708,000 1,370,084 1,370,084 166.20
HIV - PMTCT Screening 45,655,271 286,315 954,382 159.46
HIV - VCT 30,774,512 192,994 643,314 159.46
TB - Standard Diagnostic Test
15,049,840 95,290 95,290 157.94
HIV - IDU community outreach and peer education
13,078,729 105,226 350,754 124.29
HIV - IDU needle and syringe exchange
13,904,682 111,871 372,905 124.29
HIV - Condom provision 8,569,559 83,436 278,120 102.71
HIV - STI management 184,701,755 2,136,309 7,121,032 86.46 Malaria - LLIN 82,765,362 2,291,876 2,291,876 36.11 HIV - Condom Social
Marketing
7,154,969 330,866 1,102,885 21.63
HIV - MSM 57,778,601 2,671,843 8,906,143 21.63 Malaria - ACT - children
(testing and treatment)
773 44 44 17.39
Malaria - ACT - adults public+none (testing and treatment)
79,638 4,580 4,580 17.39
D might take the view that if C assesses projects very differently from D, D may require that C apply a higher cost-effectiveness threshold for its own projects as a condition of funding. For example, if C chooses to put a lower value on projects aimed at sex workers or sexual minorities in its own internal valuation, it does not seem right that D should pick up such projects without demanding that C provide some additional funding for some other projects (otherwise C would financially benefit from its reluctance to provide to health services to all of its citizens on an equitable basis).
We run some scenarios on our base model which we present in Figure 2 to show how the relative sums of money allocated by C and D respectively change as we redo the calculations varying C’s threshold. As can be seen from the figure, as C’s threshold is stepped up, the amount of financing that the C contributes in the model increases – this is partly because increasing the threshold tips some projects over from being subsidised to being entirely funded by C but also because the amount of subsidy that C receives for any subsidised project diminishes, as it requires less financial support to make it cost-effective. D’s contribution fluctuates because D has a budget constraint which it cannot exceed, but sometimes it chooses not to use its full budget (for example if it only has half the amount necessary to make a project cost-effective, it does not make sense to subsidise the project by that amount as this will not be sufficient to change C’s decision).
What lessons might D draw from this graph? Observe that before discount-ing the benefits of its HIV projects, C would spend $675m of its own money on healthcare, comprising $460m from the unsubsidised projects (see Table 2) and $215m for its share of the subsidised projects (see Table 3). After discounting its HIV projects, it is possible to work out from the data of Tables 4 and 5 that C would reduce its spending down to $565m. If D wishes to raise country funding back to $675m, they can identify the thresholdλ∗ which corresponds to C spending $675m into the system even with the discounted HIV projects. They may then wish to bargain with C to apply a threshold ofλ∗(which in this case =$117) rather than $100 per DALY averted as a condition of funding.
3
Model
In this Section, we provide some formal context to the procedure of the previous Section. We model the interaction between a donor D and country C as a Stackelberg (or leader-follower) game. D is the leader and makes a decision about how much to subsidise healthcare programmes; C decides what healthcare programmes to implement based on the schedule of subsidies on offer, but also how much to invest in healthcare relative to what we call their “outside option” - an alternative investment opportunity which is not valued by D. One can think of the outside option as being theopportunity costof expenditure on healthcare.
Figure 2: Payments by donor and country as the threshold is varied
max P
i∈I
wixi
s.t. P
i∈I
δi≤Bdonor (DON OR)
δi≥0 ∀i∈I
x∈argmax(COU N T RY)
• I= 1, ..., i, ..., nis the index set of a set of healthcare projects
• wi is the (positive) value of healthcare projectito D
• xiare decision variables indicating whether healthcare projectiis funded
or not, and the vector of these decision variables is denotedx
• δi are decision variables indicating the level of subsidy provided by D to
healthcare project i
• Bdonor is D’s budget constraint
In other words, a critical element of D’s problem is that she does not actually allocate the funding, she merely decides on a set of subsidies which are used by C in solving COU N T RY. In this sense D can be thought of as a funding agency (such as the Global Fund) which provides financing to country partners and audits results, rather than an implementation agency, such as President’s Malaria Initiative, which actually runs and manages programmes on the ground, in-country itself.
C’s problem is as follows:
max P
i∈I
vixi+V0x0
s.t. P
i∈I
(ci−δi)xi+C0x0=Bcountry (COU N T RY)
xi∈ {0,1} ∀i∈I
x0∈[0,1]
The intended interpretation of this model is as follows:
• vi is the (positive) value of healthcare projecti to C andV0 is the value
of the outside option
• ci is the (positive) cost of healthcare projecti to C andC0 is the cost of
the outside option
• Bcountry is C’s budget constraint
• x0is a decision variable indicating the extent to which the outside option
is funded
One possibly contentious feature of this model is the linearity of the outside option. This assumption can be considered as justified by a sort of Taylor-series assumption - there are many opportunities for government investment in the public sector outside health, and so the local gradient of the production function may be approximately linear. A more pragmatic assumption is that relaxing this assumption of linearity seems to lead to a problem which is more complicated to solve. Another assumption is that the budget constraint is fixed, but it might be that an injection of the donor funds changes the government budget (quite possibly downwards). This assumption we justify as being reasonable when the government budget is relatively large: also it is necessary to advance the analysis.
Assumption 1 P
i∈I
ci< Bcountry < C0
This assumption can be seen as locating the country as a middle income country in a very direct way: it could fund all healthcare projects currently on the table out of its domestic budget, but this domestic budget is swamped by competing claims from other sectors of government. (The technical reasons for having this assumption will become clear in the course of the proof of Proposition 1.)
Proposition 1 For every optimal solution to DON OR problem, there exists an optimal solution to the following integer knapsack problem KP D and vice versa.
max P
i∈I
wixi
s.t. P
i∈I
∆ixi≤Bdonor (KP D)
xi∈ {0,1},∀i∈I
where∆i =ci−vViC00 for allIm⊆Iwhich are defined as the set of marginal
projects{i:vi< ciV0/C0} and∆i= 0for all other projects i /∈Im
Proof. We show this by proving that for an optimal solution to one problem, there exists a feasible solution to the other problem and vice versa.
⇒Letx∗, be an optimal solution toKP D. First make a quick observation that the optimal solution we consider will have x∗i = 1 for i /∈ Im. If not,
we can make its value one and we will only to increase the objective value (as
wi ≥ 0) and we will not violate the budget constraint (as ∆i = 0). Define
Im∗ :={i∈Im:x∗i = 1} and ∆∗i := ∆ix∗i, for all i∈I. We will first show that
the (x∗,∆∗) is a feasible solution toDON OR. In order to do that we need to first show that there exists ax∗0, such that (x∗, x∗0) is an optimal solution to the
COU N T RY(∆∗) (problem COU N T RY with the subsidy parameter as ∆∗). We claim that
x∗0=BCOU N T RY − P
i /∈Imci−
P
i∈I∗
m(ci−∆
∗
i)
c0
.
In order to see this we will take any feasible solution (˜x,x˜0) toCOU N T RY(∆∗)
and systematically convertx˜intox∗and show that in this process the objective function only increases. We will now perform the following three operations on (˜x,x˜0):
• If ˜xi= 0 for somei /∈Im, then we can make ˜xi= 1 and decrease ˜x0by cci0
(which we can always do by the first inequality of Assumption 1). Since
vi
ci ≥
V0
C0, this will only increase the objective function value. Similarly, we can do this for alli /∈Imwith ˜xi= 0.
• Next, for some i ∈ Im/Im∗ with ˜xi = 1, we can reduce it to zero and
increase ˜x0 by Cci
Assumption 1). Notice that doing this will strictly increase the objective value since ∆∗i = 0 and vi
ci <
V0 C0
• Finally, for somei∈Imwith ˜xi= 0, we can increase it to one and decrease
˜
xiby ci−∆∗i
C0 (which we can always do by the first inequality of Assumption 1). This will not alter the objective value because vi
ci−∆∗i
= V0 C0.
Clearly we have set all ˜xi = 0 for alli∈Im/Im∗ and ˜xi = 1 for alli∈Im∗ and
i /∈Im, which is exactlyx∗. It is also easy to notice that after performing the
above operations we get ˜x0 =x∗0. Therefore x∗ ∈argmax(COU N T RY), and
thus it satisfies the third constraint of DON OR. This ends the proof in one direction.
⇐Let (x∗, δ∗) be the optimal solution toDON OR. We have to show that x∗ is a feasible solution to KP D. We will only focus on i ∈Im with x∗i = 1.
Any other project,i, will not affect the feasibility ofKP D, since we either have ∆i = 0 (when i /∈Im) or we have xi∗ = 0. For some i ∈ Im with x∗i = 1, we
should notice thatδ∗i ≥ci−viVC00. Let us assume the contrary: δ∗i < ci−viVC00.
If we reduce the value ofx∗i to 0 and increase the value of x∗0 by ci−δi∗
C0 , then the objective value of COU N T RY(δ∗) would strictly increase by a value of
V0ci−δ
∗ i
C0 −vi, becauseV0 ci−δ∗i
C0 −vi>0 by assumption. This is a contradiction to the optimality of (x∗, x∗0) toCOU N T RY(δ∗). So we indeed haveδi∗≥ci−viVC00.
But from the feasibility of (x∗, δ∗) toDON OR, we have
X
i∈I
δ∗i ≤BDON OR
From the above claim we just proved, we have
X
i∈I
∆ix∗i ≤
X
i∈I
δi∗
Hence the first constraint ofKP Dis satisfied and this completes the proof.
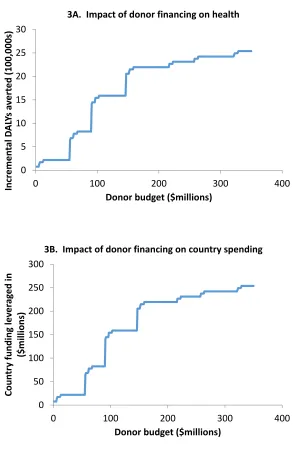
The problem KP D is easily solvable using standard software. We find the solutions for the example we introduced in the previous section using the Solver add-in for MSExcel. First we solve the version of the problem in which D and C have the same benefit coefficients. The DALYs gained which can be attributed to projects subsidised by D for the optimal solutions, and the amount of country finance leveraged in thereby, are shown for a range of budget levels in Figures 3A and 3B. It can be seen that the shape of the curves appear similar: in fact they are identical. The reason for this is that each DALY attributable to a project subsidised by D has to be matched by exactly $100 from C.
that the curve of Figure 4B looks somehow “more irregular” than that of the other figures, and indeed it is non-monotonic, ie does not always increase as the budget increases. This is because C’s priority ordering is quite different from D’s, so sometimes D may have to put a relatively small amount of money to induce C do to something D regards as relatively attractive, and sometimes a relatively large sum of money to do something D sees as unappealing.
Although it is not difficult to solve the model KP D computationally, the model can also be solved heuristically using the approach of Section 2. The ap-proach of Section 2 is not truly optimal: to see this consider the case where D has a budget of $300,000 and has three investment opportunities: two each involve involve subsidising $200,000 and saving 20 lives (at $100,000 per life saved), and the other involves subsidising $300,000 and saving 25 lives(at $120,000 per life saved). Although the $300,000 subsidy is clearly the least cost-effective of the three, it is also the optimal choice, saving five more lives than either of the other two options, because the fixed budget means that at most one of the three investment opportunities available can be selected. However, although not strictly optimal, the rule of Section 2 has the advantage that it is intuitive and easy to follow rather than going through a “blackbox” algorithm.
4
Discussion
A common criticism of development aid is that it distorts local country priorities and an important principle underlying recent discourse on aid effectiveness is “country ownership”: aid recipients should set and lead their own development strategies, and use aid in pursuing these strategies, rather than having their priorities dictated by outside parties (OECD, 2005/2008). Can the model we have outlined be used in a way which is consistent with this important principle? In our example and in our model we do not assume that the donor and the country have a common valuation of the healthcare projects which are on the table. (The donor’s vector of benefit coefficients are w and the country’s is
v.) There could be many reasons for this. For example, donors and countries may differ in terms of time horizon or in terms of risk attitude. Alternatively, donors may have a mandate only to fund particular diseases, or only diseases of particularly subpopulations (e.g. children), or they may be particularly con-cerned about global public goods, and so be prepared to support stewardship initiatives which protect against the development of drug resistant pathogens. More fundamentally, donors and countries may have different preferences for the various dimensions of health or even philosophical perspectives on the value of healthcare: for example, countries may justify spending on healthcare on the basis of economic benefits, but donors may prioritise based on reduction of the burden of disease, as measured in Disability Adjusted Life Years (DALYs) or some similar metric.
and is entirely compatible with country ownership, explicitly acknowledging that the country may have their own objectives which differ from those of the donor.
We believe that acknowledging that such differences exist is essential for an open and respectful dialogue between donor and country about aid which can lead to an arrangement in which there is genuine country ownership. In practice, donors subject country plans to technical evaluation to ensure that the benefits which aid is intended to bring will actually be realised. This is not in itself an infringement of country ownership, as it is intended to help the country realise its own stated objectives.
Our model should not be understood as providing an algorithm for aid al-location but rather a starting point for discussion between donor and country. Given that resources are limited, it is reasonable for donors to initiate discussions by offering to fund expensive treatments for multi-drug resistant tuberculosis, on the basis that countries should fund highly cost-effective interventions (e.g. condom provision for sex workers or men who have sex with men) themselves if they are wealthy enough to do so. In return, if the country can offer some compelling and legitimate argument why this is not feasible in their context, it is incumbent on donors to think again.
An important issue arising from our model and which must be addressed through such a dialogue is the nature of what we have called the “outside op-tion”. Donors, like the Global Fund, may have a mandate which is focussed on particular diseases. This does not mean that they can be blind to the impact of their actions on the rest of the health system, or indeed, the rest of the public sector. Our model is provides donors with an allocation rule which encourages countries to invest in health services, if that is their priority. If this encour-ages countries to implement progressive taxation or crack down on corruption, or reign in aggressive military expenditure in order to raise funds, this is to be welcomed. If on the other hand, countries respond to these incentives by raiding the education budget, this may not be on balance good for the local population. Such considerations cannot in our view by taken into account by algorithm: there is no substitute for a context-sensitive appraisal of what is happening in country.
5
Conclusion
The world has made significant progress in the improving human health over the last several years. However, many people still lack access to the healthcare they need. This is in part because resources are inevitably limited, but also because the resources which are available are often misallocated. Health economics and health economists have a huge potential contribution to make to providing sys-tematic methods to ensure decision makers use these limited resources in the best possible way.
Chalkidou et al (2016) have argued that although the core principles un-derlying sound and defensible priority setting are the same everywhere, specific solutions have to be tailored to local contexts and problems. The argument of our paper is that this is particularly the case for global donors. Global donors have a responsibility to use funds wisely and this means working in partnership with countries to support countries in developing their own healthcare systems (Kanpirom et al, 2017). The argument of this paper is that the standard al-gorithm of cost-effectiveness analysis - prioritise in value for money order - is not appropriate where countries do have the wherewithal to share costs. In-stead, donors should consider subsidising interventions which are marginal for countries, so as to maximally leverage indigenous country financing. Such a decision rule has the attractive feature that it encourages countries to adopt sustainable financing arrangements, where the most cost-effective components of the healthcare system are funded directly out of core government revenues.
The model we propose is eminently practical as estimates for the key pa-rameters are widely available. For example, the last few years have seen lively discussion of the estimation and role of country-level cost-effectiveness thresh-olds (Bertram et al, 2016; Woods et al., 2016), which can be thought of as playing the role of the outside option in our model. Although these estimates are not perfect, the more they are seen to play a role in decision making via models like that proposed here, the faster the quality of these estimates will improve. Although we believe it is currently fit for purpose, the model offers scope for development by relaxing assumptions such as project independence, integrality, and certainty about key coefficients. Developing more general mod-els (for example incorporating constraints on non-monetary resources such as staff, incorporating uncertainty on the part of the donor about how the country frames its optimisation problem) is a technically demanding task, and is left as a challenge for future research in this area.
6
References
Bertram MY, Lauer JA, De Joncheere K, Edejer T, Hutubessy R, Kieny M-P, Hill SR. Cost-effectiveness thresholds: pros and cons. Bull World Health Organ 2016;94; 925-930.
Development: Washington DC; 2013.
Caprara, A, Carvalho, M, Lodi, A, and Woeginger, GJ. A complexity and approximability study of the bilevel knapsack problem. In Proceedings of the 16th international conference on Integer Programming and Combinatorial Opti-mization(IPCO’13), Goemans M and Correa J (Eds.). Springer-Verlag: Berlin, Heidelberg, 98-109; 2013.
Chalkidou K, Glassman A, Marten R, Vega J, Teerawattananon Y, Tri-tasavit N, Gyansa-Lutterodt M, Seiter A, Kieny MP, Hofman K, Culyer AJ. Priority-setting for achieving universal health coverage. Bull World Health Or-gan 2016;94; 462-467.
Dempe, S, Richter, K. Bilevel programming with Knapsack constraint. Cen-tral European Journal of Operations Research 2000; 8; 93-107.
Dielman JL, Schneider MT, Haakenstad A, Singh L, Sadat N, Birger M, Reynolds A, Templin T, Hamavid H, Chapin A, Murray CJ. Development as-sistance for health: past trends, associations, and the future of international flow for health. Lancet 2016; 387(10037);2536-44.
Drummond, MF, Sculpher, MJ, Claxton, K, Stoddart, GL, Torrance, GW. Methods for the Economic Evaluation of Health Care Programmes. 4th edition. OUP: Oxford; 2015.
Dykstra, S, Glassman, A, Kenny, C, Sandefur, J. The Impact of Gavi on Vaccination Rates: Regression Discontinuity Evidence. Working Paper 394. Center for Global Development: Washington DC; 2015.
Kanpirom, K, Luz, ACG, Chalkidou, K, Teerawattananon, Y. How Should Global Fund Use Value-for-Money Information to Sustain its Investments in Graduating Countries? International Journal of Health Policy and Management 2017; 6(9); 529-533.
Lu C, Schneider MT, Gubbins P, Leach-Kemon K, Jamison D, Murray CJL. Public financing of health in developing countries: a cross-national systematic analysis. Lancet 2010;375; 1375-1387.
Martens B, Mummert U, Murrell P and Seabright P. The Institutional Eco-nomics of Foreign Aid. CUP: Cambridge, 2002.
Morton A. Aversion to health inequalities in healthcare prioritisation: A multicriteria optimisation perspective. J Health Econ 2014;36; 164-173.
Morton A, Thomas R, Smith PC. Decision rules for allocation of finances to health systems strengthening. J Health Econ 2016; 49; 97-108.
Neumann PJ, Sanders GD, Russel, LB, Siegel, JE and Ganiats, TG. Cost-effectiveness in health and medicine. 2nd edition. OUP: Oxford; 2016.
OECD. The Paris Declaration on Aid Effectiveness and the Accra Agenda for
Action. OECD: Paris; 2005/ 2008. Available at http://www.oecd.org/dac/effectiveness/34428351.pdf. Accessed 27/02/2017.
Roodman D. Doubts about the evidence that foreign aid for health is dis-placed into non-health uses. Lancet 2012;380; 972-973; author reply 973.
Svensson, J. Foreign aid and rent-seeking. Journal of International Eco-nomics 2000: 51(2).
Health Organisation: Geneva; 2003.
Teerawattananon, Y, McQueston K, Glassman A, Yothasamut J, and Myint CY. Health Technology Assessments as a Mechanism for Increased Value for Money: Recommendations to the Global Fund. Globalization and Health 2013: 9(35). doi:10.1186/1744-8603-9-35.
The Global Fund. The Global Fund. http://www.theglobalfund.org/en/. n.d. Accessed 25/02/2017.
United Nations. We can end poverty: Millenium Development Goals and Beyond 2015. 2015. http://www.un.org/millenniumgoals/aids.shtml. Accessed 25/01/17.
van Baal P, Meltzer D and Brouwer W. Future Costs, Fixed Health Care Budgets and the Decision Rules of Cost Effectiveness Analysis. Health Econ 2016; 25(2); 237248.
van Baal P, Morton A, and Severens J L. Health care input constraints and cost effectiveness analysis decision rules. Social Science and Medicine 2018; 200; 59-64.
Van de Sijpe N. The Fungibility of Health Aid Reconsidered. J Dev Stud 2013;49; 1746-1754.
Weinstein M, Zeckhauser R. Critical ratios and efficient allocation. Journal of Public Economics 1973;2; 147-157.
Wilkinson T, Sculpher MJ, Claxton K, Revill P, Briggs A, Cairns JA, Teer-awattananon Y, Asfaw E, Lopert R, Culyer AJ, Walker DG. The International Decision Support Initiative Reference Case for Economic Evaluation: An Aid to Thought. Value Health 2016;19; 921-928.
Woods B, Revill P, Sculpher M, Claxton K. Country-Level Cost-Effectiveness Thresholds: Initial Estimates and the Need for Further Research. Value in Health 2016;19; 929-935.
7
Acknowledgements
use this material in a public lecture at Aalto University in Helsinki. Thanks also go to Vikram Pathania, who provided some relevant references in the interna-tional development literature. We also express our thanks to Martin Chalkley as handing Editor for this paper and one anonymous referee for their helpful comments.
0 5 10 15 20 25 30
0 100 200 300 400
In
cr
em
en
tal D
AL
Ys a
vert
ed (1
00
,000
s)
Donor budget ($millions) 3A. Impact of donor financing on health
0 50 100 150 200 250 300
0 100 200 300 400
Co
un
tr
y fu
nd
ing
le
ver
ag
ed
in
($
millions)
Donor budget ($millions)
[image:23.612.159.455.145.599.2]3B. Impact of donor financing on country spending
0 10 20 30 40 50 60
0 100 200 300 400
In
cr
em
en
tal D
AL
Ys a
vert
ed (1
00
,000
s)
Donor budget ($millions) 4A. Impact of donor financing on health
0 50 100 150 200 250 300 350
0 100 200 300 400
Co
un
tr
y fu
nd
ing
le
ver
ag
ed
in
($
millions)
Donor budget ($millions)
[image:24.612.161.447.152.346.2]4B. Impact of donor financing on country spending