1
Potential impact of introducing the pneumococcal conjugate vaccine into
1national immunization programmes: an economic-epidemiological analysis
2using data from India
34
Itamar Megiddo1,2,*, Eili Klein2,3, Ramanan Laxminarayan1,2,4,* 5
6
1 Department of Management Science, University of Strathclyde, Glasgow, UK
7
2 Center for Disease Dynamics, Economics & Policy; Washington, DC USA
8
3 Department of Emergency Medicine, Johns Hopkins University, Baltimore, MD, USA
9
4 Princeton Environnemental Institute, Princeton University, Princeton, NJ USA
10 11
* Corresponding authors: 12
Itamar Megiddo ([email protected]) 13
Department of Management Science 14
University of Strathclyde 15
199 Cathedral Street 16
Glasgow 17
G4 0QU 18
Phone: +44 (0)141 548 3452 19
20
Ramanan Laxminarayan ([email protected]) 21
Center for Disease Dynamics, Economics & Policy 22
1400 Eye St NW, Suite 500 23
Washington, DC 20005 24
Phone: +1 (202) 939-3300 voice 25
26
Word count: 4,605 27
28
Abbreviations: 29
30
ABM Agent-based model 31
CEAC Cost-effectiveness acceptability curve 32
CI Confidence interval 33
cMYP Comprehensive multi-year plan for immunization 34
DLHS District Level Household Survey of India 35
DPT Diphtheria, pertussis, tetanus 36
GAVI Global Alliance for Vaccines and Immunization 37
HICs High-income countries 38
ICER Incremental cost-effectiveness ratio 39
IPD Invasive pneumococcal disease 40
2 NTAGI National Technical Advisory Group on Immunization
42
NVT Non-vaccine serotype 43
OOP Out-of-pocket 44
PCV Pneumococcal conjugate vaccine 45
PCV7 7-valent pneumococcal conjugate vaccine 46
PCV9 9-valent pneumococcal conjugate vaccine 47
PCV13 13-valent pneumococcal conjugate vaccine 48
RCT Randomized control trial 49
S. pneumoniae Streptococcus pneumoniae 50
UI Uncertainty interval 51
UIP Universal Immunization Programme 52
VOI Value of insurance 53
VT Vaccine serotype 54
WHO World Health Organization 55
3 ABSTRACT
57
Pneumococcal pneumonia causes an estimated 105,000 child deaths in India annually. The 58
planned introduction of the serotype-based pneumococcal conjugate vaccine (PCV) is 59
expected to avert child deaths, but the high cost of PCV relative to current vaccines provided 60
under the Universal Immunization Programme has been a concern. Cost-effectiveness studies 61
from high-income countries are not readily comparable because of differences in the 62
distribution of prevalent serotypes, population, and health systems. We used IndiaSim, an 63
agent-based simulation model representative of the Indian population and health system, to 64
model the dynamics of Streptococcus pneumoniae.We estimate that PCV13 introduction 65
would cost approximately $240 million and avert $48.7 million in out-of-pocket expenditures 66
and 34,800 (95% confidence interval [CI] 29,600–40,800) deaths annually assuming 67
coverage levels and distribution similar to DPT (diphtheria, pertussis, and tetanus) 68
vaccination (~77%). Introducing the vaccine protects the population, especially the poorest 69
wealth quintile, from potentially catastrophic expenditure. The net-present value of predicted 70
money-metric value of insurance for 20 years of vaccination is $160,000 (95% CI $151,000– 71
$168,000) per 100,000 under-fives, and almost half of this protection is for the bottom wealth 72
quintile ($78,000; 95% CI 70,800—84,400). Extending vaccination to 90% coverage averts 73
additional lives and provides additional financial risk protection. Our estimates are sensitive 74
to immunity parameters in our model; however, our assumptions are conservative, and if 75
willingness to pay per years of life lost (YLL) averted is $228 or greater then introducing the 76
vaccine is more cost-effective than our baseline (no vaccination) in more than 95% of 77
simulations. 78
4 Key words: Pneumococcal disease; Pneumonia; Pneumococcal conjugate vaccine;
80
Streptococcus pneumoniae; cost-effectiveness; financial-risk protection; agent-based model 81
5 SUMMARY BOX
84
What is already known about the topic?
85
• Streptococcus pneumoniae was responsible for an estimated 105,000 pneumonia 86
deaths in India in 2010, in addition to causing meningitis and other forms of invasive 87
disease. 88
• The pneumococcal conjugate vaccine (PCV) greatly reduced disease burden in high-89
income countries (HICs); however, the effectiveness and impact of PCV (including 90
serotype replacement) varied significantly between countries, and it is significantly 91
more expensive than other vaccines in India’s Universal Immunization Programme 92
(UIP). 93
• To circumvent the paucity of information on the vaccine’s effectiveness in low- and 94
middle-income countries (LMICs), economic analyses of PCV in LMICs typically 95
assume similar effectiveness as in HICs. 96
What are the new findings
97
• The local distribution of dominant serotypes, host population characteristics and 98
behaviour, and vaccination programs, affect the vaccine’s effectiveness. 99
• Despite uncertainty, we project that the vaccine will avert a significant number of 100
deaths, provide financial risk protection for poor populations, and deliver value for the 101
cost as assessed by the World Health Organization’s cost-effectiveness guidelines. 102
Recommendations for policy
103
• Economic analysis should consider local context and the dynamics of S. pneumoniae 104
transmission and serotype replacement within that setting. 105
• Given our conservative assumptions and our projections of PCV13 effectiveness and 106
6 existing data gaps remain and the vaccine’s effectiveness should be continuously 108
monitored as it is rolled out. 109
7 INTRODUCTION
111
Streptococcus pneumoniae was responsible for an estimated 393,000 (95% uncertainty 112
interval [UI] 228,000–532,000) child pneumonia deaths globally in 2015, with nearly all 113
mortality occurring in low- and middle-income countries (LMICs) [1]. The introduction of a 114
seven-valent pneumococcal conjugate vaccine (PCV7) in the early 2000s greatly reduced 115
disease incidence and hospitalization in high-income countries (HICs), by reducing invasive 116
pneumococcal disease (IPD), which occurs when S. pneumoniae invades normally sterile 117
sites such as the bloodstream [2]. PCV7 provided protection against the seven most common 118
serotypes causing IPD in the United States at the time, and countries have since adopted 119
expanded PCVs that provide protection against serotypes estimated to cause approximately 120
70% of IPD globally [3]. Today, 135 countries include a PCV in their national immunization 121
program [4]. 122
123
In India, an estimated 105,100 (95% confidence interval [CI] 92,100–120,000) of 356,300 124
(CI 311,600–407,400) under-five pneumonia deaths were associated with S. pneumoniae in in 125
2010 [5]. In 2016, the National Technical Advisory Group on Immunization (NTAGI) 126
recommended introducing a PCV in the universal immunization programme (UIP), which 127
targets a cohort of 27 million newborns with six vaccines across the country and another two 128
vaccines (against rotavirus and Japanese encephalitis) in a few states. The Indian government 129
had planned to roll out PCV in three states in 2017, but progress remains slow in part due to 130
the relatively high cost of PCV compared to other vaccines already provided under UIP [6– 131
8]. The Global Alliance for Vaccines and Immunization (GAVI) has pledged to support PCV 132
provision until 2021 [9], after which the cost of the vaccine will have to be borne by the 133
Indian government. The affordability and cost-effectiveness of the vaccine is especially 134
8 have found PCV introduction to be cost-saving or cost-effective according to World Health 136
Organization (WHO) or local thresholds [10–13], but retrospective studies in other HICs, 137
such as the Netherlands and Australia, found it unlikely that the PCV7 vaccination 138
programme was cost-effective [14,15]. 139
140
In addition to PCV’s relatively high cost, the uncertainty regarding the vaccine’s potential 141
cost-effectiveness in LMICs stems from uncertainty surrounding its effectiveness in these 142
settings [6,7,14]. The incidence of vaccine serotype (VT) IPD fell markedly in many HICs 143
after the vaccine was introduced, but decreases in overall IPD varied significantly (e.g., IPD 144
decreased by 12% in Navarro, Spain while in the United States it decreased by 77%, see 145
[16]). The increase in the frequency of S. pneumoniae serotypes not covered by the vaccine, 146
also known as serotype replacement, contributed to this variation in overall IPD. In LMICs, 147
evidence on the effect of serotype replacement on overall vaccine effectiveness in the 148
population is lacking. Evidence on PCV from randomized control trials (RCTs) in LMICs 149
demonstrated that PCV7 and PCV9 are highly efficacious at reducing pneumonia and 150
invasive disease [17–19]. But RCTs are not designed to evaluate serotype replacement at the 151
population level. 152
153
Recent observational studies of the introduction of a PCV in South Africa (PCV7 in 2009) 154
and the Gambia (PCV13 in 2011) found that IPD in children under two dropped by 69% (CI 155
62–76) and 55% (CI 30–71) within one year of introduction, respectively. However, both 156
studies found that disease caused by non-vaccine serotypes (NVTs) was increasing, and, in 157
the case of Gambia, overall IPD increased in the final year of the study [20–22]. In South-158
East Asia, both Bangladesh and Nepal introduced PCVs in 2015, but data on effectiveness 159
9 161
Economic analyses of introducing PCV need to consider the dynamics of S. pneumoniae 162
transmission within the context of the setting being analyzed. Local differences in 163
distributions of dominant serotypes, host populations, health system structure, and 164
vaccination programs all contribute to the variation in the vaccine’s impact across countries 165
[23]. To estimate PCV outcomes given these factors, models need to consider the colonized— 166
asymptomatic carrier—population, which is the reservoir of transmission. In HICs that 167
introduced PCV, serotype replacement among colonized individuals was higher and more 168
consistent than serotype replacement in IPD.A logical explanation for higher replacement 169
among the colonized individuals than in IPD cases is that NVTs cause less disease than VTs. 170
If this is the case, the variation in reduced IPD across countries may be partially attributable 171
to local differences in the distribution of colonizing serotypes. Other theories have been 172
proposed to explain the higher serotype replacement seen in colonization than in IPD [16], 173
and projecting the dynamics of S. pneumoniae transmission in LMICs with a paucity of data 174
is difficult. Nonetheless, evaluations of PCV introduction need to consider these economic-175
epidemiological dynamics. They need to project serotype dynamics within the local context, 176
or, at the very least, they should consider that the outcomes may not be the same in high-177
burden-LMICs instead of current practice that either ignores the disease dynamics all together 178
or assumes similar herd effects and serotype replacement as in low-burden-high-income 179
settings (see [24–28]). 180
181
To project trends in under-five pneumococcal infections, including bacteremic and non-182
bacteremic pneumonia, meningitis, and other IPD, and estimate the potential financial risk 183
10 pneumoniae dynamics in an agent-based model (ABM) of the Indian population and
185
healthcare system. 186
187
METHODS 188
Agent-based simulation model
189
We adapted our survey-data driven ABM of an in silico population representative of the 190
Indian population, IndiaSim [29–32]. Our simulated population size was approximately 191
25,000 individuals and 4,300 households. Individuals in the simulation interacted with each 192
other (contacts) and with the healthcare system, getting vaccinated and seeking care. 193
Individuals were either healthy and not colonized, healthy and colonized, or colonized and 194
symptomatically infected. Those symptomatically infected with S. pneumoniae chose 195
whether to seek care. Individuals could also seek care for exogenous infections. Simulations 196
were run with one-week time steps. Demographic and socioeconomic data and healthcare 197
choices at the individual and household levels were drawn from the District Level Household 198
Survey (DLHS-3) of India [33] and from literature on care seeking behaviour in India 199
[34,35]. Additional details on IndiaSim are in the supplementary appendix and in previous 200
publications [30–32]. The model was programmed in C++11 standard and outcomes analysed 201
in R, version 3.2 [36]. 202
203
Pneumococcal colonization and transmission dynamics
204
Pneumococcal disease dynamics were included in IndiaSim based on work by Cobey and 205
Lipsitch [37]. We included 15 serotypes that are representative of the serotype distribution in 206
India [38]; we did not model particular serotypes, but a representation of the S. pneumoniae 207
population. 208
11 Transmission between individuals could occur when a carrier (or symptomatically infected) 210
individual came into contact with other individuals. The probability of transmission of 211
serotype 𝑧 depended on the susceptibility of the individual, a function of both current and 212
historical colonizations and infections: 213
214
𝑞(𝑧, 𝜃⃗, 𝐶⃗) = [1 − 𝜔(𝐶⃗)] [1 − 𝑚𝑖𝑛 ((1 − 𝑝), min(1, 𝜎 ∙ 𝜏(𝑧)))], (1) 215
where 𝜃⃗ and 𝐶⃗ are indicator vectors of past and current colonization, indexed by 𝑧. Current 216
colonization was assumed to reduce susceptibility through competition, described by the term 217
in the first bracket in (1), where 𝜔(𝐶⃗) was set to: 218
219
𝜔(𝐶⃗) = {
0, ∑ 𝐶𝑖 = 0(notcolonized)
𝜇𝑚𝑎𝑥[1 −
𝑚𝑖𝑛(𝑓⃗) − 1
𝑍 − 1 ] , ∑ 𝐶𝑖 > 0(colonized),
(2)
220
where 𝑍 is the number of serotypes in the model, 𝜇𝑚𝑎𝑥 is the maximum scaling down of 221
susceptibility due to strain competition, and 𝑓⃗ is a vector of serotype fitness ranks such that 222
𝑚𝑖𝑛(𝑓⃗) is the rank of the most fit carried serotype. Serotype-specific immunity, described in 223
the term in the second bracket in (1), also reduced susceptibility: 𝑝 is vaccine efficacy for the 224
targeted serotypes, 𝜎 is an anticapsular immunity parameter (equivalent for all serotypes), 225
and 226
227
𝜏(𝑧) = {0,1, 𝜃𝜃𝑧 = 0(notpreviouslycleared)
𝑧 > 0(previouslycleared). (3)
12 The duration of colonization in successful transmissions was drawn from an exponential 229
distribution in which the mean was: 230
231
𝑣(𝑧) = 𝑘 + [𝛾(𝑧) − 𝑘]𝑒−𝜖 ∑ 𝜃𝑖 𝑖 (4)
232
Serotypes were assumed to differ in their fitness, modelled as a reduction in the length of 233
colonization (𝛾(𝑧)) [39,40]. Duration exponentially decreased with the sum of past 234
colonizations (∑ 𝜃𝑖 𝑖), describing the serotype-independent immunity. 𝑘 is the minimum 235
duration of colonization and 𝜖 is a fitted shape parameter. Parameterization of colonization 236
and transmission dynamics are based on Cobey and Lipsitch [37], which fits the functions to 237
data from vaccine naïve populations. 238
239
If the person sought care (either for S. pneumoniae infection or for an exogenous infection) 240
and was prescribed antibiotics, duration was updated accordingly. Additional details of the 241
dynamics are in the supplementary appendix and the model parameters are presented in Table 242
1 and in the following text. 243
[image:12.595.65.531.566.750.2]244
Table 1. Parameters 245
Description Symbol§ Base-case
[sensitivity values/distribution] Source Disease model
Number of serotypes Z 15 Under-five
colonization prevalence fitted to
40% Authors assumption based on [41–50].
Contact rate β colonization prevalence Fitted to under-five
Immigration force of
infection ω 1e-06 As in [37]
Intrinsic duration of carriage for serotype z
γ(z) 25-220 days (linearly increasing across serotypes)
As in [37],
13
Description Symbol§ Base-case
[sensitivity values/distribution] Source
Reduction in susceptibility to pneumococcus from carrying the fittest serotype
μmax 0.25 As in [37]
Reduction in susceptibility to a serotype conferred by prior carriage of that serotype
σ 0.5 [0.5, 0.8] ≥ 0.5 based on results for Z = 15 in [37]
Shape parameter for the reduction in duration of carriage dependent on past colonization
ε 0.1 [0.1, 0.25, and 0.4] Based on [37]
Case-carrier ratio (pneumococcal pneumonia, meningitis, and other invasive pneumococcal disease)
Fitted to disease incidence given
colonization prevalence Based on [53–55,5]
Case fatality rate Fitted to death rate Based on [53,54,56,5]
Treatment
Seek treatment Wealth quintile I: 48%; II: 51%;
III: 60%; IV: 66%; V: 75% Based on [34,57,35]
Probability seek care at public provider (if seek care)
- Wealth quintile I: 55% [triangular min = 44%, max =
66%, mode = 55%]; - II: 51% [triangular 40%, 61%,
51%]
- III: 43% [triangular 35%, 52%, 43%);
- IV: 39% [triangular 31%, 47%, 39%];
- V: 26% [triangular 21%, 32%, 26%]
Receive appropriate treatment at health provider
95% Authors’ assumption
Inpatient meningitis
cost Based on [57–59]
Public providers $191 [triangular min = $134, max = $248, mode = $191]
Private providers $275 [triangular min = $193, max = $358, mode = $275] In-patient pneumonia
cost Based on [57,59,60]
Public providers $93 [triangular min = $65, max = $121, mode = $93]
Private providers $214 [triangular min = $150, max = $278, mode = $214] In-patient other
pneumococcal disease cost
14
Description Symbol§ Base-case
[sensitivity values/distribution] Source
Public providers $76 [triangular min = $53, max = $99, mode = $76]
Private providers $194 [triangular min = $136, max = $252, mode = $194]
Outpatient cost Based on [57,59]
Public providers $7.55 [triangular min = $5.30, max = $9.80, mode = $7.55]
Private providers $9.47 [triangular min = $6.60, max = $9.80, mode = $12.30] Unattended
pneumonia cost
$1.05 [triangular min = $0, max = $1.40, mode = $1.05] [61] Antibiotics clear
colonization or symptomatic infection
50% Authors assumption based on Van Effelterre et al. 2010 [62–64]
Exogenous antibiotic prescription rate (per day)
0.001327 Based on IMS Health MIDAS database
Vaccine
PCV13 % of cases Most common serotypes
representing approximately 70% Based on [38,65].
Per-person vaccine
efficacy p 0.6
As in [37],
estimated using [66]
Per-child cost in
scenario 1† $13.60 [triangular min = $6.35, max = $18.95, mode = $13.60] Based on WHO cMYP tool. Per-child cost in
scenario 2† $13.50 [triangular min = $6.25, max = $18.85, mode = $13.50] Based on WHO cMYP tool.
§Symbols for Cobey and Lipsitch 2012 model.
†Three doses at $3.30 per dose and training, syringe, wastage costs (5% vaccine wastage rate and 10% syringe wastage rate), and a 25% buffer stock. Ranges for the sensitivity assume $1 to $5 per dose.
Values varied for sensitivity are in brackets. Costs in 2014 US dollars.
246
Fitted pneumococcal colonization prevalence
247
Studies from the past fifteen years found S. pneumoniae colonization prevalence in India 248
ranging from 6.5% to 70.0% in children and infants [41–43,46–50,67,68]. We fit the contact 249
rate (β) so that the colonization levels of children under-five were ~40%. 250
15
Pneumococcal disease
252
Carriers of S. pneumoniae became symptomatically infected—developed bacteremic or non-253
bacteremic pneumococcal pneumonia, pneumococcal meningitis, or other invasive 254
pneumococcal disease—according to the invasiveness, or case-carrier ratio. The case-carrier 255
ratio represents infections per acquisition event, which we model as a function of the 256
probability of progressing to symptomatic disease in a time-step and the duration of carriage 257
(the number of time-steps). We assumed that VTs were carried for longer than NVTs [40], 258
and therefore VTs case-carrier ratio was greater. We fit the case-carrier and case-fatality rates 259
to estimates of disease incidence and deaths in the literature [56,54]. For more detail see 260
supplementary appendix. 261
262
Treatment and antimicrobial prescription
263
Individuals suffering from pneumococcal disease sought care (i.e., went to hospital/clinic and 264
received antibiotics) depending on their household wealth—wealthier individuals were more 265
likely to seek care [34,35]. Similar to Kouyos and others [69], we assumed that rates of 266
colonization were affected by individuals consuming antibiotics exogenously (i.e., for other 267
causes). Antibiotic consumption rates were drawn from IMS Health MIDAS (IMS Health, 268
Danbury, CT, USA) data on antibiotic consumption in India. The treatment costs for 269
pneumococcal disease were based on Tasslimi and other [59] and include care seeking, 270
diagnostics, hospitalization, and medication. 271
272
Vaccination scenarios
273
We evaluated three scenarios: (i) no vaccination; (ii) introducing PCV13 at DPT3 (diphtheria, 274
pertussis, tetanus vaccine) coverage levels (approximately 77%) and following the 2+1 275
16 that households that vaccinate with DPT in DLHS-3 continue to do so. We also increase 277
coverage to 2011 estimates [70]; see previous work on rotavirus vaccination [30]. For the 278
extended vaccination scenario, additional households were recruited randomly to increase 279
vaccination coverage rates to 90%. 280
281
The simulated vaccine did not protect against thirteen simulated serotypes. Instead, we 282
assumed the vaccine provided protection against the most common serotypes that contributed 283
70%–75% of disease incidence prior to vaccination [38,65]; this corresponded to 5 to 10 284
simulated VTs, depending on the simulation parameterization. The vaccine was assumed to 285
reduce susceptibility to asymptomatic carriage for VTs [37] as described by equation (1). The 286
vaccine likely further protects against carriers progressing to disease, but due to lack of 287
evidence, we conservatively assumed that the vaccine only affects susceptibility to 288
colonization for covered serotypes and has no further effect on progression to disease (case-289
carrier ratio). 290
291
Data on immunization costs were from India’s comprehensive multi-year plan (cMYP) for 292
immunization [71]. It included costs for the vaccine and syringes—including wastage—and 293
other related costs such as planning, training, transportation, and cold chain equipment. 294
295
Analysis and outcome measures
296
The primary outcome tracked was the change in under-five disease burden measured by 297
estimated disease incidence and deaths averted. We report values for non-severe and severe 298
pneumonia, pneumococcal meningitis, and other IPD. We consider both bacteremic and non-299
bacteremic pneumonia, and the classification of severe pneumonia is based on the WHO 300
17 indication for hospitalization. To measure serotype diversity, we calculated the Simpson 302
index—the probability that two randomly selected serotypes (with replacement) will differ— 303
and compared it to limited data from India. We also estimated the years of life lost (YLLs) 304
averted, the incremental cost-effectiveness (ICER) measured by the incremental cost per YLL 305
averted from a health systems perspective (costs described above), out-of-pocket (OOP) 306
expenditures averted, and the money-metric value of insurance (VOI)—the dollar amount the 307
population would be willing to pay to avert the risk of financial shock from OOP expenditure 308
on treatment [73]. 309
310
We ran simulations with fitted values for the contact rate, case-carrier ratio, and case-fatality 311
rate for a 200-year burn-in period, before introducing vaccination and then estimating 312
outcomes for the next twenty years. We report the rounded median present value for the 313
twenty-year intervention timeframe and annual outcomes. For averted burden estimates, we 314
report differences between median values for each scenario; for example, to estimate the 315
deaths averted by the intervention in scenario 1 we subtract the median deaths in intervention 316
scenario 1 from the median deaths in the no vaccination scenario. Costs and expenditures 317
were converted to 2014 US dollars (see supplementary appendix), and we used a discount 318
rate of 3%, consistent with standard practice. 319
320
Sensitivity Analysis
321
In addition to the base-case analysis, to assess the sensitivity of our results, we varied the 322
parameters for anticapsular immunity and serotype-independent immunity as described in 323
Table 1 since the interplay between naturally acquired and vaccine acquired immunity likely 324
impacts strain dynamics and serotype replacement. We ran simulations with each parameter 325
18 total running 1,800 simulations, 600 for each scenario. We constructed 95% CIs by drawing 327
5,000 bootstrap samples (e.g., of size 100 for base-case scenario 1 outcomes) from these 328
simulations for each statistic we estimated. In addition, we explored the sensitivity of the 329
ICERs to the immunity and economic parameters (Table 1); we set immunity parameters as 330
described above and drew 5,000 samples from the joint distribution of the economic 331
parameters. We constructed cost-effectiveness acceptability curves (CEAC) by calculating 332
the proportion of bootstrap samples that had the highest net benefit for each arm, where the 333
net benefit = 𝜆 × ∆𝑌𝐿𝐿 − ∆𝑐𝑜𝑠𝑡𝑠 and 𝜆 is the willingness to pay per YLL. 334
335
RESULTS 336
Serotype diversity
337
To compare the serotype diversity in our model to results in Cobey and Lipsitch [37] and to 338
data from India, we measured the Simpson index for our model outcomes and compared it to 339
the 0.93 index calculated from data collected by Manoharan et al [65], which identified 57 340
different serotypes and five non-typeable isolates. In our no vaccination simulations, the 341
median Simpson index was 0.92 (95% CI 0.90–0.93). 342
343
Disease burden
344
We estimated that introducing PCV13 at current DPT coverage levels would avert a median 345
481 (95% CI 456–502) non-severe pneumonia cases, 198 (95% CI 185–211) severe 346
pneumonia cases, 3 (95% CI 3–4) meningitis cases, and 16 (95% CI 14–17) other invasive 347
pneumococcal infections per 100,000 children under-five per year in the base-case (Figure 1). 348
This represented a decline of 20.9% (95% CI 19.8%–22.1%) in severe pneumococcal 349
pneumonia cases per year. The number of cases only stabilizes after five years, when it was 350
19 and extended coverage scenarios than in the baseline scenario. Cases of non-severe
352
pneumonia, meningitis, and other invasive pneumococcal disease were similarly reduced. 353
354
Our results varied significantly depending on the sensitivity to immunity parameters, which 355
affected the decline in under-five cases caused by VTs and serotype replacement by NVTs 356
(Figure 2A). In DPT vaccination coverage simulations where we set the serotype-specific 357
immunity parameter, which impacts susceptibility, to the base-case value σ = 0.5 (see 358
equation 1) and increased the impact of serotype-independent immunity on colonization 359
duration from the base-case by setting ϵ = 0.25 or ϵ = 0.4 (see equation 4), the number of 360
cases dropped by 22.6% (95% CI 21.1%–23.9%) and 19.1% (95% CI 17.8%–20.5%) 361
respectively. In simulations where we set the impact of serotype-specific immunity and 362
serotype-independent immunity to the highest in our range (σ = 0.8 and ϵ = 0.4), the number 363
of cases dropped by 9.8% (95% CI 8.5%–10.9%). 364
365
VT symptomatic infections decreased and NVT symptomatic infections increased after the 366
introduction of PCV13 for most parameter sets; there was no replacement by NVTs when 367
immunity parameters were high (σ = 0.8 and ϵ = 0.4) (Figure 2B and C). The highest increase 368
in NVTs was in simulations with low immunity parameter values; by the end of expanded 369
coverage simulations, NVT cases increased by 50.8% (95% CI 45.0%–57.0%) and VT cases 370
decreased by 73.1% (95% CI 71.8%–74.2%) among under-fives when immunity parameters 371
were low (σ = 0.5 and ϵ = 0.1). The decline in VT cases was lower when we increased the 372
anticapsular immunity parameter, σ, than when we increased the serotype-independent 373
immunity parameter, ϵ, and held other parameters at the base-case. For example, when σ = 374
0.5 and ϵ = 0.4, VT cases decreased by 47.9% (95% CI 46.5%–50.3%), and when σ = 0.8 and 375
20 However, the increase in NVT cases was similar in these simulations: when σ = 0.5 and ϵ = 377
0.4, NVT cases increased by 12.1% (95% CI 9.2%–17.8%), and when σ = 0.8 and ϵ = 0.1, 378
NVT cases increased by 12.7% (95% CI 7.8%–20.1%) by the end of simulation. Dynamics 379
over time of VT decline differed when σ = 0.8, which is higher than the vaccine’s serotype-380
dependent protection, p = 0.6; before stabilizing, VT disease increased slightly after the initial 381
decline. 382
383
The estimated median number of deaths averted by PCV13 over twenty years was 384
proportional to symptomatic infections (Table 2). There were 558 (95% CI 457-656) deaths 385
averted per 100,000 under-fives over 20 years in the DPT level vaccine coverage scenario in 386
the base-case, which, extrapolated to the full population, suggests 34,800 (95% CI 29,600– 387
40,800) deaths averted in children under-five per year (the CIs in this case and for other 388
extrapolations to the entire population do not account for uncertainty of the population size). 389
We estimated that an additional 13,800 (95% CI 5,600–19,000) deaths would be averted per 390
year with expanded coverage. However, outcomes for different parameter sets varied 391
significantly: when immunity parameters were the highest in our range (σ = 0.8 and ϵ = 0.4), 392
the difference in median deaths averted per year was 11,000 (95% CI 5,400–17,100) in the 393
DPT level vaccine coverage scenario and 16,200 (95% CI 10,200–21,900) in the extended 394
vaccine coverage scenario. 395
396
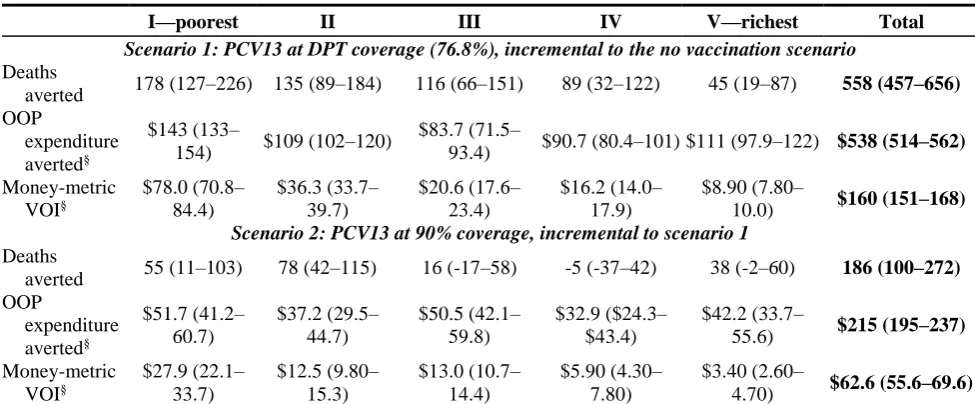
Deaths were inversely related to wealth. In the poorest portion of the population, 178 (95% 397
CI 127–226) deaths were averted per 100,000 children under-five over the twenty-year 398
intervention assuming DPT vaccine coverage levels. An additional 55 (95% CI 11–103) 399
21 quintiles IV and V, the wealthiest forty percent of the population, were significantly lower 401
than in the poorer population (89 [95% CI 32–122] in quintile IV and 45 [95% CI 19–87] in 402
quintile V) at DPT coverage levels. Expanded coverage in these groups was not significantly 403
different from no effect with an estimated -5 [95% CI -37–42] additional deaths averted in 404
quintile IV and 38 [95% CI -2–60] in quintile V. 405
[image:21.595.71.559.291.493.2]406
Table 2. Twenty year outcomes and present value costs per 100,000 under-fives by 407
wealth quintile (all parameter sets) 408
I—poorest II III IV V—richest Total
Scenario 1: PCV13 at DPT coverage (76.8%), incremental to the no vaccination scenario
Deaths
averted 178 (127–226) 135 (89–184) 116 (66–151) 89 (32–122) 45 (19–87) 558 (457–656) OOP
expenditure averted§
$143 (133–
154) $109 (102–120)
$83.7 (71.5–
93.4) $90.7 (80.4–101) $111 (97.9–122) $538 (514–562)
Money-metric VOI§ $78.0 (70.8– 84.4) $36.3 (33.7– 39.7) $20.6 (17.6– 23.4) $16.2 (14.0– 17.9) $8.90 (7.80–
10.0) $160 (151–168)
Scenario 2: PCV13 at 90% coverage, incremental to scenario 1
Deaths
averted 55 (11–103) 78 (42–115) 16 (-17–58) -5 (-37–42) 38 (-2–60) 186 (100–272) OOP expenditure averted§ $51.7 (41.2– 60.7) $37.2 (29.5– 44.7) $50.5 (42.1– 59.8) $32.9 ($24.3– $43.4) $42.2 (33.7–
55.6) $215 (195–237)
Money-metric VOI§ $27.9 (22.1– 33.7) $12.5 (9.80– 15.3) $13.0 (10.7– 14.4) $5.90 (4.30– 7.80) $3.40 (2.60–
4.70) $62.6 (55.6–69.6) Incremental differences between medians for 20 simulated years in each scenario using base-case parameters:
intervention scenario 1 incremental to the no vaccination scenario and intervention scenario 2 incremental to scenario 1. The totals are for a population of 100,000 under-fives. The distribution of under-fives across wealth quintiles is not equal. 95% CI in parentheses were constructed by 5,000 bootstrap samples for each scenario overall all parameter sets.
OOP: Out-of-pocket. VOI: value of insurance.
§ Present value discounted at 3% annually; US 2014 dollars; in thousands.
409
Financial risk protection
410
We found that introducing PCV13 into the UIP protected households from the risk of 411
expenditure on treatment and hospitalization for pneumococcal diseases. The estimated base-412
case present value out-of-pocket (OOP) expenditure averted per 100,000 was $538,000 (95% 413
22 additional $215,600 (95% CI $195,000–$237,000) with expanded coverage (Table 2).
415
Extrapolating to the Indian population, after the fifth year of introducing PCV13 the median 416
OOP expenditure averted would be approximately $48.7 million annually under DPT vaccine 417
coverage levels and an additional $13.9 million with expanded coverage. 418
419
The median OOP expenditure averted was estimated to be highest for quintiles I (in the DPT 420
coverage level scenario, the twenty-year present value was $143,000 [95% CI $133,000– 421
$154,000] per 100,000 under-fives in the base-case), but it showed no clear trend across other 422
wealth quintiles. The money-metric VOI decreased with wealth. The present value VOI was 423
$78,000 (95% CI $70,800–$84,400) in wealth quintile I and $8,900 (95% CI $7,800– 424
$10,000) in quintile V per 100,000 children under-five assuming DPT vaccine coverage 425
levels. Increasing coverage provided additional protection, especially for wealth quintile I. 426
427
Cost and cost-effectiveness
428
The present value cost of including PCV13 at DPT levels at $3.30 per dose was 429
approximately $2.8 million per 100,000, and increasing coverage levels to 90% would 430
increase this cost another $1 million. Extrapolating to the population, the cost is 431
approximately $240 million each year under DPT coverage levels and $328 million under 432
expanded coverage. At $1 per PCV13 dose, a similar cost to the rotavirus vaccine, the 433
respective costs are approximately $112 million and $152 million per year. We estimated the 434
median YLLs and calculated the cost per YLL averted. The incremental cost per YLL averted 435
was $144 under DPT vaccine coverage levels in the base-case, and the incremental cost of 436
expanding coverage was $127. In the sensitivity analysis, the incremental cost per YLL 437
averted was highest when immunity parameters where highest, reaching $518 per YLL 438
23 acceptability curves for all simulations (including all parameter sets). When the willingness 440
to pay per YLL averted, λ, is greater than $228, we estimate that introducing the vaccine 441
(scenario 1 + scenario 2) is almost surely (in more than 95% of our simulations) more cost-442
effective than the baseline scenario. If λ is greater than $325 the extended coverage scenario 443
is almost surely the most cost-effective option. 444
445
DISCUSSION 446
India’s recent decision to integrate the pneumococcal vaccine into its UIP is a response to the 447
high pneumococcal disease burden in the country [5]. The current cost of PCV is relatively 448
high and its effectiveness uncertain given the paucity of information on asymptomatic 449
carriage (the main reservoir of the bacteria), the distribution of IPD-causing serotypes in 450
India [74], and the potential changes to the serotype distribution after vaccine introduction. 451
We examined these issues using an ABM. An ABM is helpful in this context as clinical trials 452
are not feasible for predicting how a mass-vaccination at the population level will affect 453
serotype distribution. To that end, we simulated the effect of introducing the PCV13 vaccine 454
into India accounting for differences in population wealth and access to health services. 455
456
We found that the introduction of PCV13 is likely to reduce the disease burden of S. 457
pneumoniae. The greatest reduction in disease incidence and mortality is predicted to occur in 458
the first few years after the introduction of the vaccine. This result is similar to other 459
countries’ experiences and reflects the significant reduction in the most prevalent serotypes 460
that are linked to the greatest incidence of disease [75–78]. Though colonization levels don’t 461
fall as precipitously, the new colonizing serotypes are assumed to have a lower case-carrier 462
ratio, which results in reductions in disease incidence and mortality. Our estimated percent 463
24 in South Africa [20]. This may be because of our conservative assumption that the vaccine 465
does not explicitly impact disease incidence, but only affects it implicitly by reducing 466
carriage of more fit serotypes. However, other factors contribute to the smaller effect on 467
disease incidence. PCV7 serotypes contributed to a higher percentage of disease incidence in 468
the pre-vaccine era in HICs (and PCV13 in South Africa [20]) than estimates of PCV13 469
serotypes contribute to disease in India [38,65]. The impact of vaccination may be even 470
smaller if the ABM population is not well-mixed—if we assume individuals are more likely 471
to come into contact with others in their household or region (see supplementary appendix). 472
Because the vaccination coverage is heterogeneous in the DPT coverage scenario (according 473
to existing DPT vaccination reported in DLHS-3) there may be unprotected pockets in the 474
population. These pockets provide a reservoir for PCV13 strains and could propagate 475
outbreaks of IPD with those strains. 476
477
The cost of implementing the vaccine is not insignificant, we estimated that it would cost at 478
least $240 million annually, more than double the estimated costs of implementing the 479
rotavirus vaccine that India recently introduced [30]. If PCV13 cost were to drop from $3.30 480
per dose to $1, a similar cost to the rotavirus vaccine and likely closer to the cost of a 481
conjugate vaccine being developed in India, the annual cost would drop to approximately 482
$112 million. However, including the rotavirus vaccine in the UIP was estimated to reduce 483
the disease and financial burden more than PCV13. The rotavirus vaccine was estimated to 484
avert 44,500 deaths assuming DPT coverage [30], while the estimated number of median 485
deaths averted by PCV13 is approximately 34,800 in our base case. 486
487
The estimate of $144 per YLL in the DPT coverage scenario is a range that would be 488
25 with coverage extended to 90% was the most cost-effective option in over ninety-five percent 490
of our bootstrap samples. The cost-effectiveness ratios in our analysis are in line with other 491
projections in low- and middle-income countries studies [24,25,27], but are higher than 492
studies in Uganda (cost-saving at $0.15 per dose) [26] and in Kenya (mean $47 per disability-493
adjusted life year at $3.50 per dose) [28]. In addition to assuming different vaccine costs 494
these studies vary significantly from ours. For example, the study in Uganda does not 495
consider serotype replacement, and the study in the Kenya assumes replacement will be 496
similar to the US. In addition, we assumed the vaccine had no impact on the case-carrier 497
ratio. If we altered that assumption the vaccine’s effectiveness and cost-effectiveness would 498
be greater. 499
500
Our study has a number of limitations. First and foremost, our estimates are uncertain, which 501
is a reflection of the uncertainty in the parameters, particularly the efficacy of the vaccine to 502
reduce the incidence of IPD as well as baseline rates of infection and mortality. Uncertainty is 503
also partially a function of the size of the simulated population, which was ~25,000, with 504
children under five representing 3,000–4,000 members of the population. We chose this 505
population size to focus on a model of serotype dynamics that includes several serotypes. Our 506
analysis does not fully capture the structural uncertainty of the disease model. We vary 507
assumptions on the impact of immunity but maintain a similar model structure across 508
simulations. Additionally, our demographics are based on sampling frameworks of the 509
population. Though representative, they do not fully capture the heterogeneity that exists in a 510
population as large as India. Our model does not currently consider sensitivity to the vaccine 511
dose schedule, and we assume the 2+1 schedule rolled out in India. 512
26 Although the introduction of the PCV13 vaccine in India is likely to reduce the disease
514
burden of S. pneumoniae and is cost-effective, the magnitude of the impact is uncertain. Data 515
collection on pneumococcal carriage, disease, and the prevalent serotypes in India and their 516
virulence needs to be strengthened. Filling these gaps while also increasing understanding of 517
pneumococcal dynamics and reducing reliance on assumptions will improve our ability to 518
project the serotypes likely to emerge and their impact on disease in India after introducing 519
vaccination. Continuing surveillance after India introduces PCV will inform these dynamics 520
as well, enhancing effective resource allocation and the success of future initiatives and 521
course corrections. Though we caution that existing data gaps need to be filled, given our 522
conservative assumptions, the disease and financial burdens averted and the relatively low 523
expected cost per YLL saved makes this an intervention worth pursuing. 524
525
ACKNOWLEDGMENTS 526
We thank Dr. Susmita Chatterjee for her help on the costing of introducing PCV13 in the 527
UIP. We would also like to express our gratitude to Dr. Lalit Kant, Dr. Daniel Weinberger, 528
and Dr. Jyoti Joshi for their comments and suggestions. 529
530
COMPETING INTERESTS 531
All authors have completed the ICMJE uniform disclosure form at 532
www.icmje.org/coi_disclosure.pdf and declare: RL and IM were supported by research grants 533
from the Bill & Melinda Gates Foundation, and RL reports grants from Princeton University 534
Grand Challenges Program for the submitted work; EK received research grants from 535
MedImmune that are unrelated to the current paper; no other relationships or activities that 536
could appear to have influenced the submitted work. 537
27 FUNDING
539
This work was funded by the Bill & Melinda Gates Foundation through the Global Antibiotic 540
Resistance Partnership (GARP) Phase I and II (grant No. OPP1034526) and Building 541
Regional Networks Using the GARP (grant No. OPP1135911), and RL was also supported 542
by Princeton University through its Grand Challenges Program. 543
28 REFERENCES
545 546
1 Wang H, Naghavi M, Allen C, et al. Global, regional, and national life expectancy, all-547
cause mortality, and cause-specific mortality for 249 causes of death, 1980–2015: a 548
systematic analysis for the Global Burden of Disease Study 2015. The Lancet 549
2016;388:1459–544. doi:10.1016/S0140-6736(16)31012-1 550
2 Griffin MR, Zhu Y, Moore MR, et al. U.S. Hospitalizations for Pneumonia after a 551
Decade of Pneumococcal Vaccination. N Engl J Med 2013;369:155–63. 552
doi:10.1056/NEJMoa1209165 553
3 Johnson HL, Deloria-Knoll M, Levine OS, et al. Systematic Evaluation of Serotypes 554
Causing Invasive Pneumococcal Disease among Children Under Five: The 555
Pneumococcal Global Serotype Project. PLOS Med 2010;7:e1000348. 556
doi:10.1371/journal.pmed.1000348 557
4 IVAC. State of PCV use and impact evaluations: a strategic gap analysis of the global 558
evidence from published and ongoing impact studies evaluating routine PCV. Insitutional 559
Vaccine Access Center, Johns Hopkins Bloomberg School of Public Health 2016. 560
http://www.jhsph.edu/research/centers-and-561
institutes/ivac/resources/PCVImpactGapAnalysis_MAR2016_FINAL_public.pdf 562
(accessed 24 Nov 2016). 563
5 Farooqui H, Jit M, Heymann DL, et al. Burden of Severe Pneumonia, Pneumococcal 564
Pneumonia and Pneumonia Deaths in Indian States: Modelling Based Estimates. PLoS 565
One 2015;10:e0129191. doi:10.1371/journal.pone.0129191 566
6 Gupta A, Jp Dadhich. Should Developing Countries Incorporate Pneumococcal and 567
Rotavirus vaccines in their National Immunisation Programmes. WebmedCentral 568
PUBLIC Health 2013;4:WMC004111. 569
7 Vashishtha VM. Pneumococcal Vaccines - The Future. Indian J Pediatr 2015;90:S55–60. 570
8 Glassman A, Cañón O, Silverman R. How to Get Cost-Effectiveness Analysis Right? The 571
Case of Vaccine Economics in Latin America. Value Health 2016;19:913–20. 572
doi:10.1016/j.jval.2016.04.014 573
9 Szeto C, Malhame M, Gehl D, et al. Report to the Board: Ailliance Partnership With 574
India, 2016-2021. GAVI Alliance 2015. http://www.gavi.org/about/governance/gavi-575
board/minutes/2015/2-dec/minutes/08---alliance-partnership-strategy-with-india,-2016-576
2021/ (accessed 24 Nov 2016). 577
10 Edejer TT-T, Baltussen R, Adam T, et al., editors. Making Choices in Health: WHO 578
Guide to Cost-effectiveness Analysis. Geneva, Switzerland: : World Health Organization 579
2003. 580
11 Ray GT, Pelton SI, Klugman KP, et al. Cost-effectiveness of pneumococcal conjugate 581
vaccine: An update after 7 years of use in the United States. Vaccine 2009;27:6483–94. 582
29 12 Silfverdal SA, Berg S, Hemlin C, et al. The cost-burden of paediatric pneumococcal 584
disease in Sweden and the potential cost-effectiveness of prevention using 7-valent 585
pneumococcal vaccine. Vaccine 2009;27:1601–8. doi:10.1016/j.vaccine.2008.12.033 586
13 Hoshi S, Kondo M, Okubo I. Economic evaluation of vaccination programme of 7-valent 587
pneumococcal conjugate vaccine to the birth cohort in Japan. Vaccine 2012;30:3320–8. 588
doi:10.1016/j.vaccine.2012.02.033 589
14 Rozenbaum MH, Sanders E a M, van Hoek AJ, et al. Cost effectiveness of pneumococcal 590
vaccination among Dutch infants: economic analysis of the seven valent pneumococcal 591
conjugated vaccine and forecast for the 10 valent and 13 valent vaccines. BMJ 592
2010;340:c2509. doi:10.1136/bmj.c2509 593
15 Newall AT, Reyes JF, McIntyre P, et al. Retrospective economic evaluation of childhood 594
7-valent pneumococcal conjugate vaccination in Australia: Uncertain herd impact on 595
pneumonia critical. Vaccine 2016;34:320–7. doi:10.1016/j.vaccine.2015.11.053 596
16 Weinberger DM, Malley R, Lipsitch M. Serotype replacement in disease after 597
pneumococcal vaccination. The Lancet 2011;378:1962–73. doi:10.1016/S0140-598
6736(10)62225-8 599
17 Cutts FT, Zaman SM a, Enwere G, et al. Efficacy of nine-valent pneumococcal conjugate 600
vaccine against pneumonia and invasive pneumococcal disease in The Gambia: 601
randomised, double-blind, placebo-controlled trial. Lancet 2005;365:1139–46. 602
doi:10.1016/S0140-6736(05)71876-6 603
18 Klugman KP, Madhi SA, Huebner RE, et al. A trial of a 9-valent pneumococcal 604
conjugate vaccine in children with and those without HIV infection. N Engl J Med 605
2003;349:1341–8. doi:10.1056/NEJMoa035060 606
19 Mackenzie G a, Bottomley C, van Hoek AJ, et al. Efficacy of different pneumococcal 607
conjugate vaccine schedules against pneumonia, hospitalisation, and mortality: re-608
analysis of a randomised trial in the Gambia. Vaccine 2014;32:2493–500. 609
doi:10.1016/j.vaccine.2014.02.081 610
20 von Gottberg A, de Gouveia L, Tempia S, et al. Effects of Vaccination on Invasive 611
Pneumococcal Disease in South Africa. N Engl J Med 2014;371:141111140010002. 612
doi:10.1056/NEJMoa1401914 613
21 Mackenzie GA, Hill PC, Jeffries DJ, et al. Effect of the introduction of pneumococcal 614
conjugate vaccination on invasive pneumococcal disease in The Gambia: a population-615
based surveillance study. Lancet Infect Dis 2016;16:703–11. doi:10.1016/S1473-616
3099(16)00054-2 617
22 Levy C, Cohen R. Long-term surveillance of the effect of PCV13: the future challenge in 618
Africa. Lancet Infect Dis 2016;16:627–9. doi:10.1016/S1473-3099(16)00059-1 619
23 Flasche S, Hoek AJV, Sheasby E, et al. Effect of Pneumococcal Conjugate Vaccination 620
on Serotype-Specific Carriage and Invasive Disease in England: A Cross-Sectional 621
30 24 Saokaew S, Rayanakorn A, Wu DB-C, et al. Cost Effectiveness of Pneumococcal
623
Vaccination in Children in Low- and Middle-Income Countries: A Systematic Review. 624
PharmacoEconomics 2016;34:1211–25. doi:10.1007/s40273-016-0439-3 625
25 Sinha A, Levine O, Knoll MD, et al. Cost-effectiveness of pneumococcal conjugate 626
vaccination in the prevention of child mortality: an international economic analysis. 627
Lancet 2007;369:389–96. doi:10.1016/S0140-6736(07)60195-0 628
26 Tate JE, Kisakye A, Mugyenyi P, et al. Projected health benefits and costs of 629
pneumococcal and rotavirus vaccination in Uganda. Vaccine 2011;29:3329–34. 630
doi:10.1016/j.vaccine.2010.12.122 631
27 Nakamura MM, Tasslimi A, Lieu T a., et al. Cost effectiveness of child pneumococcal 632
conjugate vaccination in middle-income countries. Int Health 2011;3:270–81. 633
doi:10.1016/j.inhe.2011.08.004 634
28 Ayieko P, Griffiths UK, Ndiritu M, et al. Assessment of Health Benefits and Cost-635
Effectiveness of 10-Valent and 13-Valent Pneumococcal Conjugate Vaccination in 636
Kenyan Children. PLoS ONE 2013;8:1–9. doi:10.1371/journal.pone.0067324 637
29 Nandi A, Megiddo I, Prabhakaran D, et al. Meeting Abstracts: An agent-based simulation 638
modelling approach to extended cost-effectiveness analysis of health interventions. The 639
Lancet 2013;381, Suppl:S96. doi:http://dx.doi.org/10.1016/S0140-6736(13)61350-1 640
30 Megiddo I, Colson AR, Nandi A, et al. Analysis of the Universal Immunization 641
Programme and Introduction of a Rotavirus Vaccine in India with IndiaSim. Vaccine 642
2014;32:151–61. doi:10.1016/j.vaccine.2014.04.080 643
31 Nandi A, Colson AR, Verma A, et al. Health and economic benefits of scaling up a 644
home-based neonatal care package in rural India: a modelling analysis. Health Policy 645
Plan 2016;31:634–44. doi:10.1093/heapol/czv113 646
32 Megiddo I, Colson A, Chisholm D, et al. Health and economic benefits of public 647
financing of epilepsy treatment in India: An agent-based simulation model. Epilepsia 648
2016;57:464–74. doi:10.1111/epi.13294 649
33 International Institute for Population Sciences. District Level Household and Facility 650
Survey (DLHS-3) 2007-08. Mumbai, India: : IIPS 2010. http://iipsindia.org/research.htm 651
(accessed 3 Sep 2013). 652
34 Sreeramareddy CT, Sathyanarayana TN, Kumar HNH. Utilization of Health Care 653
Services for Childhood Morbidity and Associated Factors in India: A National Cross-654
Sectional Household Survey. PLoS One 2012;7:e51904. 655
doi:10.1371/journal.pone.0051904 656
35 Geldsetzer P, Williams TC, Kirolos A, et al. The Recognition of and Care Seeking 657
Behaviour for Childhood Illness in Developing Countries: A Systematic Review. PLoS 658
31 36 R Core Team. R: A Language and Environment for Statistical Computing. Vienna,
660
Austria: : R Foundation for Statistical Computing 2015. 661
37 Cobey S, Lipsitch M. Niche and neutral effects of acquired immunity permit coexistence 662
of pneumococcal serotypes. Science 2012;335:1376–80. doi:10.1126/science.1215947 663
38 Jaiswal N, Singh M, Das RR, et al. Distribution of Serotypes, Vaccine Coverage, and 664
Antimicrobial Susceptibility Pattern of Streptococcus Pneumoniae in Children Living in 665
SAARC Countries: A Systematic Review. PLoS One 2014;9:e108617. 666
doi:10.1371/journal.pone.0108617 667
39 Lipsitch M, Dykes JK, Johnson SE, et al. Competition among Streptococcus pneumoniae 668
for intranasal colonization in a mouse model. Vaccine 2000;18:2895–901. 669
doi:10.1016/S0264-410X(00)00046-3 670
40 Lipsitch M, Abdullahi O, D’Amour A, et al. Estimating rates of carriage acquisition and 671
clearance and competitive ability for pneumococcal serotypes in Kenya with a Markov 672
transition model. Epidemiol Camb Mass 2012;23:510–9. 673
doi:10.1097/EDE.0b013e31824f2f32 674
41 Jebaraj R, Cherian T, Raghupathy P, et al. Nasopharyngeal colonization of infants in 675
southern India with Streptococcus pneumoniae. Epidemiol Infect 1999;123:383–388. 676
doi:null 677
42 Coles CL, Rahmathullah L, Kanungo R, et al. Nasopharyngeal carriage of resistant 678
pneumococci in young South Indian infants. Epidemiol Infect 2002;129:491–497. 679
doi:10.1017/S0950268802007586 680
43 Jain A, Kumar P, Awasthi S. High nasopharyngeal carriage of drug resistant 681
Streptococcus pneumoniae and Haemophilus influenzae in North Indian schoolchildren. 682
Trop Med Int Health 2005;10:234–9. doi:10.1111/j.1365-3156.2004.01379.x 683
44 Wattal C, Oberoi JK, Pruthi PK, et al. Nasopharyngeal carriage of Streptococcus 684
pneumoniae. Indian J Pediatr 2007;74:905–7. doi:10.1007/s12098-007-0166-z 685
45 Dhakal R, Sujatha S, Parija SC, et al. Asymptomatic colonization of upper respiratory 686
tract by potential bacterial pathogens. Indian J Pediatr 2010;77:775–8. 687
doi:10.1007/s12098-010-0118-x 688
46 Bhattacharya S Das, Niyogi SK, Bhattacharyya S, et al. High rates of colonization with 689
drug resistant hemophilus influenzae type B and Streptococccus Pneumoniae in 690
unvaccinated HIV infected children from West Bengal. Indian J Pediatr 2011;78:423–9. 691
doi:10.1007/s12098-010-0310-z 692
47 Devi U, Ayyagari A, Devi KR, et al. Serotype distribution & sensitivity pattern of 693
nasopharyngeal colonizing Streptococcus pneumoniae among rural children of eastern 694
32 48 Rupa V, Isaac R, Jalagandeeswaran R, et al. Epidemiology of nasopharyngeal
696
colonization by S. pneumoniae in Indian infants in the first 2 years of life. Int J Pediatr 697
Otorhinolaryngol 2014;78:1701–6. doi:10.1016/j.ijporl.2014.07.024 698
49 Kumar KLR, Ashok V, Ganaie F, et al. Nasopharyngeal carriage, antibiogram & serotype 699
distribution of Streptococcus pneumoniae among healthy under five children. Indian J 700
Med Res 2014;140:216–20. 701
50 Adegbola R a, DeAntonio R, Hill PC, et al. Carriage of Streptococcus pneumoniae and 702
other respiratory bacterial pathogens in low and lower-middle income countries: a 703
systematic review and meta-analysis. PloS One 2014;9:e103293. 704
doi:10.1371/journal.pone.0103293 705
51 Högberg L, Geli P, Ringberg H, et al. Age- and Serogroup-Related Differences in 706
Observed Durations of Nasopharyngeal Carriage of Penicillin-Resistant Pneumococci. J 707
Clin Microbiol 2007;45:948–52. doi:10.1128/JCM.01913-06 708
52 Gray BM, Converse GM, Dillon HC. Epidemiologic Studies of Streptococcus 709
pneumoniae in Infants: Acquisition, Carriage, and Infection during the First 24 Months of 710
Life. J Infect Dis 1980;142:923–33. doi:10.1093/infdis/142.6.923 711
53 World Health Organization. WHO | Estimated Hib and pneumococcal deaths for children 712
under 5 years of age, 2008. WHO. 713
2008.http://www.who.int/immunization/monitoring_surveillance/burden/estimates/Pneu 714
mo_hib/en/ (accessed 8 Jan 2015). 715
54 O’Brien KL, Wolfson LJ, Watt JP, et al. Burden of disease caused by Streptococcus 716
pneumoniae in children younger than 5 years: global estimates. The Lancet 717
2009;374:893–902. doi:10.1016/S0140-6736(09)61204-6 718
55 Fischer Walker CL, Rudan I, Liu L, et al. Global burden of childhood pneumonia and 719
diarrhoea. The Lancet 2013;381:1405–16. doi:10.1016/S0140-6736(13)60222-6 720
56 Johnson HL, Bassani DG, Perin J, et al. Burden of childhood mortality caused by 721
Streptococcus pneumoniae in India. 2012.http://www.jhsph.edu/research/centers-and-722
institutes/ivac/resources/isppd8/H_Johnson-723
Burden_of_Child_Mortality_by_Strep_Pneumo_in_India.pdf (accessed 14 Aug 2015). 724
57 Government of India. National Sample Survey 71st Round. New Delhi: : Ministry of 725
Statistics and Programme Implementation (MOSPI) 2015. 726
http://online.wsj.com/public/resources/documents/IndiaHealthCost.pdf (accessed 17 May 727
2017). 728
58 Portnoy A, Jit M, Lauer J, et al. Estimating costs of care for meningitis infections in low- 729
and middle-income countries. Vaccine 2015;33, Supplement 1:A240–7. 730
doi:10.1016/j.vaccine.2014.11.061 731
59 Tasslimi A, Nakamura MM, Levine O, et al. Cost effectiveness of child pneumococcal 732
conjugate vaccination in GAVI-eligible countries. Int Health 2011;3:259–69. 733
33 60 Madsen HO, Hanehøj M, Das AR, et al. Costing of severe pneumonia in hospitalized 735
infants and children aged 2–36 months, at a secondary and tertiary level hospital of a not-736
for-profit organization. Trop Med Int Health 2009;14:1315–22. doi:10.1111/j.1365-737
3156.2009.02374.x 738
61 Peasah SK, Purakayastha DR, Koul PA, et al. The cost of acute respiratory infections in 739
Northern India: a multi-site study. BMC Public Health 2015;15:330. doi:10.1186/s12889-740
015-1685-6 741
62 Van Effelterre T, Moore MR, Fierens F, et al. A dynamic model of pneumococcal 742
infection in the United States: implications for prevention through vaccination. Vaccine 743
2010;28:3650–60. doi:10.1016/j.vaccine.2010.03.030 744
63 Karlsson D. Probabilistic network modelling of the impact of penicillin consumption on 745
spread of pneumococci. Epidemiol Infect 2011;139:1351–60. 746
doi:10.1017/S0950268810002773 747
64 Goyal R, Singh N, Kaur M, et al. Antimicrobial resistance in invasive and colonising 748
streptococcus pneumoniae in north India. Indian J Med … 2007;:256–60. 749
65 Manoharan A, Manchanda V, Balasubramanian S, et al. Invasive pneumococcal disease 750
in children aged younger than 5 years in India: a surveillance study. Lancet Infect Dis 751
Published Online First: 2017. doi:10.1016/S1473-3099(16)30466-2 752
66 Rinta-Kokko H, Dagan R, Givon-Lavi N, et al. Estimation of vaccine efficacy against 753
acquisition of pneumococcal carriage. Vaccine 2009;27:3831–7. 754
doi:10.1016/j.vaccine.2009.04.009 755
67 Wattal C, Oberoi JK, Pruthi PK, et al. Nasopharyngeal carriage of Streptococcus 756
pneumoniae. Indian J Pediatr 2007;74:905–7. doi:10.1007/s12098-007-0166-z 757
68 Dhakal R, Sujatha S, Parija SC, et al. Asymptomatic colonization of upper respiratory 758
tract by potential bacterial pathogens. Indian J Pediatr 2010;77:775–8. 759
doi:10.1007/s12098-010-0118-x 760
69 Kouyos R, Klein E, Grenfell B. Hospital-Community Interactions Foster Coexistence 761
between Methicillin-Resistant Strains of Staphylococcus aureus. PLoS Pathog 762
2013;9:e1003134. doi:10.1371/journal.ppat.1003134 763
70 Pramanik S, Muthusamy N, Gera R, et al. Small area estimation of vaccination coverage 764
rates by combining time series and cross sectional data. Elsevier Ltd 2015. 765
doi:10.1016/j.vaccine.2015.01.083 766
71 World Health Organization. WHO-UNICEF guidelines for developing a comprehensive 767
multi-year plan (cMYP). WHO. 768
2015.http://www.who.int/immunization/programmes_systems/financing/tools/cmyp/en/ 769
(accessed 14 Nov 2015). 770
72 Rudan I, O’Brien KL, Nair H, et al. Epidemiology and etiology of childhood pneumonia 771
34 causative pathogens for 192 countries. J Glob Health 2013;3.
773
doi:10.7189/jogh.03.010401 774
73 Verguet S, Laxminarayan R, Jamison DT. Universal public finance of tuberculosis 775
treatment in India: An extended cost-effectiveness analysis. Health Econ 2014;24:318– 776
32. doi:10.1002/hec.3019 777
74 Kanungo R. Knowledge of serotype prevalence & burden of invasive pneumococcal 778
disease: a prerequisite to vaccine introduction in the country. Indian J Med Res 779
2015;142:241–4. doi:10.4103/0971-5916.166528 780
75 Pilishvili T, Lexau C, Farley MM, et al. Sustained Reductions in Invasive Pneumococcal 781
Disease in the Era of Conjugate Vaccine. J Infect Dis 2010;201:32–41. 782
76 Moore MR, Whitney CG. Use of Pneumococcal Disease Epidemiology to Set Policy and 783
Prevent Disease during 20 Years of the Emerging Infections Program. 2015;21. 784
77 Ben-Shimol S, Greenberg D, Givon-Lavi N, et al. Early impact of sequential introduction 785
of 7-valent and 13-valent pneumococcal conjugate vaccine on IPD in Israeli children <5 786
years: An active prospective nationwide surveillance. Vaccine 2014;32:3452–9. 787
doi:10.1016/j.vaccine.2014.03.065 788
78 Rodenburg GD, de Greeff SC, Jansen AGCS, et al. Effects of pneumococcal conjugate 789
vaccine 2 years after its introduction, the Netherlands. Emerg Infect Dis 2010;16:816–23. 790
doi:10.3201/eid1605.091223 791
35 FIGURE LEGENDS
794
Figure 1. Pneumococcal Disease Cases (base-case)
795
Median pneumococcal disease incidence by year for 5,000 bootstrap samples using base-case 796
parameters. The line representing the no vaccination scenario is the median across all years. The 797
shaded areas represent the 95% CI for each year. The vertical lines with arrows and the 798
corresponding values are the median cases averted after year 5, and the values in parentheses are 799
the 95% CIs. 800
801
Figure 2. Sensitivity to immunity parameters
802
Sensitivity of pneumococcal disease cases, including non-severe and severe pneumococcal 803
pneumonia, pneumococcal meningitis, and other invasive pneumococcal infections, to immunity 804
parameters over 5,000 bootstrap samples. Panel (A) shows estimated cases averted per year for each 805
parameter set. It is calculated by subtracting the median cases in scenario 1 and median cases in 806
scenario 2 from the median cases in the no vaccination scenario for each bootstrap sample. Dots and 807
triangles are the predictions and line ranges are the 95% CIs. The other panels show serotype 808
replacement over time; plotted values are the medians for each year. Panel (B) shows the percent 809
reduction in vaccine type cases of pneumococcal disease and (C) the percent increase in non-vaccine 810
type pneumococcal cases after the introduction of PCV13 to 90% of the population (scenario 2). 811
ϵ: Serotype-independent immunity shape parameter (see equation 4). 812
σ: Anticapsular (serotype-specific) immunity parameter (see equation 1). 813
814
Figure 3. Cost-effectiveness acceptability curves
815