Technique for the measurement of picosecond
optical pulses using a non-linear fiber loop
mirror and an optical power meter
UMAIR A. KORAI,
1,2,*ZIFEI WANG,
3COSIMO LACAVA,
4LAWRENCE R.
CHEN,
3IVAN GLESK,
1AND MICHAEL J. STRAIN
51Department of Electronic and Electrical Engineering, University of Strathclyde, Glasgow G1 1XW, UK 2Department of Telecommunication Engineering, Mehran University of Engineering and Technology, Jamshoro 72060, Pakistan
3Department of Electrical and Computer Engineering, McGill University, Montreal H3A 0E9, Canada 4Optoelectronics Research Centre, University of Southampton, Southampton SO17 1BJ, UK
5Institute of Photonics, Dept. of Physics, University of Strathclyde, Glasgow G1 1RD, UK
Abstract: A method for measuring picosecond pulse width by using only fiber components and optical power meters is presented. We have shown that the output power splitting ratio of a non-linear fiber loop mirror can be used to extract the full-width half maximum of the optical pulse, assuming a known slowly varying envelope shape and internal phase structure. Theoretical evaluation was carried out using both self-phase and cross-phase modulation approaches, with the latter showing a twofold sensitivity increase, as expected. In the experimental validation, pulses from an actively fiber mode-locked laser at the repetition rate of 10 GHz were incrementally temporally dispersed by using SMF–28 fiber, and then successfully measured over a pulse width range of 2–10 ps, with a resolution of 0.25 ps. This range can be easily extended from 0.25 to 40 ps by selecting different physical setup parameters.
© 2019 Optical Society of America under the terms of the OSA Open Access Publishing Agreement
1. Introduction
The efficient generation of ultra-short laser pulses in the picosecond regime has enabled a wide range of applications from optical communications [1] to the measurement of ultra-fast physical processes [2]. In order to measure the characteristics of picosecond optical fields, a number of techniques have been developed including frequency resolved optical gating (FROG) [3–5], spectral phase interferometry for direct electric-field reconstruction of ultra-short optical pulses (SPIDER) [6,7] and sonogram [8,9]. Some modified versions of FROG have also been reported using cross phase modulation and four wave mixing for the full characterization of an optical pulse [10,11]. In addition to these non-linear methods, there are a number of linear self referencing methods, for example, phase reconstruction using optical ultrafast differentiation (PROUD), that avoid the requirement of high pump powers and provide a complete pulse characterization [12–14]. These methods allow for the full amplitude and phase reconstruction of the pulse. Compact methodologies based on on-chip technologies have also been demonstrated making use of highly non-linear optical waveguide technology [15,16]. In general, ultra-short pulse measurement techniques either require high pulse energies or expensive measurement equipment such as optical spectrometers in order to operate.
All optical performance monitoring is crucial for achieving stable optical networks, in particular with regards to the effects of dispersion. There are several parameters that can alter the dispersion of an optical link, i.e. temperature, path reconfiguration or physical maintenance around the fiber site [17]. Also, in some applications, for example in optical networks or in cases where well-behaved optical pulses are used as a temporal probe, it is
#354719 https://doi.org/10.1364/OE.27.006377
often enough to monitor the temporal envelope of the pulse to allow compensation of any dispersion that may be induced between the laser source and the monitor point. High-speed photodetectors and sampling oscilloscopes, intensity auto-correlators or cross-correlators can be used in laboratory environments for this purpose.
In this manuscript, we present an alternative method which uses a fiber amplifier, non-linear optical fiber loop mirror (NOLM) [18] and optical power meters. Since the system is implemented in an all-fiber configuration, with no moving parts or complex measurement equipment, it can be implemented as a simple system bolt-on, or in remote locations with the potential for distributed arrays of monitors across networks. Unlike optical sampling oscilloscopes and optical auto-correlators, this method does not monitor the shape of the optical pulses but only their temporal width; hence, it can also be used to monitor the residual dispersion of the optical link [17].
Design of the method was carried out using simulations of the non-linear Schrodinger equation(s) using well-defined split step method [19]. From simulations we found that this method is compatible with well-behaved pulses with slowly varying envelopes such as sech2
or Gaussian. The measurement range is related to the non-linear phase shift introduced by the measured signal (its peak power can be boosted by using an erbium-doped fiber amplifier (EDFA) up to its saturated output power) and to the length of the non-linear medium and its non-linear coefficient. In this work, pulse widths up to 10 ps are measured, with a resolution of 0.25 ps, assuming a sech2 or Gaussian pulse envelope with slowly varying phase internal
structure. The measurement range can be extended to cover 0.25 to 40 ps by careful selection of the physical parameters in the setup.
The remainder of this paper is organized as follows: Section 2 describes the highly non-linear fiber (HNLF) based NOLM pulse width measurement scheme and the simulated model using the split-step method for both, self-phase and cross-phase modulation variations. Section 3 presents the experimental realization of the scheme with results and analysis presented in section 4. Device limitations and discussion are presented in section 5 and finally conclusions are presented in section 6.
2. Picosecond pulse width measurement using non-linear optical loop mirror
As noted in the introduction, the method presented here relies on the assumption that the optical picosecond pulses under investigation are of a simple form with typically a sech2 or
Gaussian shape and little internal phase structuring. The purpose of this method is to provide a means to monitor pulse width variation induced, for example by dispersion between the pulse origin and monitor point. We present two variations of the measurement technique, both based on a 3
χ optical non-linearity process in a NOLM (see Fig. 1). In both approaches optical pulses are coupled to the NOLM and the resulting average power at its output ports is measured using a slow optical power meters. The ratio 1
2 out
out P
P of the measured average output
powers is a function of the optical switching induced by either self-phase or cross-phase modulation depends on the peak power of a laser pulse injected into the NOLM. For well-behaved pulses, the peak power is simply related to average power through the envelope shape and pulse train duty cycle. In order to over-sample the measurement, the input pulses are incrementally amplified by an erbium doped fiber amplifier (EDFA) to produce a series of power splitting ratios as a function of the measured average power of the input pulse train.
carried out to demonstrate the performance of the system under these constraints. However, the achievable pulse width measurement range of the method can be tuned by varying the setup components, discussed in more detail in section 5.
Table 1. HNLF simulation parameters.
Parameter Value Unit
Length (LHNLF) 100 m
Gamma (
γ
) 10.8 (W km)−1Dispersion (D) 0.11 ps/nm/km
Dispersion slope (S) 0.016 ps/nm2/km
Absorption coefficient (α) 0.9 dB/km
Splice Loss (HNLF to SMF28) 0.2 dB
2.1. Self-phase modulation
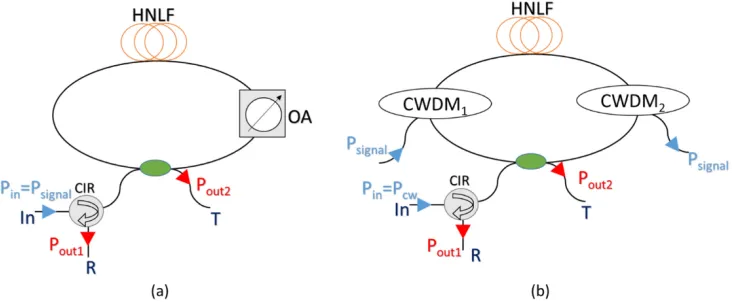
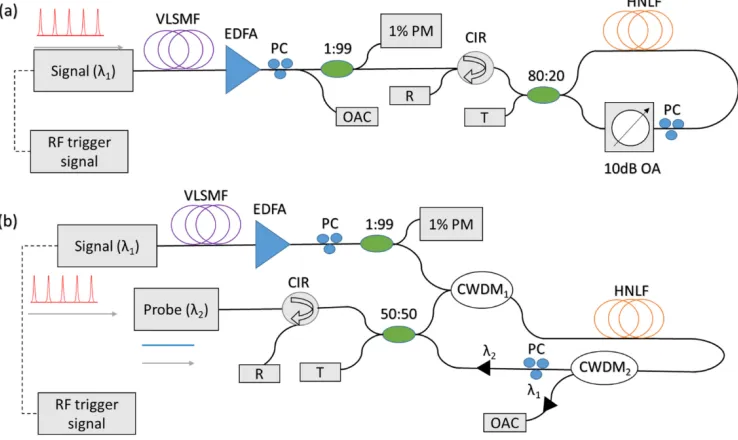
Figure 1(a) shows the self-phase modulation (SPM) variant of the scheme. In this case, the amplified pulse train (Psignal) is coupled in to one port of the NOLM, where the coupler ratio is
unbalanced (80:20) in order to create asymmetry in the counter-propagating modes. An additional optical attenuator (10 dB) is added to the loop to give control of this imbalance. The higher power replica of the pulse undergoes SPM in the HNLF creating a phase shift between the replicas as they recombine at the output coupler.
The proportion of the total power coupled to each port is dependent on the relative phase between the two pulse replicas, and their relative powers:
1 1 2 2 out out in out P n P P P n = =
(1)
where,
2 1 L (1 ) (1 NL)
j j
n e p p e e
π θ φ
= − + (2)
2 L( jNL (1 ))
n =eφ peθ − −p (3)
L
φ includes the linear phase shift and linear loss and can be computed as φL = j Lβ HNLF –αLHNLF,β
is the propagation constant of the field in the optical fiber, αis the linear absorption loss, pis
the splitting ratio of the input coupler, and LHNLF is the length of the HNLF. θNLis the
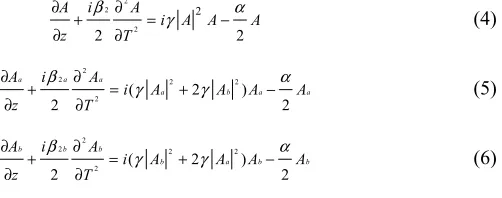
non-linear phase shift and is proportional to the input power. The Eqs. (2) and (3) are modified from [21] due to the inclusion of a coarse wavelength division multiplexer (CWDM) coupler to inject the amplified pulse train into the loop mirror. The non-linear phase shift can be computed by numerically solving the non-linear Schrodinger equation(s), (4) for SPM and (5) and (6) for XPM, using the split step method where the non-linear phase shift induced by cross phase modulation (XPM) is approximately twice that accumulated through SPM [19].
2 2
2 2
2 2
A i A
i A A A
z T
β α
γ
∂ ∂
+ = −
∂ ∂ (4)
2
2 2 2
2 ( 2 )
2 2
a a a
a b a a
A i A
i A A A A
z T
β α
γ γ
∂ ∂
+ = + −
∂ ∂ (5)
2
2 2 2
2 ( 2 )
2 2
b b b
b a b b
A i A
i A A A A
z T
β α
γ γ
∂ ∂
+ = + −
[image:3.612.229.480.573.672.2]Where, the subscript ‘a’ shows the high power signal parameters and ‘b’ shows the low power continuous wave probe signal. A( , )a b is the slowly varying amplitude of the pulse
envelope, β2 ( , )a b is the group velocity dispersion, ( ) , a b
γ is the non-linear coefficient, λ( , )a b is the
operating wavelength and αis the linear loss of the waveguide. The values of all the above parameters are summarized in Table 1. The splice loss and the absorption has already included in the experimental results; hence both are not included in the simulations.
The effect of counter propagating non-linear interactions in the NOLM can be significant when using high repetition rate signals [20], hence the total effective non-linear phase shift using SPM and XPM, by taking the counter clockwise non-linear phase shift into account, can be calculated using Eq. (7).
_ _
eff cw NL ccw NL
θ θ θ
Δ = − (7)
Where Δθeffis the total effective phase shift, θcw_NL is the non-linear phase shift produced in the
clockwise direction and θccw NL_ is the non-linear phase shift produced in counter-clockwise
[image:4.612.124.491.298.451.2]direction due to XPM.
Fig. 1. Non-linear optical loop mirror (a) in self phase modulation configuration; (b) in cross phase modulation configuration using CWDM couplers for injecting and filtering out the pulsed signal. Where OA – optical attenuator, CWDM – course wavelength division multiplexing/de-multiplexer, CIR – optical circulator, and HNLF – highly non-linear fiber
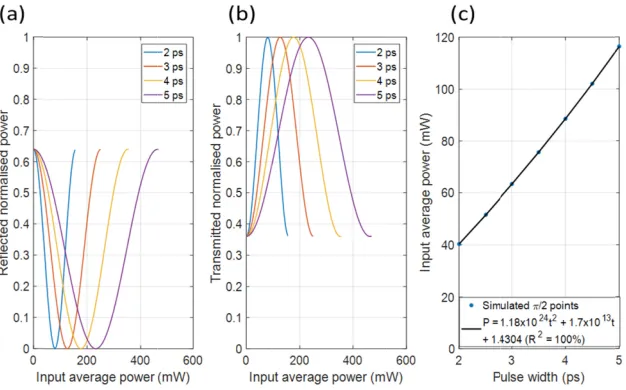
Figures 2(a) and 2(b) shows the normalized reflected power (Pout1) at the reflected port (R)
and transmitted power (Pout2) at transmitted port (T) of NOLM plotted as a function of the
input average power (Pin), with the pulse width as a parameter. An optical circulator (CIR) is
used for separating the input and output reflected power of the NOLM. A sech2 pulse
envelope is assumed in this case. The output powers follow sinusoidal variations as a function of the input average power for a given input pulse width, with maximum and minimum values defined by the asymmetric coupling fraction of the input/output coupler. The input average power inducing a π/2 phase-shift results switching of power between R and T ports of the NOLM and subsequently can be used to extract the pulse width from measurements of the power splitting between R and T ports as a function of Pin, as shown in Fig. 2(c). The
Fig. 2 input power
2.2. Cross-p
With a minor significantly e as a probe of t in to one inpu direction usin propagating m In order to av second CWDM
The avera (2), and (3), w entering peak relative phase using Eq. (7) powers of the widths. As ex as compared setup.
2. Simulated NOL average power of r at π/2 switching p
phase modula
modification o enhanced. Figu the loop non-li ut port of NOL ng a CWDM. modes, inducin void cross-talk M, before reac age output pow
where in this c k power (Psignal),
e shift between ). Figures 3(a) e probe as a fun xpected, the π/2 to the SPM. F
LM output power f the signal for diff points as a functio
tion
of the setup in ure 1(b) shows inearity in a XP LM and the pu
The probe sig ng a relative ph
at the detector ching the outpu wer at the port
case the non-li with the signa n clockwise an and 3(b) sho nction of input 2 switching po Figure 3(c) sho
at (a) reflected, (b ferent pulse width on of pulse width.
Fig. 1(a), the s a setup that in
PM scheme. In ulse train is ad nal experience hase shift betw rs, the pulse tra ut coupler.
T and R, resp near phase shi al pulse width a nd counter-clo w the normali t average powe oints are reache ows the quadra
b) transmitted por hs using SPM. (c)
sensitivity of t ncludes a seco n this case, the dded to travel t es strong XPM ween the mode
ain is coupled
pectively can b ift is directly p as a parameter. ockwise signal ized transmitte er of the pulse ed at half the p atic fit of the π
rt as a function of The input average
the SPM schem ondary CW las
probe signal i the NOLM on M in one of the
es at the output out of the loop
be calculated u proportional to
. As before, the ls is taken into ed and reflecte train for differ power in the X
π/2 points for
f e
me can be ser source s coupled nly in one e counter t coupler. p, using a
[image:5.612.150.463.97.292.2]Fig. 3 input power
2.3. Effect of
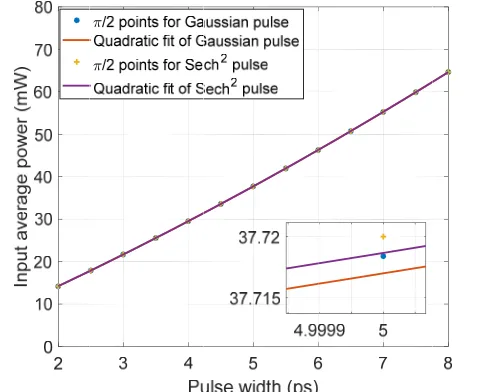
The XPM sim switching poi obtained sech meaning that measurement Fig. 4 input 3. Experime Schematics o NOLM based Inc. mode-loc
3. Simulated NOL average power of r at π/2 points as a
f pulse envelo
mulations were ints as a functi h2 case in Fig.
t calibration o of both envelo
4. Quadratic fitted pulse width.
ental setup fo
f the experime d on SPM and cked fiber lase
LM output power a f the signal for diff a function of pulse
ope function
e then perform ion of the laser
4. There is no of the experim ope types with
d π/2 points for bo
or measurem
ental setups us XPM are show er running at a
at: (a) reflected, (b ferent pulse widths width of the signa
med for a Gau r pulse width a t a noticeable mental setup w
the same accur
oth Gaussian and
ment of pulse
sed for measur wn in Figs. 5(a a 10 GHz rep
b) transmitted por s using XPM. (c) al and their fitting.
ussian pulse en and are compa
difference betw with either pul
racy.
sech2 pulse shape
e width
rement of opti a) and 5(b), re petition rate w
rt as a function of The input average .
nvelope, wher ared with the p ween those tw lse shape wou
es as a function of
ical pulse wid espectively. Th was used as a s
f e
[image:6.612.141.465.91.291.2] [image:6.612.184.430.416.612.2]picosecond optical pulses, referred here as the signal. The central wavelength of the signal was 1550.7 nm with a spectral bandwidth of 1.4 nm. The signal was amplified using an EDFA limited to a saturated output power of 50 mW (17 dBm). The input pulse width variation was achieved by using serially coupled lengths of SMF28 patchcord cables to disperse the signal. For the XPM setup, a low power continuous wave (CW), referred to here as the probe, was generated using Agilent 81989A tunable laser at the wavelength of 1530 nm with a power of 5 mW. A 1% power tap was introduced before the NOLM for an input average power monitoring of the signal by a temperature stable Agilent 8153A Lightwave Multimeter. The probe was then injected into the NOLM via a 50:50 optical directional coupler and the signal via CWDM1 coupler (see Fig. 5(b)). The two polarization controllers
(PC) used in the setup were set to maximize the power coupled to the reflected port in the linear regime. Once the state of PCs was set, it was not altered for any of the subsequent measurements. The passband of the CWDM1 coupler is 1541 to 1559 nm. The signal after
traveling HNLF of length (LHNLF) was subsequently filtered out of the loop using CWDM2
[image:7.612.122.491.315.535.2]coupler with the passband of 1542 to 1558 nm. The transmitted and reflected average power of the probe were measured at T and R ports, respectively as indicated in Fig. 5(b). The pulse width of the signal was measured using a FR-103XL optical auto-correlator before entering in to the NOLM.
Fig. 5. Experimental setup for optical pulse width measurement using NOLM based on: (a) SPM and (b) XPM, respectively. Where, PM – power meter, CIR – optical circulator, OAC – optical auto-correlator, EDFA – erbium doped fiber amplifier, PC – polarization controller, CWDM – course wavelength division multiplexer/de-multiplexer, HNLF – highly non-linear fiber, OA – optical attenuator, VLSMF – variable length single mode fiber, R – reflected port, T – transmitted port.
4. Experimental results
4.1. NOLM based on self-phase modulation configuration
a function of the Pin, for the case of a 2 ps pulse. Since the simulated curves show sinusoidal
dependence on the input average power, hence the measured transmitted and reflected data was fitted to (8) and (9), respectively, where A, B, C, and D are free parameters. This fitting then allows extraction of the π/2 point.
.sin( . )
OTX in
P =A B P +C −D (8)
1 ORX OTX
[image:8.612.172.476.149.316.2]P = −P (9)
Fig. 6. The normalized reflected and transmitted NOLM output power based on SPM measurements showing a sinusoidal fit using (8) and (9) to extract the π/2 point
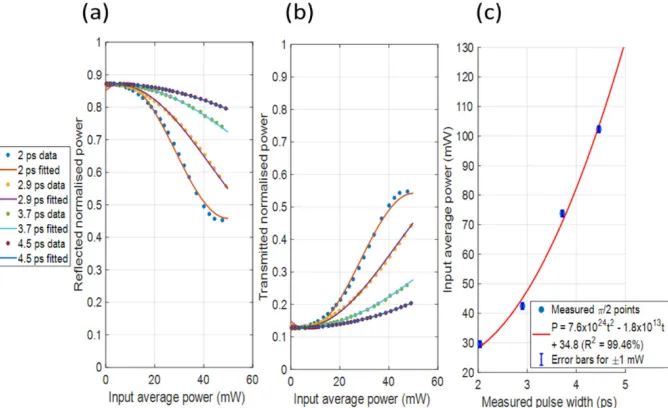
The experimentally measured and fitted transmission and reflection powers of the NOLM obtained for up to a 50 mW of the input average optical power are shown in Figs. 7(a) and 7(b), respectively. A 10 dB optical attenuator is used in the counter clockwise direction in order to suppress the power of signal hence the signal power in the 20% arm is not enough to produce the non-linearity. For wider pulses, the π/2 points were not accessible experimentally due to limited available EDFA saturated power, hence the fitting curves based on (8) and (9) were used to obtain the π/2 points. Figure 7(c) shows the input average power at π/2 points and the quadratic fitting. The measured curves show good agreement with the simulations and a clear dependence on the input pulse width.
[image:8.612.140.474.457.661.2]width values. (c) Input average power at π/2 points as a function of the signal pulse showing the quadratic fitting.
4.2. NOLM based on cross phase modulation configuration
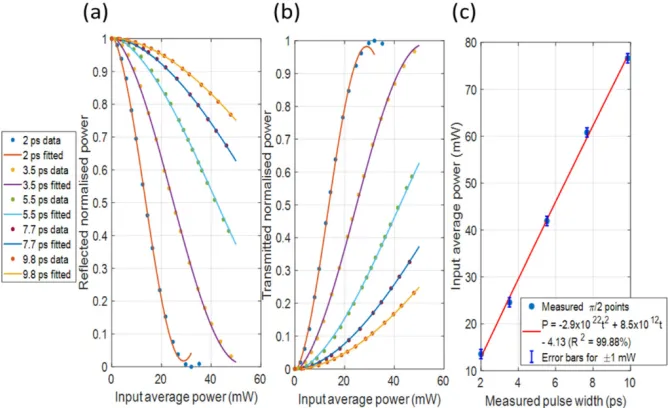
The experimental setup for optical pulse width measurements using the NOLM based on XPM configuration is shown in Fig. 5(b). Similarly, as before, five different pulse widths were generated from the initial 2 ps FWHM pulses. Again, the measured data were fitted to a sinusoidal function described by using (8) and (9). The 2ps pulse data were only fitted up to the π/2 point, as after this the switching exhibited some saturation.
[image:9.612.139.473.236.440.2]The normalized transmission and reflection output powers of the XPM based NOLM are shown in Figs. 8(a) and 8(b), respectively. The input average power of the signal at π/2 points and the quadratic fitting is shown in Fig. 8(c).
Fig. 8. Measured: (a) reflected, (b) transmitted output power of the NOLM on XPM configuration as a function of the input average power of the signal obtained for different pulse widths values. (c) Input average power at π/2 points as a function of the signal pulse showing quadratic fitting.
As predicted by the theory, the sensitivity of the XPM is doubled compared with the SPM case, thus allowing more efficient pulse width measurements. We measured the input average optical power of the signal with an accuracy of ± 1 mW, that together with the R2 = 99.88%
of the quadratic fit, gives a predicted pulse width resolution of ~0.25 ps.
5. Device limitations and discussion
In order to characterize the temporal width of an optical pulse, the setup described above is required to define the π/2 switching point with respect to the average power of the signal. This therefore puts a limitation on the measurement range of the system that depends on the available saturation power of the EDFA and the length of non-linear fiber in the loop. As stated above, the accuracy of the measurement is limited by the accuracy of measuring the input average power from power meter and the linearity of the fitted calibration curve. Assuming the dispersion length is higher than the non-linear length, the non-linear phase shift for XPM is given as:
2 av eff XPM
P TL
γ φ
τ
where γ is the non-linear coefficient, Pavis the input average power, Tis the laser repetition
period, τ is the pulse width of the laser signal, and Leffis the effective length of the HNLF
fiber given as 1 exp( HNLF) eff
L
L α
α
− −
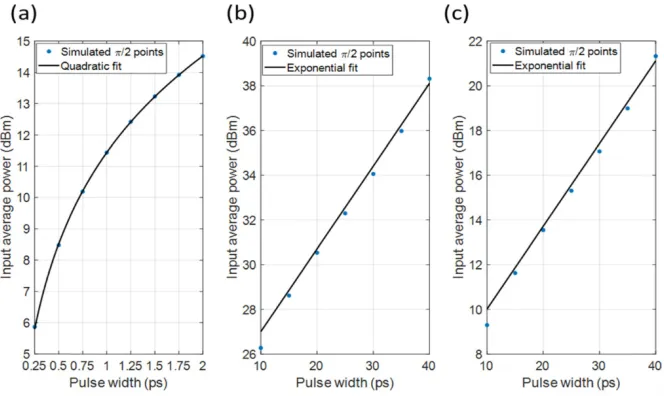
= [19]. Considering (10), it is clear that the operation range for measuring an optical pulse width can be extended by maximizing any or all of listed parameters. By using XPM simulations the dynamic range of the measurement system was estimated for practically achievable lower and upper limits for the following parameters. HNLF lengths were considered with the lower limit as LHNLF = 20 m and LHNLF = 1 km as the
upper limit. We also considered a maximum available EDFA saturated output power ~40 dBm. The results of these simulations are summarized in Fig. 9.
From Fig. 9(a) we can see that the minimum pulse width that could be measured with the hardware is 250 fs and can be achieved using LHNLF = 50 m and 15 dBm EDFA. As mentioned
above, the resolution of this method is 0.25 ps, hence by using this hardware, the minimum possible pulse width can be measured as 250 fs. However, the device range can be extended to measure optical pulse widths well beyond 10 ps FWHM. If using LHNLF = 20 m and 38 dBm
EDFA or LHNLF = 1 km and 21 dBm EDFA the device can be used to measure an optical pulse
[image:10.612.139.471.396.594.2]within the region of 10 – 40 ps as shown in Figs. 9(b) and 9(c), respectively. For pulses longer than 40 ps, the accumulated non-linear phase on the counter-propagating signal is significant, limiting the measureable effective non-linear phase shift of the system, highlighting the significant role of the repetition rate in this scheme. The device can be also easily reconfigured for pulse width measurements beyond a 40 ps range, by lowering the repetition rate, however for this regime, high speed electronics may be a more attractive option.
Fig. 9. Device parameters selection. (a) pulse width measurements below 2 ps:LHNLF = 50m, EDFA saturated output 15 dBm; pulse width measurements below 100 ps: (b)LHNLF = 20 m,
EDFA saturated output 38 dBm or (c)LHNLF = 1 km, EDFA saturated power 21 dBm.
6. Conclusion
applicable where Gaussian or sech2 pulse envelopes can be assumed and the internal phase
structure is slowly varying (for example in dispersive communications links). Pulses in the range of 2–10ps were successfully characterized experimentally. The dynamic range of the proposed method is limited by available hardware, with realistic limits of 250 fs to 40 ps. The method may find its use in distributed networks or as a bolt-on to optical systems using ultra-short pulse sources. This fiber device can be also implemented as an integrated non-linear Sagnac or Mach-Zehnder interferometer using integrated optical platforms, including silicon on insulator (SOI), where mode volumes can be small and non-linear coefficients can be very high, i.e. 307 (Wm)−1, potentially leading to improvements in device miniaturization, stability
and power [22].
Funding
Commonwealth Scholarship Commission United Kingdom (CSC – PKCA-2016-90); European Union Horizon 2020 research and innovation program under the Marie Skłodowska-Curie Grant (734331); Natural Sciences and Engineering Research Council of Canada.
References
1. G. Roelkens, U. Dave, A. Gassenq, N. Hattasan, Chen Hu, B. Kuyken, F. Leo, A. Malik, M. Muneeb, E. Ryckeboer, D. Sanchez, S. Uvin, R. Wang, Z. Hens, R. Baets, Y. Shimura, F. Gencarelli, B. Vincent, R. Loo, J. Van Campenhout, L. Cerutti, J.-B. Rodriguez, E. Tournie, Xia Chen, M. Nedeljkovic, G. Mashanovich, Li Shen, N. Healy, A. C. Peacock, Xiaoping Liu, R. Osgood, and W. M. J. Green, “Silicon-based photonic integration beyond the telecommunication wavelength range,” IEEE J. Sel. Top. Quantum Electron. 20(4), 394–404 (2014). 2. W. Zhong, M. Wu, C. W. Chang, K. A. Merrick, S. D. Merajver, and M. A. Mycek, “Picosecond-resolution
fluorescence lifetime imaging microscopy: a useful tool for sensing molecular interactions in vivo via FRET,” Opt. Express 15(26), 18220–18235 (2007).
3. R. Trebino and D. J. Kane, “Using phase retrieval to measure the intensity and phase of ultrashort pulses: frequency-resolved optical gating,” J. Opt. Soc. Am. A 10(5), 1101–1111 (1993).
4. R. Trebino, “Frequency Resolved Optical Gating: The Measurement of Ultrashort Laser Pulses,” Kluwer Academic (2002).
5. D. J. Kane, “Real-Time Measurement of Ultrashort Laser Pulses Using Principal Component Generalized Projections,” IEEE J. Sel. Top. Quantum Electron. 4(2), 278–284 (1998).
6. C. Iaconis and I. A. Walmsley, “Spectral phase interferometry for direct electric-field reconstruction of ultrashort optical pulses,” Opt. Lett. 23(10), 792–794 (1998).
7. S. P. Gorza, P. Wasylczyk, and I. A. Walmsley, “Spectral shearing interferometry with spatially chirped replicas for measuring ultrashort pulses,” Opt. Express 15(23), 15168–15174 (2007).
8. T. Hori, N. Nishizawa, T. Goto, and M. Yoshida, “Experimental and numerical analysis of widely broadened supercontinuum generation in highly nonlinear dispersion-shifted fiber with a femtosecond pulse,” J. Opt. Soc. Am. B 21(11), 1969–1978 (2004).
9. I. G. Cormack, W. Sibbett, and D. T. Reid, “Rapid measurement of ultrashort-pulse amplitude and phase from a two-photon absorption sonogram trace,” J. Opt. Soc. Am. B 18(9), 1377–1382 (2001).
10. M. D. Thomson, J. M. Dudley, L. P. Barry, and J. D. Harvey, “Complete pulse characterization at 15 µm by cross-phase modulation in optical fibers,” Opt. Lett. 23(20), 1582–1584 (1998).
11. P. A. Lacourt, M. Hanna, and J. M. Dudley, “Broad-Band and Ultrasensitive Pulse Characterization Using Frequency-Resolved Optical Gating via Four-Wave Mixing in a Semiconductor Optical Amplifier,” IEEE Photonics Technol. Lett. 17(1), 157–159 (2005).
12. L. Lepetit, G. Ch’eriaux, and M. Joffre, “Linear techniques of phase measurement by femtosecond spectral interferometry for applications in spectroscopy,” J. Opt. Soc. Am. B 12(12), 2467–2474 (1995).
13. C. Dorrer and I. Kang, “Linear self-referencing techniques for short-optical-pulse characterization,” J. Opt. Soc. Am. B 25(6), A1–A12 (2008).
14. F. Li, Y. Park, and J. Azana, “Linear characterization of optical pulses with durations ranging from the picosecond to the nanosecond regime using ultrafast photonic differentiation,” IEEE/OSA. J. Lightwave Technol. 27(21), 4623–4633 (2009).
15. A. Pasquazi, M. Peccianti, Y. Park, B. E. Little, S. T. Chu, R. Morandotti, J. Azaña, and D. J. Moss, “Sub-picosecond phase-sensitive optical pulse characterization on a chip,” Nat. Photonics 5(10), 618–623 (2011). 16. M. A. Foster, R. Salem, D. F. Geraghty, A. C. Turner-Foster, M. Lipson, and A. L. Gaeta, “Silicon-chip-based
ultrafast optical oscilloscope,” Nature 456(7218), 81–84 (2008).
17. J. Y. Yang, L. Zhang, X. Wu, O. F. Yilmaz, B. Zhang, and A. E. Willner, “All-optical chromatic dispersion monitoring for phase-modulated signals utilizing cross-phase modulation in a highly nonlinear fiber,” IEEE Photonics Technol. Lett. 20(19), 1642–1644 (2008).
19. G. P. Agrawal, “Nonlinear Fiber Optics,” 4th ed. Academic Press, Boston (2007).
20. Y. Miyoshi, S. Takagi, S. Namiki, and K. I. Kitayama, “Multiperiod PM-NOLM With Dynamic Counter-Propagating Effects Compensation for 5-Bit All-Optical Analog-to-Digital Conversion and Its Performance Evaluations,” IEEE/OSA. J. Lightwave Technol. 28(4), 415–422 (2010).
21. L. Poti, E. Lazzeri, G. Meloni, A. Bogoni, and G. Prati, “All-Optical Processing by Means of Cross-Phase-Modulation-Based PM-NOLM Interconnected Structures,” IEEE J. Sel. Top. Quantum Electron. 14(3), 580–586 (2008).