Test Structures for Characterising the Silver
Chlorination Process During Integrated Ag/AgCl
Reference Electrode Fabrication
C. Dunare
1, J.R.K. Marland
1,2, E.O. Blair
1, A. Tsiamis
2, F. Moore
1, J.G. Terry
1, A.J. Walton
1, & S. Smith
2,
1School of Engineering, Institute for Integrated Micro and Nano Systems, The University of Edinburgh, Edinburgh, UK2School of Engineering, Institute for Bioengineering, The University of Edinburgh, Edinburgh, UK
email: [email protected], ORCID: 0000-0002-7004-9219
Abstract—Robust and repeatable processes are required to fabricate reference electrodes for micro-scale integrated elec-trochemical sensors. One method for this is to produce a “silver/silver chloride” (Ag/AgCl) electrode through chemical chlorination of a thin film silver layer. This paper presents test structures, which can electrically characterise the process to aid process development and in-line control of the chlorination process.
Index Terms—Test Structures, Reference Electrode, Electro-chemical Sensors, Microfabrication
I. INTRODUCTION
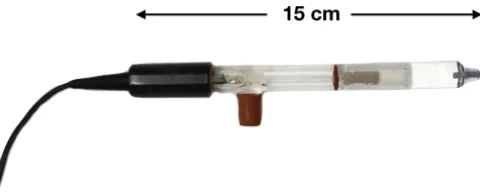
A high quality reference electrode is essential for electro-chemical sensing as it represents a stable potential against which all other electrode potentials are referred. Macro scale Ag/AgCl reference electrodes [1] that include liquid junctions and saturated electrolytes, such as the example shown in Fig. 1, are readily available. However, when using microfabricated electrodes for electrochemical sensing such reference elec-trodes are inappropriate as it is clearly desirable to integrate a miniaturised reference electrode as part of the fabrication process [2]. This raises a number of challenges, one of which is the chlorination of silver to create the required Ag/AgCl electrode structure. There are two approaches to produce an AgCl layer on an Ag electrode: active electrochemical conversion, and a direct chemical reaction [2]. While the electrochemical conversion is a very controllable approach it requires each reference electrode on the substrate to be electrically connected to distribute current to all of them. After the chlorination process an extra step is required to remove or disconnect this current supply interconnect, while also ensuring that no metal connected to the reference elec-trode is exposed in an area where there will be electrolyte during operation. Hence,from a manufacturing viewpoint the electrochemical chlorination was deemed less straightforward than using a direct chemical reaction to convert Ag to AgCl. However, characterising and controlling the thickness of this chemical process is less straightforward than electrochemical conversion of the silver. This paper provides a solution to
[image:1.612.316.556.228.325.2]This work was funded by the Engineering and Physical Sciences Research Council (EPSRC), through the IMPACT programme grant (EP/K034510/1), and the EPSRC Centre for Doctoral Training in Intelligent Sensing and Measurement (EP/L016753/1). E.O. Blair is now with the Department of Biomedical Engineering, University of Strathclyde, Glasgow, UK
Fig. 1. A commercially available Ag/AgCl reference electrode.
this issue by detailing a test structure which can provide information on the thickness of the AgCl formation during the fabrication of an integrated Ag/AgCl reference electrode. Controlling and monitoring this process step is a key element in successful reference electrode fabrication.
II. INTEGRATEDAg/AgClREFERENCEELECTRODE
Fig. 2. Cross-section of an integrated reference electrode designed to be integrated with a microfabricated Clark oxygen sensor.
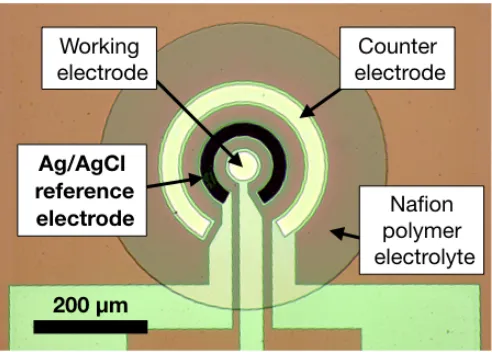
Fig. 3. A microfabricated Clark oxygen sensor.
as routine, process control. To the authors’ knowledge no test structures have been reported for fully characterising the chlorination process.
III. TESTSTRUCTURES FORAg/AgClLAYER THICKNESS
[image:2.612.57.292.57.181.2]During the formation of the non-conducting AgCl the silver surface is consumed. Hence the resistance of the remaining silver layer can be used to monitor the chlorination process. A track with the cross-section shown in Fig. 2 can be modelled as two resistors (Ag and Pt) connected in parallel (note the 10 nm Ti adhesion layer has not been included but can be added if necessary). While this model is only an approximate representation of the current flow, it provides an insight into the test structure sensitivity as shown in Fig. 4, where bulk Ag and Pt resistivities are assumed. The sheet resistance of the 40 nm Pt, and 250nm Ag layers can be determined as 2.6 and 0.06 Ω/ respectively. Note that bulk resistivity values are are typically lower than thin film resistivities, so it would be expected that the real thin film resistances will be greater, but with a similar order of magnitude. A key element that this model demonstrates is that the structure can be used to identify when the silver layer has been fully consumed (an undesirable situation) and, assuming the AgCl thickness grows
Fig. 4. Calculated sheet resistance of a Ag on Pt track as a function of Ag thickness. The maximum Ag thickness is 250 nm on a 40 nm layer of Pt, as in the electrodes before chlorination.
uniformly and acts as an insulator, the structure provides a degree of quantification of the thickness of any remaining silver after chlorination. While this may be a reasonable first order assumption there is evidence that the AgCl grows in a granular fashion with micropores providing access to the silver for the chlorination process illustrated in Fig. 5 [6]. During this process the silver is consumed and while the model assumes this occurs uniformly at the Ag/AgCl interface, this is unlikely to be the case.
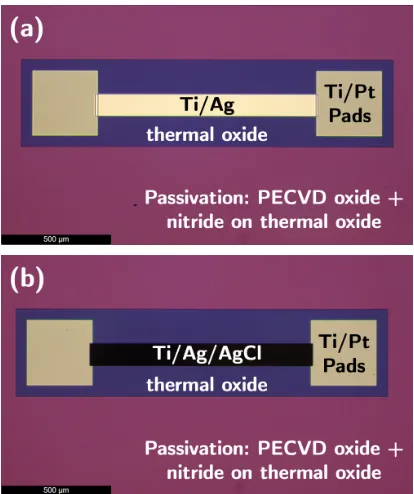
An initial investigation used a 2-terminal silver on titanium resistor design shown in Fig. 6 chlorinated using 10 mM FeCl3 for 60 seconds. The colour change in Fig. 6(b) indicates the formation of AgCl, which resulted in the measured resistance increasing to tens of kΩ. This suggests that all the silver has been converted to AgCl, with the Ti adhesion layer providing a conduction path. When the FeCl3 concentration is reduced to 0.125 mM, significant current still flows, indicating that there is silver remaining under the AgCl. These initial results provide the motivation to design a more comprehensive test chip with Kelvin measurement structures to better characterise the process.
Fig. 7 shows the test chip layout, while Fig. 8 is a micro-scope image of a fabricated chip after chlorination. The test chip was specifically designed to:
1) Indicate when all the silver is converted to AgCl. 2) Provide a non-destructive in-line estimate of the
thick-ness of remaining silver at earlier stages of the process. 3) Provide information about the effect of ferric chloride
on other conductors exposed to the solution.
It should be noted that the dimensions selected in the test structures are related to the reference electrode dimensions used in the sensor design.
[image:2.612.52.298.230.406.2]Fig. 5. Growth of AgCl film. (a) Initial island formation, (b) island coalescence, (c) granular grain growth and thickening of film.
Clark electrode (Structure D), and Greek crosses [7] (width 20 µm) for sheet resistance measurements (Structure C). The Greek cross structure effectively measures the resistivity of the area of the centre of the cross (400 µm2) and will give a better indication of the spatial variability of the chlorination process than the bridge structure (area 6,000 µm2for the 300 µm long bridge).
The six rows of structures present on each chip, consist of three different metal stacks either with or without chlorination. The structures not exposed to the chlorination process are used to provide a reference benchmark before the AgCl formation procedure.
• Row 1: Pt only
• Row 2: Pt exposed to chlorination
• Row 3: Ag only
• Row 4: Ag exposed to chlorination
• Row 5: Pt/Ag
• Row 6: Pt/Ag exposed to chlorination
Row 4 (Ag) is expected to indicate a high resistance condition once all the Ag is converted, and it is anticipated that for Row 6 (Pt/Ag) the AgCl conversion will result in a similar resistance to that measured for Row 2 (Pt). For this investigation the test chips are designed to be fabricated on 100 mm Si wafers and diced into eight 5 ×5 arrays for process optimisation and evaluation purposes. Unlike the measurements reported in [6] it should be noted that these test structures all measure the resistance of the metal layers in the
Fig. 6. Photographs of resistor test structure with an Ag resistive track before (a) and after (b) chlorination.
Fig. 7. Test chip layout containing structures for monitoring the Ag/AgCl chlorination process using Kelvin resistance measurement.
plane of the conductive material.
IV. MEASUREMENTCONSIDERATIONS
[image:3.612.56.292.58.339.2] [image:3.612.338.538.339.565.2]Fig. 8. Photomicrograph of a test chip. The dark structures on Row 4 and Row 6 have been chlorinated.
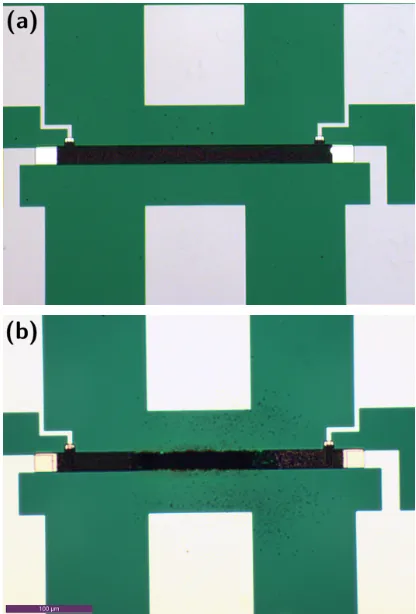
forced through a chlorinated 300 µm bridge structure. It can be observed that there is significant damage with the track no longer having a clean and straight edge. It also appears that some of the AgCl is missing from areas of the track. The following results all relate to measurements on 300 µm long Kelvin bridge test structures.
TABLE I
SUMMARY OF THE METALS USED IN THE TEST STRUCTURES.
Metal Thickness (nm) Bulkρ(Ωm)
Ti 10 5.56×10⁻⁷
Pt 40 1.1×10⁻⁷
Ag 250 1.59×10⁻⁸
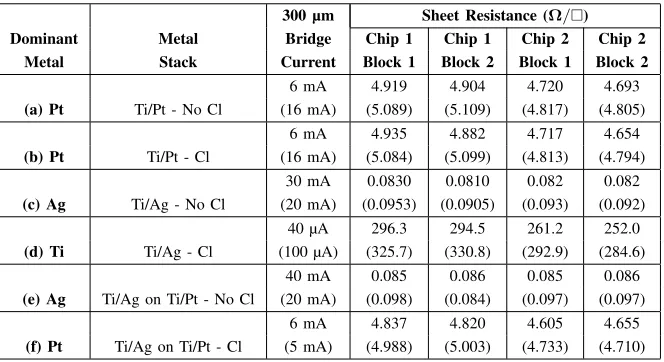
Table II shows selected measurement currents and extracted sheet resistance values for the different combinations of metal layers in the test structures, including structures that have been exposed to chlorination. The measurement currents used exhibited no I2R heating effect or issues with voltmeter resolution. Many have reported [5] measuring the resistance perpendicular to the surface of AgCl films (i.e. being used as an electrode) with the ionic conduction taking place through micro-pores from the surface to the bottom of the AgCl film. While the test structures presented in this paper are not operated in this mode special attention needs to be taken to ensure appropriate current densities are used for measuring structures that have been subjected to Ag chlorination.
It can also be observed in Table II that, as expected, the bridge and Greek cross structures are in broad agreement, given that the track cross-sections are not rectangular and the width of the track is assumed to be the designed value. Additionally, the measurement of the chlorinated structures is also affected by any misalignment of the photoresist chlori-nation mask shown in Fig. 7. Clearly, fully optimising the measurements would minimise these minor differences. The
Fig. 9. Microscope images of a chlorinated bridge structure, (a) before and (b) after a current of 100 mA is forced.
measurement with the largest variation is the chlorinated Ti/Ag combination where all the Ag has been converted to AgCl and just the 10 nm titanium adhesion layer is left. Possible causes for the variation are the Ti, which is known to be a very non-uniform layer, and there is also concern from optical inspection that the connection of voltage taps may be marginal.
Based upon the simple model presented in Fig. 4 it would be expected that the non-chlorinated Pt/Ag results should match the related chlorinated Pt/Ag measurement when all the silver is converted (Rows a,b and f in Table II). It can be observed from table II that as predicted for these samples a single metal (Pt) dominates the measured sheet resistance.
V. MEASUREMENTS OFRsAS A FUNCTION OFFeCl3
CONCENTRATION
The ability to identify that silver remains underneath the AgCl is the major contribution of the test structures in this paper. The Pt sheet resistance, both protected and exposed to FeCl3 for 60 seconds, has been measured as 4.7 – 4.9 Ω/
and this resistance is not affected by the FeCl3concentration. In contrast films in the test structures with as-deposited silver have a sheet resistance of 0.08 – 0.09Ω/, a value which is affected by chlorination.
[image:4.612.71.280.51.250.2]TABLE II
EXTRACTED RESISTANCE OF FOUR300 µM LONGKELVIN BRIDGES AND THEIR MEASUREMENT CURRENTS FORPT, AG ANDPT/AG TEST STRUCTURES (GREEK CROSS MEASUREMENTS IN BRACKETS). (A) TI/PT(NON-CHLORINATED), (B) TI/PT(NON-CHLORINATED), (C) TI/AG(NON-CHLORINATED), (D)
TI/AG ONTI/PT(CHLORINATED), (E) TI/AG ONTI/PT(CHLORINATED).
300 µm Sheet Resistance (Ω/)
Dominant Metal Bridge Chip 1 Chip 1 Chip 2 Chip 2
Metal Stack Current Block 1 Block 2 Block 1 Block 2
6 mA 4.919 4.904 4.720 4.693
(a) Pt Ti/Pt - No Cl (16 mA) (5.089) (5.109) (4.817) (4.805)
6 mA 4.935 4.882 4.717 4.654
(b) Pt Ti/Pt - Cl (16 mA) (5.084) (5.099) (4.813) (4.794)
30 mA 0.0830 0.0810 0.082 0.082
(c) Ag Ti/Ag - No Cl (20 mA) (0.0953) (0.0905) (0.093) (0.092)
40 µA 296.3 294.5 261.2 252.0
(d) Ti Ti/Ag - Cl (100 µA) (325.7) (330.8) (292.9) (284.6)
40 mA 0.085 0.086 0.085 0.086
(e) Ag Ti/Ag on Ti/Pt - No Cl (20 mA) (0.098) (0.084) (0.097) (0.097)
6 mA 4.837 4.820 4.605 4.655
(f) Pt Ti/Ag on Ti/Pt - Cl (5 mA) (4.988) (5.003) (4.733) (4.710)
0.1
1
10
100
0.1
1
10
FeCl
3conc (mM)
Sh
ee
t
re
si
st
an
ce
(
Ω
/
!
[image:5.612.140.472.96.277.2])
Fig. 10. Extracted resistance of a 300 µm long Kelvin bridge as a function of FeCl3concentration for a PtAg test structure. Each test chip has been exposed
to the FeCl3for 60 seconds.
increasing the concentration increases the thickness of exposed Ag converted to AgCl thereby increasing resistance, with the conversion of Ag increasing with higher concentrations. As expected the sheet resistance before chlorination is largely set by the 250 nm of Ag and the underlying Pt remains unaffected. Once all the Ag has been converted the Pt layer defines the sheet resistance.
The error bars in Fig. 10 are the standard deviation of measurements of six test structures on two different chips. The high level of variation for the structures exposed to FeCl3with a concentration of 0.5 mM is an illustration of the significant variability of the process when there is partial conversion to AgCl. This may also be a result of light exposure during
processing which seems to have a significant effect on the reaction. This requires further investigation, but we have found that limiting light exposure makes the chlorination process less variable.
Using typical values of Pt and Ag sheet resistance from Table II, we can adjust the model in Fig. 4 to better reflect the thin film sheet resistivity. This model can then be used to calculate an approximate value of the average thickness of the remaining silver layer in the chlorinated test structure. For example, for the structures chlorinated for 60 seconds with a concentration of 0.5 mM the estimated average silver thickness is 123 nm.
VI. CONCLUSIONS
This paper has presented a set of test structures that can be used to characterise the conversion of silver during a chemical chlorination process. In particular, they provide an in-process measure of the Ag layer thickness and have been instrumental in unambiguously identifying FeCl3 concentrations that leave underlying silver after 60 seconds of reaction.
The depth of chlorination is a function of both time and concentration. The chlorination process used in this work is a manual operation and a 60 seconds process has a significant percentage of the total time associated with the loading and unloading of the sample; perhaps too short a time from a re-peatability perspective. Hence, there are attractions associated with reducing the concentration and increasing the chlorination time. Clearly, the test chip described in this paper is well suited to the task of identifying successful chlorination and confirming the AgCl has a layer of Ag underneath.
[image:5.612.55.288.109.522.2]reaches the interface with the Pt, it is suggested that islands of silver will be created. These “isolated” islands, connected by the underlying Pt, will eventually be converted to AgCl and cease to contribute to the resistance measured.
The Greek cross test structure can provide information on the homogeneity of the grain structure from statistical variation between individual test structures [7]. This is in contrast to the bridge test structures, which extract sheet resistance from a much larger area.
It has also been noted that the area of the structure is an important parameter in the chlorination process with a more rapid conversion process taking place along the periphery of the electrode. For process control it would be recommended that the test structures are similar in dimensions to the refer-ence electrode being fabricated.
REFERENCES
[1] H. Suzuki, H. Shiroishi, S. Sasaki, and I. Karube, “Microfabricated liquid junction ag/agcl reference electrode and its application to a one-chip potentiometric sensor,”Analytical Chemistry, vol. 71, no. 22, pp. 5069– 5075, 1999.
[2] M. W. Shinwari, D. Zhitomirsky, I. A. Deen, P. R. Selvaganapathy, M. J. Deen, and D. Landheer, “Microfabricated reference electrodes and their biosensing applications,”Sensors, vol. 10, no. 3, pp. 1679–1715, Mar. 2010.
[3] J. R. K. Marland, C. Dunare, A. Tsiamis, E. Gonz´alez-Fern´andez, E. O. Blair, S. Smith, J. G. Terry, A. F. Murray, and A. J. Walton, “Test structures for optimizing polymer electrolyte performance in a microfabricated electrochemical oxygen sensor,” in 2017 International Conference of Microelectronic Test Structures (ICMTS), March 2017, pp. 145–149.
[4] B. J. Polk, A. Stelzenmuller, G. Mijares, W. MacCrehan, and M. Gaitan, “Ag/AgCl microelectrodes with improved stability for microfluidics,” Sensors and Actuators B: Chemical, vol. 114, no. 1, pp. 239–247, Mar. 2006.
[5] X. Sun and M. Wang, “Fabrication and characterization of planar refer-ence electrode for on-chip electroanalysis,”Electrochimica Acta, vol. 52, no. 2, pp. 427–433, Oct. 2006.
[6] H. Ha and J. Payer, “The effect of silver chloride formation on the kinetics of silver dissolution in chloride solution,”Electrochimica Acta, vol. 56, no. 7, pp. 2781–2791, 2011.