Vol. 8, No. 1, pp. 43-55 ISSN 1864-3361 http://www.surveymethods.org
c
European Survey Research Association
Measurement Error in Retrospective Work Histories
Jose Pina-S´anchez
University of Manchester
Johan Koskinen
University of Manchester
Ian Plewis
University of Manchester
Measurement error in retrospective reports of work status has been difficult to quantify in the past. Issues of confidentiality have made access to datasets linking survey responses to a valid administrative source problematic. This study uses a Swedish register of unemployment as a benchmark against which responses from a survey question are compared and hence the presence of measurement error elucidated. We carry out separate analyses for the different forms that measurement error in retrospective reports of unemployment can take. These are misdates of ends of spells, misclassifications of work status, miscounts of the number of spells of unemployment, misreports of total durations in unemployment, and mismatches of work status in person-day observations. The prevalence of measurement error for different social categories and interview formats is also examined, leading to a better understanding of the error-generating mechanisms that arise when interviewees are asked to produce retrospective reports of work status. We are able to confirm some previously hypothesised error mechanisms – such as ‘interference – but also identify interesting patterns – such as non-monotonic depen-dence of recall time on recall error.
Keywords:Measurement error; survey; retrospective questions; work history; administrative
data
1. Introduction
Retrospective questions are widely used in cross-sectional surveys to capture changes over time. They are cheaper to administer and protected from problems of attri-tion affecting prospective or longitudinal designs since re-spondents only need to be contacted once. Furthermore, they lend themselves naturally to analysing timings of life-course events. The major problem for retrospective questions stems from the particular types of measurement error (ME from here on) they tend to generate in the responses (see Solga, 2001, for a detailed comparison of data quality from prospec-tive and retrospecprospec-tive questions).
In this paper, we study the nature and extent of ME found in the answers to a retrospective question on work histories. We use data from the Swedish register of unemployment that has been linked to cases selected for a survey. Under the assumption that the register data are error-free and by com-paring it with responses to the survey question, we are able to ascertain the extent of ME in those responses.
We start by considering the arguments that have been put forward to account for ME in these types of questions. In
Contact information: Jose Pina-S´anchez, CCSR, School of Social Sciences, Humanities Bridgeford St Build-ing, University of Manchester, Manchester, M13 9PL (jose.pinasanchez@postgrad.manchester.ac.uk)
Section 3 we review the empirical findings in the literature. Section 4 describes the datasets we have used. Our analysis is presented in two parts in Section 5; first we assess the ME that specifically affects spells of unemployment, and second we analyse the ME that can be identified from summaries of the work history. Section 6 concludes with a summary of the main findings and a discussion of their implications and limitations.
2. Measurement Error
Generating Mechanisms
The extent of ME in retrospective questions is mainly related to the saliency of the event and to recall time (Bound, Brown, & Mathiowetz, 2000). Saliency refers to how much of an imprint the event of interest leaves in the respondents memory, recall time measures the time that has elapsed be-tween the occurrence of the event and the date of the inter-view. The lower the saliency and the longer the recall time, the greater the expected ME. In turn, saliency is affected by interference. Interference as a source of ME arises from the difficulty of discerning the occurrence of specific events when several of them have taken place during the reference period (Mathiowetz, Brown, & Bound, 2001).
Other sources of ME that affect reports of work histories (but that are not necessarily unique to the retrospective de-sign) are “misunderstanding” and “social desirability”. Mis-understanding refers to the first step identified by Tourangeau (1984) in the cognitive process involved in answering a sur-vey question. This source of ME appears when the question or its possible answers are not fully comprehended by the
interviewee. For work histories, it refers to the imperfect capacity to discriminate between two or more categories of work status. One example is the sometimes subtle distinction between being unemployed and being out of the labour force. It has been argued that being more embedded in the labour market is associated with being more familiar with its func-tioning and therefore to favour accurate reports (Bound et al., 2000; Levine, 1993; Morgenstern & Barrett, 1974; Paull, 2002).
Social desirability bias appears in value-laden top-ics. Socially undesirable events tend to be under-reported whereas socially desirable events are often over-reported (Pyy-Martikainen & Rendtel, 2009)). Employment and un-employment are respectively the most and least desirable work status categories. Hence, the state of being unemployed might be more prone to under-reporting.
In addition, Paull (2002) argues that the overall saliency of work status can be expected to be greater for men than for women because of the financial importance of being
the prime household earner. In terms of
misunderstand-ing, Bound et al (2000) argue that population subgroups with lower labour force participation such as women and teenagers are likely to generate more ME because of their lower engagement with the labour market. With respect to social desirability, the long-term unemployed are, arguably, more stigmatised than people unemployed for a short period and are thus likely to generate more ME, especially if the interview uses a face-to-face format (Mathiowetz & Duncan, 1988).
Taking into consideration these suggested patterns in the prevalence of ME, we specify the principles of the error mechanisms affecting retrospective questions on work his-tories in terms of four hypotheses:
1. Recall time: the probability of generating ME of any form is positively associated with the elapsed time be-tween the interview and the event reported.
2. Interference: the probability of misreporting spells and durations of unemployment is positively associ-ated with the number of spells of unemployment expe-rienced.
3. Misunderstanding: categories of the population that are relatively more embedded in the labour market (middle age men) produce fewer misclassifications of work status than less engaged groups (young people and women).
4. Social desirability: the number of spells and durations of unemployment will be under-reported by groups of the population more susceptible to the stigma derived from being unemployed (e.g. long-term unemployed), and in interviews conducted face-to-face (as opposed to phone or web-based interviews). .
3. Empirical Evidence from the
Literature
In the literature on ME in reports of work histories, there are two main research designs that have been used to ascer-tain the presence of ME in surveys at the respondent level:
replication and validation studies. Replication designs iden-tify ME from the variability in responses to identical ques-tions taken from the same respondents at two or more points close in time. However, because none of the responses are free of ME, it is not possible to estimate the systematic com-ponent of the error. Validation designs use a gold standard, a dataset where the true measures for the same subjects are available, so an estimate of non-random variability in error-prone measures can be obtained. Here we present results from previous studies that have used a validation design in the study of retrospective reports of unemployment.
Duncan and Hill (1985) used administrative files of the workers of an American manufacturing firm as a gold stan-dard, and compared these values with the ones reported by the same employees in the Panel Study of Income Dynam-ics (PSID). They found little evidence for ME when unem-ployment spells were reported one year later. However, this sample is only made up of workers from one particular firm, something which severely limits the generalizability of the conclusion. It is unlikely that absence of ME holds for the US population at large or for the parts of the population less embedded in the labour market.
Mathiowetz and Duncan (1988) used the same dataset as Duncan and Hill and paint a rather different picture of ME and its implications, depending on what forms of ME are considered. Respondents offered very accurate answers when asked to report the total time spent unemployed in the last year. However, when required to identify and time each spell of unemployment, results are much less accurate: 66% of spells were omitted. In addition, Mathiowetz and Duncan modelled the probability of misclassifying unemployment status for different socio-demographic groups and showed that associations with demographic variables such as ethnic-ity, education, age and gender were not statistically signif-icant if other variables capturing saliency and interference were controlled for. Saliency was measured by the length of the spell and interference by the number of spells of unem-ployment that the respondent experienced during the period of analysis. The authors therefore speculated that it is not the condition of being younger or a woman that is associated with ME but their more complex work histories. Another finding from this paper challenges the hypothesis that accu-racy deteriorates as the time between the period to be recalled and the date of the interview grows. The authors found that the effect of elapsed time is not linear but quadratic, with the probability of committing an error growing the closer the pe-riod is to the interview date up to a point, about five months, where it falls sharply.
odds of omission by 24% with short spells being harder to remember. In addition, age has a quadratic effect, with the probability of omission decreasing until age 37 and increas-ing thereafter. The authors found that time spent in unem-ployment and the number of spells of unemunem-ployment gener-ated under-reports, while female respondents over-reported their time in unemployment.
4. Data
We use data from the “Longitudinal Study of the Unem-ployed” (LSA in Swedish), a research project designed by the Swedish Institute for Social Research (SOFI) at Stock-holm University, directed by Sten-Ake Stenberg, and with the collaboration of the register of unemployment (PRESO1). This register provided individual-level data on the work sta-tus of those cases selected to participate in a longitudinal survey, two waves of which were held in 1993 and in 2001, which we introduce next.
Survey Data from the LSA
The two survey waves are relatively similar with respect both to the composition of the sample of participants and the questionnaire. The sample was designed to capture 830 job-seekers randomly selected from those who were registered
as such in the PRESO files on 28th February 1992. In
ad-dition, participants were selected if they met the following criteria: not employed, willing to start work both immedi-ately and full time, age between 25-54, Nordic nationality, and no occupational disabilities. The percentage of subjects responding to the surveys in 1993 and 2001 was 64% and 56% respectively.2
The interviews for the 1993 survey took place between March and April and the question capturing work histories reads as follows:
“Which of the alternative answers on the re-sponse card best describes your main activity the first week of 1992? When did this activity start? When did it end?”
“Which was the subsequent main activity? When did this activity start? When did it end?”3 This question changed in the 2001 survey where it reads:
“I would now like to review the work and other pursuits you have had since January 1990. Consider all the pursuits that lasted at least a month, not only jobs but also parental leave, un-employment , education and the like. Review these pursuits in chronological order until to-day”.
Two main differences between the 1993 and 2001
sur-veys can be noted. Firstly, the recall time is vastly expanded in LSA-2001; from a time frame of little more than one year to one of 11 years. Secondly, observations in LSA-2001 are dated on a monthly scale instead of the implied
daily one used in the 1993 survey. On the other hand, the different work status categories were the same in both sur-veys: “working”, “studying”, “jobseeker”, “unpaid parental leave”, “homeworker” (not employed), “pensioner”, “AMS-training”4, and “other”. In addition to work status, two other variables in the 1993 survey are used in the analysis: female andphone interview5(indicating whether the interview was carried out by phone rather than in person).
Register Data from PRESO
PRESO collects information from jobseekers on the last weekday of each month. Registration is a prerequisite for ac-cess to employment policy programmes and to collect unem-ployment benefits. Korpi and Stenberg (2001) estimate that between 90% and 95% of the unemployed are registered as jobseekers in PRESO. In what follows, in order to represent PRESO as a gold standard, it is assumed that this proportion is 100%.
A daily work status variable can be retrieved from PRESO for each month thus generating individual work his-tories. Other variables that we use from PRESO are: age, experience, spells of unemployment, cumulative unemploy-ment, spell length, and timespan. Experiencecaptures self-reported levels of experience for the type of work applied for. The PRESO questionnaire considers three responses,
low, medium and high.6 Spells of unemployment records
the number of spells of unemployment experienced by the
subject over the window of observation. Cumulative
unem-ploymentcaptures the number of days the subject has spent registered as unemployed during the window of observation. Spell lengthindicates the overall duration (according to the register) of the first spell reported that includes 1/1/1992, and timespancaptures the number of elapsed days between the day in question and the interview date.
Because the unit of measurement used in PRESO (days) differs from that used in the 2001 survey question (months), we focus the analysis on the 1993 survey question, restrict-ing the use of the 2001 data to the analysis of the number of spells of unemployment reported (for which the ending date is irrelevant).
1PRESO is a register from the Swedish employment office (Ar-betsmarknadsstyrelsen: AMS).
2There were no differences between survey respondents and non-respondents based on the characteristics captured by the reg-ister such as age, level of experience, and duration of the first spell of unemployment within 1992.
3This and the following quote from the questionnaire are trans-lations from Swedish.
4This category encompasses any training provided at the jobcen-tre.
585% of the sample was interviewed face-to-face and 15% by phone in 1993.
U E
Survey U
U E
Register U
A
U E
Register U
B
U E
Survey U
C
U Survey
U E
[image:4.612.55.294.71.262.2]Register U
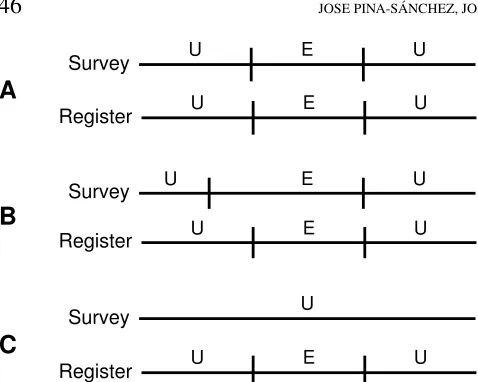
Figure 1 Problems of ME identification at the spell level
5. Analysis
In order to ascertain the prevalence of ME and the na-ture of the mechanisms affecting retrospective questions on unemployment we carry out two separate analyses. First, we study ME at the spell level by focusing on the first spells reported in the survey and comparing them to what was recorded in the register for the same subject during the same period. Second, we compare the entire work histories cap-tured by the survey against those available for the same sub-jects and period in the register. Both analyses rely on the assumption that the register is a gold standard so that dif-ferences between the two datasets are taken as evidence of systematic ME in the survey.
Messurement Error at the Spell Level
ME on the spell level can arise either as a consequence of reports misclassifying work status, or misdating the start/end of spells. However, because of the wording of the 1993 ques-tion (see Secques-tion 4) defining ME at the spell level is not straightforward. Misclassification or misdating first spells can be propagated to subsequent spells resulting in a problem of identification. This is illustrated in Figure 1.
Diagram A in Figure 1 represents a work history which is correctly reported since both survey and register capture two spells of unemployment (U) and a spell of employment (E) and they are all correctly dated. Diagram B represents a case where ME affects the first and second spells reported but mapping each spell in the survey to a corresponding spell in the work history is still possible. In particular, B shows a problem of misdating that result in a shortening of the first spell of unemployment and an extension of the following spell of employment. Diagram C illustrates a more problem-atic case, one which prevents identification of the type of ME at the spell level beyond the first spell. In C we might assume that ME affects the first spell by extending it. However, it is impossible to tell whether the second spell (of employment) has been misclassified as unemployment (which would result
in the first and third spells of unemployment being linked in error), or whether the end of the first spell was misdated that covered the whole work history.
Because of this problem of identification, we restrict the analysis of misdating to the first spells of unemployment in the register that included 1/1/92 and that were correctly re-ported in the survey on 1/1/92. For misclassification, we use all the first spells reported regardless of their registered work status. This leads to the omission of 22% of the sample since not all the subjects were registered in PRESO on 1/1/92. In addition, to simplify the analysis, we consider just two cate-gories: “unemployment” and “other”; the latter grouping all status categories that are not unemployment.
In order to estimate the prevalence of errors stemming from misdated spells of unemployment we generate a binary variable capturing whether the end of the first spell reported in the survey fell within 15 days of the end date of the first spell seen in the register. With this approach, we find that 74% of the first spells reported were misdated.
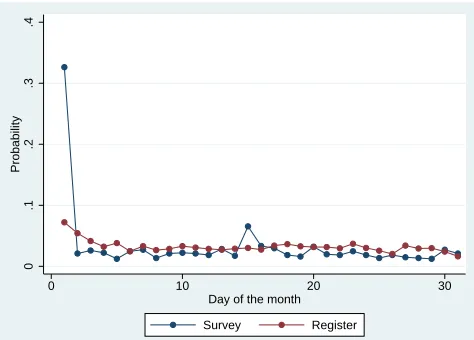
This high figure of misdated spells might be partly due to a typical problem regarding misdating in responses to surveys known as heaping effects. Torelli and Trivellato (1993) define these effects as “abnormal concentrations of responses at certain durations (for questions about elapsed time in a state) or at certain dates (for questions asking when an event took place).” (p. 189). We assess the presence of these errors graphically in Figure 2, which summarizes the proportion of starts of all spells of unemployment reported at each day of the month in the survey (dashed line), and the ones captured by the register (solid line) across the whole window of observation. The diagram shows that survey par-ticipants have a propensity to report the first day of the month as the starting day for their spells of unemployment: 33% of all spells. A second day that stands out is the 15thwith 7%.
The presence of heaping effects might suggest that mis-dated spells are due solely to rounding error (of dates). We investigate this potential explanation by estimating the pro-portion of reported ends of first spells falling in a wider in-terval of 31 days of the registered date. Although this inter-val eliminates discrepancies due to wrongly reported days, we still find that 57% of those dates remain misdated. So it seems that: 1) the problem of misdated spells is very widespread, and 2) it takes the form of both rounded days and mistaken months.
In particular, the fact that the majority of spells are mis-dated by more than a month suggests that forms of misdating derived from wrongly linking two or more spells (such as the case depicted in Figure 1C) might be relatively common. These forms of ME arise as a consequence of intermediate spells being misclassified. Using the simplified categorisa-tion described earlier we find that 30% of the subjects mis-classified the work status of their first spell reported. Un-der the assumption that the rate of misclassification is simi-lar for second spells, we can estimate that about half of the first spells are misdated as a result of subsequent spells being misclassified.
0
.1
.3
.2
.4
Probability
0 10 20 30
Day of the month
[image:5.612.56.293.90.260.2]Survey Register
Figure 2 Frequencies of the starts of spells of unemployment by day of the month: LSA 1993
level. In order to test the hypotheses presented in Section 2, and to explore the mechanisms generating these errors in detail, we specify two logit models. The first uses the binary variable indicating misdates for the 15 day interval, the sec-ond uses the binary variable indicating misclassification, and both models use the same set of explanatory variables: age, female, phone interview, experience, cumulative unemploy-ment and spells of unemployunemploy-ment.7 In addition, the sample for the model of misdates is restricted to first spells of unem-ployment that were correctly classified as such.
These two models assume that there is a latent variable y∗i describing the propensity of a personito misclassify the work status of the first spell (first model) or to misdate the end of the first spell (second model). The latent variable for-mulation of the logistic regression model assumes
y∗i =xiβ+i (1)
for subjectsi = 1,2, . . . ,n, where xi is a (1×p) vector of
covariates (including a constant),βis a (p×1) vector of the parameters to be estimated, and the error termsi are i.i.d.
logistic zero-mean variables (with varianceπ2/3.) The ob-served variable is the binary
yi=
(
1 ify∗i >0 2 ify∗i≤0 .
Results for these two models are presented in Table 1. Cumulative unemploymentis statistically significant and negative in both models, indicating that the longer a person stays in unemployment the lower is the propensity both to misdate and to misclassify the first spell. Hypothesis 3 on the propensity to misclassify being inversely related to the level of embeddedness in the labour market is supported by the significant and positive coefficient found forfemalein the misclassification model. On the other hand, gender does not predict misdating which suggests that the hypothesized prob-lem of these less embedded workers is limited to probprob-lems of
Table 1 Estimates and standard errors for the logit models for misdating and misclassification
Misclassification Misdating
b S.E. b S.E.
Age −0.014 0.014 0.014 0.015
Female 0.606∗ 0.248 −0.296 0.312
Phone interview 0.396 0.314 −0.374 0.376
Experience −0.303 0.207 −0.322 0.259
Cumulat. unempl. −0.002∗ 0.001 −0.002∗ 0.001
Spells of unempl. −0.114 0.093 0.147∗ 0.046
Spell length −0.003∗ 0.001 0.002 0.001
LR chi2(7) 50.4∗ 22.84∗
Sample size 413 276
∗
p<0.05
The regression estimates represent the effect on the log-odds of mis-dating or misclassification. Source: PRESO and LSA-1993.
misunderstanding the differences between work status, and not so much derived from general recall errors.
The propensity to misdate the end of the spell increases with the number of spells of unemployment in the register, which corroborates hypothesis 2 on interference. On the other hand, the longer the first spell the lower the propen-sity to misclassify it. As with gender, this finding suggests that the increased saliency of a spell helps respondents to re-member which kind of work status it was but not so much when it was dated. These two results are in line with the main argument posited in Mathiowetz and Duncan (1988) on the difficulty of the task being the main mechanism gener-ating ME. However, our findings serve to nuance that claim by saying that the error mechanisms operating in situations of interference are specifically reflected in misdated spells, while differences in saliency seem to be particularly associ-ated with the misclassification of spells.
By modelling the propensity to misdate or misclassify spells, we obtain direct insights into the error generating mechanisms of interest. However, because of problems of identification, we have had to restrict this analysis to the first spells reported. In order to study the presence and nature of ME throughout the whole window of observation we pro-ceed to analyse forms of ME at the work history level. This analysis is particularly relevant because, as we described at the beginning of this section, ME in the first spell can be propagated to subsequent spells.
Meassurement Error at the Work History Level
We study ME in reports of unemployment at the work history level by comparing the number of spells of unem-ployment and the number of days spent in unemunem-ployment in the register with survey reports for that same period and per-son. These two contrasts can be used to assess the prevalence of ME in survey reports of unemployment taking the form of count or duration data. That is, they offer insights into
[image:5.612.313.554.120.248.2]the accuracy of the data derived from retrospective reports of unemployment at the level of measurement that is most often used in the study of unemployment. In addition, to deepen the study of the ME generating mechanisms, we also explore ME as mismatches between the survey and register for person-day observations.
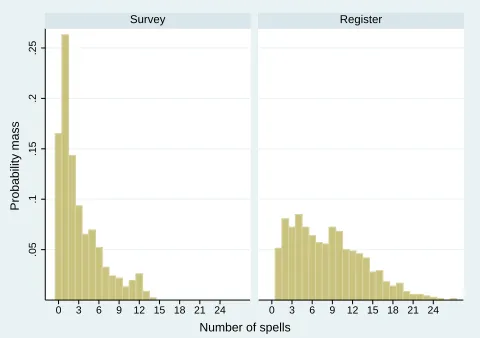
Differences in the number of spells of unemployment. We start by assessing differences between the number of spells reported and registered. Since we focus on the number of spells and not on their specific dating we can also use LSA-2001 data, where an 11 year recall period was used.
Despite the selection criterion applied in the sample de-sign (restricted to subjects registered as unemployed; see Section 4.1) 10.5% of respondents reported no spells of un-employment in the 1993 survey and 16.1% in the 2001 sur-vey. The mean number of spells of unemployment reported by subject over what was registered was 1.4/1.7 in LSA-1993 and 3.2/8.1 in LSA-2001.8,9These figures show a tendency to omit spells, especially marked in LSA-2001. The diff er-ences in error rate is notable considering that 54% of the sub-jects reported the correct number of spells of unemployment in LSA-1993 and only 7.5% managed to do so in LSA-2001. Some of these differences between the two surveys may be accounted for by their main distinguishing features: the longer recall period and the use of months as time units. The effect of the latter was estimated as the percentage of spells recorded as shorter than 28 days, which amounted to 13.7% of the spells of unemployment that were omitted in LSA-2001. However, the difference in the percentage of cases that report the correct number of spells between the two surveys is much greater than that (46.5%), which supports hypothesis 1 on the impact of extended recall time.
To explore the other hypotheses, we estimate a logit model like the one previously used in Pyy-Martikainen and Rendtel (2009), focusing on the LSA-1993 data. The latent variabley∗i of equation 1 now corresponds to the propensity of a person to omit at least one spell of unemployment. The 9.4% of subjects who over-reported their number of spells of unemployment were excluded from the model so we only study omission of spells.
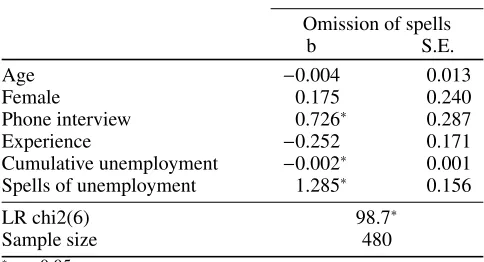
Table 2 shows thatspells of unemployment is positive
and significant whilecumulative unemploymentis also sig-nificant but negative, which implies that the more spells of unemployment and the shorter they are the higher the proba-bility of omitting them. The former corroborates once again hypothesis 2 on interference, but the latter is an unexpected result since from a social desirability standpoint (hypothe-sis 4) the opposite could be expected. This result supports the proposition introduced in the previous section indicating
that the long term unemployed might offer more accurate
[image:6.612.312.554.116.247.2]reports because the saliency of unemployment is relatively high. Phone interviewalso has a significant positive effect, meaning that spells of unemployment are less often omitted in face-to-face interviews. This finding is consistent with the view that ME in the form of under-reported spells is not mo-tivated by a stigmatizing effect of unemployment.
Table 2 Estimates and standard errors for the logit model for omission
Omission of spells
b S.E.
Age −0.004 0.013
Female 0.175 0.240
Phone interview 0.726∗ 0.287
Experience −0.252 0.171
Cumulative unemployment −0.002∗ 0.001
Spells of unemployment 1.285∗ 0.156
LR chi2(6) 98.7∗
Sample size 480
∗
p<0.05
The regression (logistic) estimates represent the effect on the log-odds of omission. Source: PRESO and LSA-1993.
Differences in the number of days of unemployment. A second way of assessing ME at the work history level is by contrasting the total amount of time reported in unemploy-ment against the total registered. Here we extend the win-dow of observation to consider spells of unemployment re-ported in the survey which had started before 1/1/1992, and the day of the interview remains the end of the window of observation. The mean duration in the survey is 100 days shorter than in the register (271 and 371, respectively), while the standard deviation is 16 days lower (172 and 188).10,11 However, in spite of the observed tendency to under-report total durations of unemployment we find that 132 subjects (25%) over-reported their time in unemployment. These are the cases in Figure 3 that lie above the dashed diagonal line. In addition, Figure 3 shows that longer durations of unem-ployment are the most severely underreported. The lowess curve (the continious line) shows a divergence between re-ported and registered durations that becomes especially pro-nounced after a point around 400 days.
We explore the error generating mechanisms by mod-elling the aggregated misreported durations. Specifically, the square roots of the absolute differences between reported and registered cumulative times are taken to eliminate their oth-erwise right-skewed distribution, and to be able to include cases where unemployment was over-reported.
More formally, the response variable of the model,yi, is
8Figures A.1 and A.2 in the appendix show histograms of the number of spells reported and registered both in LSA-1993 and LSA-2001.
9t-tests for the differences in spells of unemployment in LSA and PRESO showed ap-value<.0001 in both datasets.
10The probability density functions of the aggregated durations in both the survey and the register are shown in figure A.3 in the appendix
0
200
400
600
800
Reported duration of spells in days
[image:7.612.56.295.91.260.2]0 200 400 600 800 1000 Registered duration of spells in days
Figure 3 Scatterplot of the aggregated time spent in unemployment: LSA-1993
defined as follows:
yi=
v u t
Si
X
s=1 Tsi−
Ri
X
r=1 Tri
,
whereTsiandTriare the durations of a particular spell,s, of
reported andrregistered unemployment for subjecti; andSi
andRiare the total number of spells reported and registered
for personi.
A regression modelyi=xiβ+iis assumed for the
misre-ports, where the error termsiare i.i.d. Normally distributed.
The results in Table 3 show thatphone interviewhas a pos-itive and significant estimate, which indicates that conduct-ing the survey face-by-face improves the quality of reports in general. However, unlike the model for omission, we cannot reject hypothesis 4 on how the stigmatizing effect of unem-ployment promotes more under-reporting in face-to-face in-terviews because here we are modelling both under and over-reported durations.Experiencewas negative and significant. This result both corroborates and extends hypothesis 3, since we find that those subjects more embedded in the labour mar-ket report more accurate durations in unemployment. That is, they are not just limited to better differentiating work status. The positive effect forcumulative unemploymentis sur-prising as it is out of line with what was found in all the pre-vious models where time spent in unemployment was associ-ated with more accurate reports. With respect to the model on misdates we have to take into account that its response vari-able captured ends of spells misdated by 15 days, whereas here we model the actual extent of the misdate, and as we saw in Figure 3, the magnitude of misreports is particularly large in the cases with the longest durations in unemployment. So it seems that hypothesis 4 on the effect of social desirability is particularly valid for those who have been unemployed for over a year.
Mismatches in person-day observations. Finally, we ex-amine ME taking the form of mismatches between the
sur-Table 3 Estimates standard errors for misreported total durations in unemployment
Misreported durations
b S.E.
Age −0.011 0.029
Female 0.753 0.531
Phone interview 10.516∗ 0.662
Experience −0.781∗ 0.389
Cumulative unemployment 0.015∗ 0.001
Spells of unemployment 0.218 0.336
Constant 4.624∗ 1.772
Sample size 532
R2 0.264
∗
p<0.05
Source: PRESO and LSA-1993.
.2
.25
.3
.35
.4
.45
Proportion of mismatches
[image:7.612.314.553.117.471.2]0 100 200 300 400 500 Timespan in days
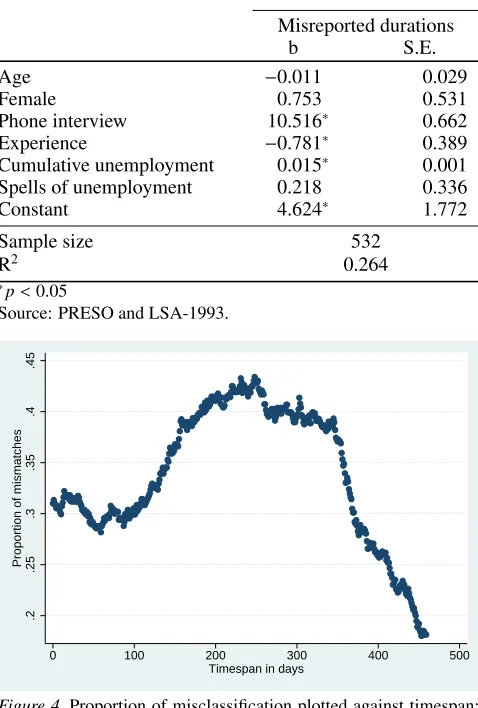
Figure 4 Proportion of misclassification plotted against timespan: LSA-1993
vey and the register in each of the person-day observations covered in the window of observation. As in the analysis of misclassification at the spell level we consider only two categories: “unemployment” and “other”.12
The percentage of observations correctly reported in the
sample is 66%. However, that percentage varies widely
across the reporting period. This is depicted in Figure 4, which shows a quadratic relationship between timespan (that is, the time from the first reported day until the interview) and the proportion of person-days mismatched; with values as low as 18% for the first of these units reported to 43% in the middle of the window of observation.
Other hypotheses regarding the error generating mech-anisms are investigated by a random effects logistic model where the probability of mismatch is specified specified in terms of the latent variable
y∗i j=xi jβ+ζi+i j (2)
withy∗ defined as in equation 1, except for the new term
ζi,(i = 1. . .n), which captures the unexplained
variabil-ity between the level 2 units (persons), and the subscript j (j = 1. . .Ji) which is now used to differentiate amongst
person-day units. The error term i j is again assumed to
be independent and to follow a logistic distribution. Fol-lowing standard practice in multilevel modelling (Snijders & Bosker, 1999) the person specific error terms (ζi) are
as-sumed to be i.i.d. normal with mean zero and varianceσ2
ζ.13
The variability of the response variable with elapsed time is modelled by includingtimespanas a predictor.
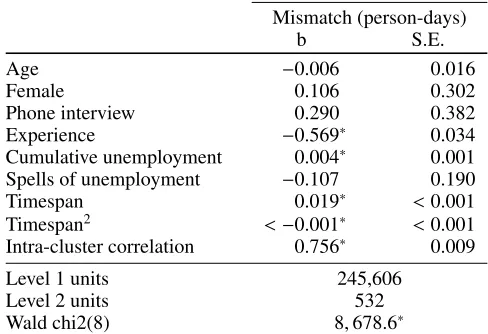
Results from the model are presented in Table 4. Higher levels of work experience were associated with lower propensities of observing mismatches between the survey and the register, which supports hypothesis 3 on the level of embeddedness in the labour market. On the other hand, cumulative unemploymentis associated with an increase in the propensity to mismatch. This finding reinforces the con-tradiction seen before, warning us against making any strong claims on the effect of the stigma of being unemployed (hy-pothesis 4) on the accuracy of reports. Finally, the estimates for timespan show the expected quadratic effect anticipated in Figure 4, which supports the argument on the propagation of errors from previous spells, contradicts other views on the topic (such as Bound et al. (2000), or Solga (2001)) that assumed independence of errors across the window of obser-vation, and raises some questions about whether hypothesis 1 (on the effect of time on ME) can be supported as it is currently worded.
6. Conclusion
We have assessed both the prevalence and nature of the underlying mechanisms associated with ME in retrospective reports of unemployment. We have done so by implementing an original approach which analyses different ways of oper-ationalizing ME when validation data is available. We ac-knowledge that, for the survey question under consideration, ME can either be misclassifications or misdates of the spells reported. However, because of the identification problem de-rived from the propagation of errors across time, the analysis of these forms of ME had to be restricted to the first spells reported. In the second part of the analysis we extended the study to the rest of the spells found within the window of observation by using forms of ME that can be observed at the work history level. These are: omission of spells, misre-ports of aggregated durations, and mismatches of person-day cases. In doing so we have combined and elaborated Math-iowetz and Duncan’s (1988) analysis, where only the preva-lence of mismatches of observations was modelled, and Pyy-Martikainen and Rendtel’s (2009) study where only omission of spells and underreported durations were modelled.
[image:8.612.310.554.121.288.2]For the LSA-1993 question, which involves recalls of 12 to 15 months, we found that 74% of the end dates of first un-employment spells reported were misdated by more than±15 days, while 30% of the subjects misclassified the work status of all the first spells. We also saw a tendency to omit the number of spells experienced; in particular only 54% of the
Table 4 Estimates and standard errors from the random effects logit model for mismatch
Mismatch (person-days)
b S.E.
Age −0.006 0.016
Female 0.106 0.302
Phone interview 0.290 0.382
Experience −0.569∗ 0.034
Cumulative unemployment 0.004∗ 0.001
Spells of unemployment −0.107 0.190
Timespan 0.019∗ <0.001
Timespan2 <−0.001∗ <0.001
Intra-cluster correlation 0.756∗ 0.009
Level 1 units 245,606
Level 2 units 532
Wald chi2(8) 8,678.6∗
∗
p<0.05
The estimated regression coefficients represent the effect ceteris paribus of a unit change in the variable on the log-odds of mismatch. Source: PRESO and LSA-1993.
subjects reported the correct number of spells of unemploy-ment, with that figure plummeting to 7.5% when the recall time was extended to 11 years. Finally, the mean duration of the total time reported in unemployment in the survey was 73% of the length of the time captured in the register while the percentage of person day cases reported that matched the status found in the register was 66%.
Some of the forms of ME analysed here use the same level of measurement that are typical of variables derived from retrospective reports of events. For example, the mis-count of the number of spells has direct implications if work histories are to be used in count data analyses (e.g. a Pois-son model), misreporting spell lengths affects models relying on duration data (e.g. event history analysis for continuous data such as the accelerated failure time Weibull model), and mismatches of person-period observations affects data in cat-egorical form (e.g. event history analysis for discrete data such as the proportional odds model). Hence, quantifying the prevalence of ME in multiple forms serves the purpose of making users of this type of data aware of the magnitude of the problem.
However, the main contribution of this paper stems from a better understanding of the mechanisms underlying the generation of ME in retrospective questions. This study
resents the first analysis using a validation design that models forms of ME directly operating at the spell level. Moreover, the inclusion of models specifying additional forms of ME operating at the work history level makes the analysis more exhaustive than previous studies of the topic.
Returning to the hypotheses set out at the start of this paper, we conclude:14
Hypothesis 1 specified that the probability of generating ME in any form is positively associated with the elapsed time between the interview and the event reported. We found that while this statement is true between questions, it is not nec-essarily so within questions. For example, when comparing the main question with another one that uses a recall period 10 times longer in the study of the number of spells of un-employment reported, we found much greater prevalence of ME in the form of omission of spells of unemployment in the question using an extended recall period. However, when modelling the effect of time on the probability of misclas-sifying person-day observations for the shorter recall period we showed that its effect is not linear but quadratic. That is, periods that are further away from the interview date are not necessarily associated with higher probabilities of being misclassified.
Hypothesis 2 stated that the quality of the recall is neg-atively associated with the number of spells experienced. In our analysis, the number of spells of unemployment in-creased the propensity to misdate the ends of first spells and to omit spells of unemployment, but it was not significantly associated with all the other forms of ME. These results serve to both corroborate the hypothesis and to identify the partic-ular forms of ME which are affected by interference. In par-ticular, it is interesting to note that the lower saliency that is assumed to result from interference does not affect the prob-ability of misclassifying the first spell, whereas the length of that spell, which could also be understood as a proxy for saliency, reduced the probability of misclassifying but did not generate misdates.
Hypothesis 3 indicated that groups of the population rel-atively more embedded in the labour market differentiate bet-ter between work status categories. We found some evidence pointing in that direction, although in many instances results were inconclusive. Women had a higher propensity to mis-classify first spells, while no effect was found for the other forms of ME. This suggests that the error mechanism de-rived from lower levels of embeddedness specifically affects the capacity to distinguish between categories of work status, whereas other problems affecting the capacity to date spells correctly are common across population groups. Age was not found to be significant for any of the forms of ME. However, the validity of our findings regarding age is limited because younger and older subgroups of the population were delib-erately omitted in the sample design. Alternative evidence to test this hypothesis can be derived from the inclusion of a variable capturing the work experience of interviewees. This allows us to ascertain whether subjects who are well embed-ded in the labour market actually make better reports with-out relying on using age and gender as proxies. We find that the level of experience was negatively associated with
mis-reported durations and the probability of finding mismatched cases, thus extending the error generating mechanism postu-lated in this hypothesis to other forms of ME that were not previously associated with it.
Hypothesis 4 stated that being unemployed has a stig-matizing effect that leads to under-reports of unemployment. Our findings support but also nuance this hypothesis. We found that the longer the time spent in unemployment the lower the propensity to misdate and misclassify first spells, and to omit spells in general. Moreover, regarding the two survey modes, interviews by phone were found to increase the propensity to omit spells. However, it is important to bear in mind that survey mode was not randomly assigned to sub-jects. Also, most importantly, we need to consider that the model predicting misdates of first spells only discriminated between cases misdated by more or less than 15 days. When considering the absolute magnitude of misdates we found ev-idence of strong under-reports of time in unemployment for persons who have been unemployed longer than a year.
Finally a caveat regarding the validity of the analysis needs to be made. In theory, the use of validation data rep-resents an improvement in the study of ME in surveys com-pared to studies relying on replicated data. In practice, how-ever, that depends on how close the validation data is to the true values. In this paper we have assumed that the register data from PRESO are a gold standard, but there are reasons to suppose that this assumption might not always hold. Admin-istrative data will be affected by coding errors. Moreover, the definition of unemployment for the AMS changed in 1997, which might produce artefactual variations when analysing ME in the 2001 survey. Finally, PRESO might be prone to systematic errors in that some persons registered as unem-ployed might in fact have casual employment.
Acknowledgement
We are very grateful to the Economic and Social Re-search Council for funding the studentship that has led to writing this paper, Sten-Ake Stenberg for granting us access to data from “The Longitudinal Study of the Unemployed”, and to the anonymous reviewers for their very relevant com-ments.
References
Bound, J., Brown, C., & Mathiowetz, N. (2000). Measurement error in survey data. In J. Heckman & E. Leamer (Eds.),Handbook of econometrics(p. 3707-3745). Amsterdam: Elsevier.
Duncan, G., & Hill, D. (1985). An investigation of the extent and consequences of measurement error in labor-economic survey data.Journal of Labor Economics,3, 508-532.
Korpi, T., & Stenberg, S. (2001). Massarbetsl¨oshetens Sverige: Arbetsl¨oshetens karakt¨ar och effekter på individers lev-nadsf¨orhållanden. In J. Fritzell, M. G¨ahler, & O. Lundberg (Eds.),V¨alf¨ard och arbete i arbetsl¨oshetens årtionde(p. 31-77). Stockholm: Kommittn V¨alf¨ardsbokslut.
Levine, P. (1993). CPS Contemporaneous and retrospective unem-ployment compared.Monthly Labor Review,116, 33-39. Mathiowetz, N., Brown, C., & Bound, J. (2001). Measurement
error in surveys of the low-income population. In M. Ver Ploeg, R. Moffitt, & C. Citro (Eds.), Studies of welfare populations: Data collection and research issues(p. 157-194). Washington: Commission on Behavioral and Social Sciences and Education (CBASSE).
Mathiowetz, N., & Duncan, G. (1988). Out of work, out of mind: Response errors in retrospective reports of unemployment. Jour-nal of Business and Economic Statistics,6, 221-229.
Morgenstern, R., & Barrett, N. (1974). The retrospective bias in unemployment reporting by sex, race and age. Journal of the American Statistical Association,69, 355-357.
Paull, G. (2002). Biases in the reporting of labour dynam-ics. The Institute of Fiscal Studies Working Papers, 02/10. Retrieved 14/03/2014, from http://econpapers.repec.org/paper/ ifsifsewp/02 2f10.htm
Pyy-Martikainen, M., & Rendtel, U. (2009). Measurement errors in retrospective reports of event histories: A validation study with Finnish register data.Survey Research Methods,3, 139-155. Snijders, T., & Bosker, R. (1999). An introduction to basic and
advanced multilevel modelling. Sage: London.
Solga, H. (2001). Longitudinal survey and the study of occupational mobility: Panel and retrospective design in comparison.Quality and Quantity,35, 291-309.
Torelli, N., & Trivellato, U. (1993). Modelling inaccuracies in job-search duration data.Journal of Econometrics,59, 187-211. Tourangeau, R. (1984). Cognitive science and survey methods. In
T. B. Jabine, M. L. Straf, J. Tanur, & R. Tourangeau (Eds.), Cog-nitive aspects of survey methodology: Building a bridge between disciplines(p. 73-100). Washington DC: National Academy Press.
[image:10.612.54.297.485.591.2]Appendix
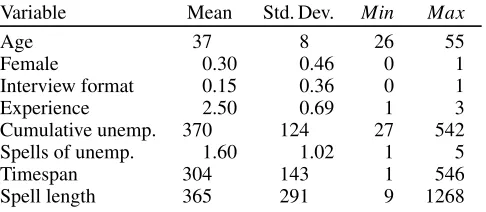
Table A.1 Descriptive Statistics of the Variables Used
Variable Mean Std. Dev. Min Max
Age 37 8 26 55
Female 0.30 0.46 0 1
Interview format 0.15 0.36 0 1
Experience 2.50 0.69 1 3
Cumulative unemp. 370 124 27 542
Spells of unemp. 1.60 1.02 1 5
Timespan 304 143 1 546
Spell length 365 291 9 1268
Source: PRESO and LSA-1993
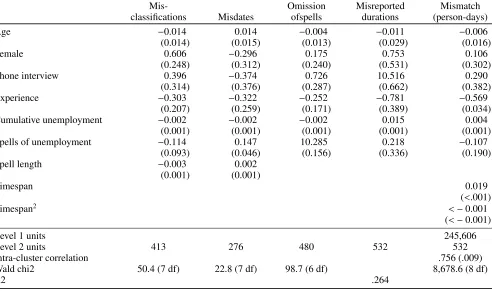
Table A.3 Summary of the Model Estimates
Mis- Omission Misreported Mismatch
classifications Misdates ofspells durations (person-days)
Age −0.014 0.014 −0.004 −0.011 −0.006
(0.014) (0.015) (0.013) (0.029) (0.016)
Female 0.606 −0.296 0.175 0.753 0.106
(0.248) (0.312) (0.240) (0.531) (0.302)
Phone interview 0.396 −0.374 0.726 10.516 0.290
(0.314) (0.376) (0.287) (0.662) (0.382)
Experience −0.303 −0.322 −0.252 −0.781 −0.569
(0.207) (0.259) (0.171) (0.389) (0.034)
Cumulative unemployment −0.002 −0.002 −0.002 0.015 0.004
(0.001) (0.001) (0.001) (0.001) (0.001)
Spells of unemployment −0.114 0.147 10.285 0.218 −0.107
(0.093) (0.046) (0.156) (0.336) (0.190)
Spell length −0.003 0.002
(0.001) (0.001)
Timespan 0.019
(<.001)
Timespan2 <−0.001
(<−0.001)
Level 1 units 245,606
Level 2 units 413 276 480 532 532
Intra-cluster correlation .756 (.009)
Wald chi2 50.4 (7 df) 22.8 (7 df) 98.7 (6 df) 8,678.6 (8 df)
.1
.2
.3
.4
.5
0 1 2 3 4 5 6 0 1 2 3 4 5 6
Survey Register
Probability mass
[image:13.612.314.553.84.261.2]Number of spells
Figure A.1.Histograms of the reported and registered spells of un-employment in LSA-1993
.05
.1
.15
.2
.25
0 3 6 9 12 15 18 21 24 0 3 6 9 12 15 18 21 24
Survey Register
Probability mass
Number of spells
Figure A.2.Histograms of the reported and registered spells of un-employment in LSA-2001
0
.0005
.001
.0015
.002
.0025
Probability density
0 200 400 600 800 1000 Registered duration of spells
[image:13.612.56.294.92.261.2]Survey Register
Figure A.3.Probability density function of the aggregated durations of unemployment in LSA-1993
0
.2
.4
.6
.8
1
Survival probability
0 100 200 300 400 500 Timespan
Survey Register
[image:13.612.316.552.289.459.2] [image:13.612.55.295.298.467.2]