open cell foams
Sararat Mahasaranon, Kirill V. Horoshenkov, Amir Khan, and Hadj Benkreira
Citation: J. Appl. Phys. 111, 084901 (2012); doi: 10.1063/1.3701710
View online: http://dx.doi.org/10.1063/1.3701710
View Table of Contents: http://jap.aip.org/resource/1/JAPIAU/v111/i8
Published by the American Institute of Physics.
Related Articles
Broadband sound absorption by lattices of microperforated cylindrical shells Appl. Phys. Lett. 101, 184101 (2012)
Unidirectional acoustic transmission based on source pattern reconstruction J. Appl. Phys. 112, 064504 (2012)
Beaming of inplane elastic waves through a subwavelength channel with periodic corrugations Appl. Phys. Lett. 101, 124101 (2012)
Producing an intense collimated beam of sound via a nonlinear ultrasonic array J. Appl. Phys. 111, 124910 (2012)
Acoustic transmission through asymmetric grating structures made of cylinders J. Appl. Phys. 111, 094505 (2012)
Additional information on J. Appl. Phys.
Journal Homepage: http://jap.aip.org/
Journal Information: http://jap.aip.org/about/about_the_journal
Top downloads: http://jap.aip.org/features/most_downloaded
The effect of continuous pore stratification on the acoustic absorption
in open cell foams
Sararat Mahasaranon, Kirill V. Horoshenkov, Amir Khan, and Hadj Benkreira
School of Engineering, University of Bradford, Bradford, West Yorkshire BD7 1DP, United Kingdom
(Received 23 June 2011; accepted 6 March 2012; published online 16 April 2012)
This work reports new data on the acoustical properties of open cell foam with pore stratification. The pore size distribution as a function of the sample depth is determined in the laboratory using methods of optical image analysis. It is shown that the pore size distribution in this class of materials changes gradually with the depth. It is also shown that the observed pore size distribution gradient is responsible for the air flow resistivity stratification, which is measured acoustically and non-acoustically. The acoustical absorption coefficient of the developed porous sample is measured using a standard laboratory method. A suitable theoretical model for the acoustical properties of porous media with pore size distribution is adopted. The measured data for open porosity, tortuosity, and standard deviation data are used together with this model to predict the observed acoustic absorption behavior of the developed material sample. The transfer matrix approach is used in the modeling process to account for the pore size stratification. This work suggests that it is possible to design and manufacture porous media with continuous pore size stratification, which can provide an improvement to conventional porous media with uniform pore size distribution in terms of the attained acoustic absorption coefficient.VC 2012 American Institute of Physics. [http://dx.doi.org/10.1063/1.3701710]
I. INTRODUCTION
Acoustic materials are used extensively to control the lev-els of noise. Porous absorbers represent a most common class of acoustic materials, which are able to absorb noise in a broad frequency range. A major drawback of conventional porous absorbers is their poor performance in a low frequency range, where the acoustic wavelength is greater than the thickness of the porous layer. In order to improve the low-frequency absorption performance of porous layers, it is common to com-bine several layers with homogeneous pore structure in a stack to reduce the mismatch between the acoustic impedance of air and the input impedance of the resultant material stack.
The benefit of having an acoustic layer with pore stratifi-cation has been well understood. As a result, there has been a number of theoretical works which studied the acoustic performance of materials with stratified porous structure. Brouardet al.1developed further a standard transfer matrix approach with a focus on the acoustical properties of layered porous media. Their approach is based on the construction of interface matrices that contain sufficient details on the stresses, pressures, and displacement at the boundaries between the layers. De Rycket al.2proposed a model for po-rous media in which the key parameters of pore space are depth dependent. This model was validated against experi-mental data obtained for a stack of two layers of foams with uniform open cells, markedly different flow resistivities, and similar porosities. More recently, a similar model based on the wave splitting method was used successfully to recon-struct the stratification in the key parameters of the pore space in an inhomogeneous porous material from synthetic data on its acoustic reflection coefficient.3
However, there has been a lack of experimental evidence demonstrating that materials with stratified pore structure can
actually be produced to provide an improvement to conven-tional homogeneous porous layers used for the purpose of noise control. The main focus of this paper is to present new experimental data that illustrate that materials with continuous pore stratification can be produced and characterized with a suitable theoretical model. The paper describes a novel method to produce porous media with continuous pore stratifi-cation, details an experimental methodology for material char-acterization, and examines a model for the prediction of the acoustical properties of the resultant material.4The proposed model is based on the pore size distribution data, which is a key non-acoustical property that controls the acoustical behav-ior of the obtained material specimen.
II. EXPERIMENTAL METHODOLOGY A. Materials and sample preparation
Material samples studied in this work were made using a blend of polyurethane (PU) binder (XP 2261) supplied by Chemique Adhesive and Sealant Ltd., low molecular weight polyol (Flexilon 1117) supplied by Rosehill Polymers Ltd., and tire shred residue. Tire shred residue was supplied by Credential Tire Recycling Ltd. and comes in a granulated form, a mix of nylon fibers and rubber grains bonded to the fibers, as illustrated in Fig.1. The sieve analysis data for tire shred residue was per-formed to determine the fiber and grain size distribution. The probability density function (PDF) for the fiber/grain weight dis-tribution analysis is shown in Fig.2, which suggests that a ma-jority of fibers and grains fall into the 0.25–5.0-mm size range. Water was added to this mix to activate the PU polymerization reaction. TableIpresents data on the composition of the mate-rial mix studied in this work.
The frame of these materials is typically made of an elas-tomer with recycled matter integrated in a matrix. The nature
0021-8979/2012/111(8)/084901/10/$30.00 111, 084901-1 VC2012 American Institute of Physics
of the elastomer influences directly the properties of the thick-ness of the pore frame, such as the hardthick-ness, the elasticity, and the fatigue. Pore frame thickness, overall pore size, size of the pore opening, and the material density are all related. An increase of the material density leads to an increase of the thickness of the pore frame, and, hence, a decrease of the pore opening and the air content in the material. During the foam-ing process, the pores remain closed; otherwise, the gas would escape and the material would not grow anymore. However, at the end of the foaming process, the membranes of the pores blow open, at least partially. This is an essential step in the production of flexible materials with a large proportion of interconnected pores. If the pore remains closed, the material would shrink during the cooling, since the material formation is an exothermic process and the temperature inside the mate-rial can easily reach 100C. The ratio between closed and open pores affects the physical properties of the material, such as the acoustic performance and thermal insulation. The car-bon dioxide creates the unique pore size distribution, which can be effectively controlled by varying the parameters of this process. When the reaction begins, the mixture is a viscous
liquid, and any carbon dioxide that is produced bubbles away. But as the reaction progresses and molecular weight increases, the mixture becomes more and more viscous until it becomes a solid. When this happens, the carbon dioxide bubbles are trapped in the viscous liquid, they stay there trapped, and it is these bubbles that give the material its porosity.
The components listed in TableIwere mixed in a mixing bowl with a spatula for 60 seconds. The time selected for the mixing operation was found sufficient to ensure good mixing of the ingredients in the mix and adequate level of aeration that was needed to help to initiate the polymerization reaction. The resultant mixture was poured in a cylindrical mold with a termi-nated bottom and an open top. The diameter of this mold was 100 mm and its height 150 mm. In this way, the polymerization reaction occurred in a container with the top surface vented to the atmosphere and the bottom sealed. Oxygen in the atmos-phere helped to decrease the reaction time at the surface of the material created in this mold. The reaction time here relates directly to expanding time in the foaming process. A shorter expanding time from a fast reaction of the foaming processes results in smaller pores in the top layer of the material. Carbon dioxide (CO2) products of the slower reaction at the bottom of
the mold can be trapped by the top layers in the mold, which solidify more rapidly. Therefore, a slower polymerization reac-tion at the bottom of this mold has a longer expanding time, resulting in larger pore sizes. It was estimated that the reaction took on average of 60 min to complete, resulting in a fully con-solidated sample of foam with the stratified pores.
The fully consolidated porous sample was then removed from the cylindrical mold. The top surface of this sample was uneven, and the bottom surface contained an impervious residual layer. These were trimmed with a sharp knife to form a 140-mm-long porous cylinder with flat top and bottom surfaces. Photographs of the resultant material sample are shown in Fig.3.
B. Material characterization methods
[image:3.612.65.286.63.226.2]The material characterization was carried out in two phases: The first phase of experiments was to measure the
FIG. 1. A microscopic image of tire shred residue material used for manu-facturing samples with pore stratification.
[image:3.612.315.562.76.170.2]FIG. 2. The probability density function of the particle size distribution (by mass) in tire shred residue material.
TABLE I. The composition of the material mix.
Ingredients Amount (kg)
4,4-Methylene diphenyl diisocyanate (MDI) 0.10
Polyol 0.04
Water 0.04
Tire shred residue 0.04
Total
0.220 kilograms (volume¼157 000 mm3)
[image:3.612.53.296.545.739.2] [image:3.612.316.564.667.742.2]acoustical properties of the 140-mm-long, porous cylinder in direct and reverse orientations. This experiment was carried out in a 100-mm-diameter, two-microphone Bruel & Kjael (BK4206) impedance tube at normal angle of incidence and in the frequency range of 50–1600 Hz using the standard procedure detailed in Ref. 5. The direct orientation corre-sponded to the case when the acoustic excitation in the im-pedance tube was applied to the top surface of the sample, which contained smaller pores. The reverse orientation was the opposite, i.e., when the acoustic excitation was applied to the bottom surface containing larger pores. The second phase of experiments was to divide the porous cylinder into four equal parts: sub-layers A, B, C, and D, each having a thick-ness of 35 mm. The choice of dividing the original 140-mm-thick sample into four sub-layers can be explained by the following reasons: (i) the residual level of stratification within each of the four sub-layers is expected to be relatively small; (ii) the thickness of each of the four sub-layers is expected to be much greater than the maximum pore size in the material; and (iii) the thickness of each of the four sub-layers is expected to be large enough to allow for accurate measurements of the acoustical and non-acoustical properties using the standard material characterization methods. The acoustical properties of each of these four sub-layers were then measured in the impedance tube in the direct and reverse orientations to study the effect of pore stratification. Figure4shows a photograph which illustrates the principle
behind the process of dividing the 140-mm material speci-men into individual sub-layers. The arrows shown in this photograph correspond to the normal (direct) orientation of the porous sample.
The flow resistivity, porosity, and pore size distribution of the four porous sub-layers was also measured. The flow resistivity was measured using a standard ISO 9053 method detailed in Ref. 6. The porosity was measured using the method proposed by Leclaire.7This method was applied to 29-mm-diameter specimens, which were cut from sub-layers A, B, C, and D once all other experiments were completed. The tortuosity was measured using the ultrasonic time of flight method and equipment detailed in Ref.8. The material density was measured by weighing each sample on labora-tory scales, then dividing the recorded sample mass by the volume. The pore size distribution was measured with an optical method used in our previous studies (e.g., Ref. 9). Figure 5 shows microscopic photographs of the top and bottom surfaces of sub-layers A, B, C, and D. These images were analyzed using Optimax image analysis software.10For this purpose, five 20 mm20 mm non-equidistantly spaced areas on each of the eight images were selected so that the mean pore size distribution for each of the eight surfaces of the four material specimens could be determined. Table II shows the relative positions on the sample surface at which these areas were selected. Fig.6illustrates the process of the area selection for the image analysis.
[image:4.612.78.270.62.193.2]The pore size distribution was then obtained by enhanc-ing the microscopic photographs of the porous surfaces of the four material specimens and fitting a centroid to each of the pores identified in these photographs to determine its size. The effective radius of the pore is that of a circle with an area equivalent to the actual area of the pore. In this work, the pore size distribution of the developed samples
FIG. 4. A schematic illustration of the process of division of the material sample into 4 sub-layers.
FIG. 5. Photos of the top and bottom surfaces of the four sub-layers: (a) sub-layer A (top); (b) sub-layer A (bottom); (c) sub-layer B (top); (d) sub-layer B (bottom); (e) sub-layer C (top); (f) sub-layer C (bottom); (g) sub-layer D (top); and (h) sub-layer D (bottom).
TABLE II. The positions of areas on the image selected for the pore size distribution analysis and co-ordinates of their centers.
Area label P1 P2 P3 P4 P5
Co-ordinates (x,y), (mm)
(0,0) (12.5,0) (37.5,0) (0,25) (0,16.7)
[image:4.612.314.561.86.137.2] [image:4.612.96.516.580.740.2]was measured optically by using the Optimax software. The software was calibrated using an image of a 1-mm graticule taken at 2.5magnification under a microscope. This enabled accurate measurement of the pore size and pore location. The Optimax software was configured so that the region of interest was the entire image, from which the pore diameter and area was extracted. Within this software, an image threshold was set to enable the software to focus on the pores that were present in the foreground and to exclude the fainter background frame (see Fig.7).
This threshold is very much dependent on the lighting conditions used when the image is taken. Therefore, the lighting conditions are kept constant when the images were taken under the microscope for the analysis. From these data, the pore size distribution is determined based on the av-erage pore diameter from the pore centroid. The process of calculating the equivalent pore diameter is based on finding the centroid and the average of the diameters taken at 2 degree intervals and passing through this centroid, as illus-trated in Fig.7.
An alternative indicator of the equivalent pore size is the cross sectional area of a pore. The pore size distribution histogram is then constructed by placing the pores of the same size into individual bins. The number of samples in each of the bins is counted, and the data is normalized by dividing by the total number of pores, such that the total area in the histogram (i.e., the integral of the PDF) is equal to one. The pore size distribution data obtained via this method were also to estimate the standard deviation in the pore size.
C. Non-acoustical properties of the porous sample with stratification
TableIIIpresents a summary of the flow resistivity, poros-ity, and density for sub-layers A, B, C, and D, which were
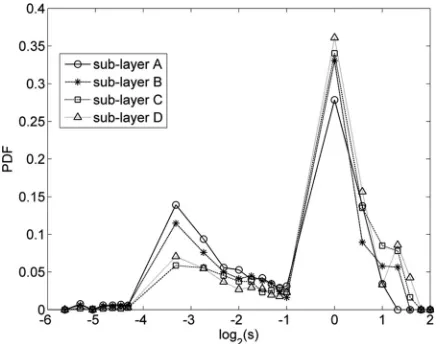
measured directly using the methods detailed above. Figure8 presents the mean values of the probability density function for the pore size distribution data for the four porous sub-layers. These results were obtained by averaging over the 10 sets of pore size distribution data that correspond to the five images taken on the top and five images taken on the bottom surfaces of the porous specimen, as explained in Fig. 6. The PDF data here are plotted as a function of the equivalent pore diameter (s), which was estimated according to the procedure described in the previous paragraph. The pore size distribution data illustrate clearly that the proportion of larger pores increases with the increase sample depth. In the case of the top sub-layer (layer A), the pore size distribution is clearly bi-modal and it peaks around 1 mm (meso-pores) and 0.1 mm (micro-pores). In the case of the bottom layer (layer D), the pore size distribution is more close to log-normal and it peaks around 1 mm only. Between these two sub-layers, there is a clear transition in the pore size distribution function from the bi-modal (layer A) to log-normal (layer D), as illustrated by the data presented in Fig.8.
[image:5.612.327.549.62.175.2]The presented data for pore size distribution illustrate that the slower polymerization reaction results in pores of a larger size, whereas the faster polymerization reaction results in a higher proportion of smaller pores and broader pore size distribution. As a result, the porous structure appears clearly heterogeneous, i.e., there is a clear stratification in the pore size as a function of the layer depth. The observed pore size stratification has an influence on the values of the flow resis-tivity, density, porosity, tortuosity, and standard deviation of the pore size, which are listed in TableIII for the four sub-layers. The flow resistivity, density, and tortuosity of the ma-terial sample decrease with the increasing layer depth (see TableIII). The greatest effect of the observed material strati-fication is on the flow resistivity, which appears to undergo a
FIG. 6. Location of areas which were used in the optical analysis of the pore size distribution.
[image:5.612.52.297.64.185.2]FIG. 7. An enhanced image of the surface of a porous layer highlighting the pores used in the optical analysis of the pore size distribution (left) and the illustration of the process of finding the equivalent pore diameter.
TABLE III. A summary of experimental measurements.
Sample depth (mm)
Flow resistivity
r, (N.m.s4)
Porosity
/
Density
kg/m3 Tortuosity
Standard deviation of pore size
Layer A 17.5 81 729 (6215) 0.91(60.47) 132(62) 6.27(60.13) 0.20(60.01)
Layer B 52.5 64 415 (6586) 0.91(60.28) 130(60.5) 2.41(60.23) 0.30(60.03)
Layer C 87.5 32 029 (6200) 0.92(60.15) 123(61) 2.06(60.13) 0.24(60.03)
[image:5.612.52.563.679.764.2]5.9-fold (590%) change between the top and the bottom layers of the material sample. The difference in the tortuosity between the top side of the sample (sub-layer A,a1 ¼6.27) and its bottom side (sub-layer D,a1¼1.56) is very large. The impact of the material stratification on the density and porosity
is smaller, and it is within 21% and 3%, respectively. The po-rosity increases slightly with the increased layer depth, which can be explained by a higher proportion of larger pores and lower percentage of smaller pores, which collapsed fully or partly during the polymerization process, resulting in a thicker porous frame and a larger proportion of partly closed pores. Standard deviations of pore size for top side (sub-layer A) and bottom side (sub-layer D) have lower value than the middle sub-layer (sub-layers B and C), and sub-layer B has the highest value of standard deviation of pore size.
Figure9illustrates graphically the behavior of the four non-acoustical parameters measured directly. The following conclusions can be drawn from these results: Firstly, the directly measured value of the flow resistivity, when plotted on the logarithmic scale, decreases almost linearly with the increased layer depth (see Fig. 9(a)). Secondly, the value of the measured tortuosity is relatively high and it cannot be explained by the well-known expression proposed by Berry-man,11 given a relatively high value of porosity, for which
a1!1 is commonly expected, i.e.,
a1 ¼1þ
1/
[image:6.612.65.287.62.234.2]2/ : (1)
FIG. 8. The probability density function of the pore size distribution for each of the four sub-layers. The pore diametersis taken in millimeters.
FIG. 9. The dependence of the (a) flow resistivity, (b) porosity, (c) tortuosity, and (d) standard deviation on the sample depth.
[image:6.612.57.559.315.747.2]According to this formula, the tortuosity for materials having the mean porosity values shown in TableIIIshould be in the range 1:10a11:29. The high values of tortu-osity deduced in this work can be attributed to a relatively large proportion of partly closed pores in the manufactured material structure and to a more complex interconnectivity between pores of different sizes, as illustrated in Figs.5(a) and5(b). A study on linking the closed cells of polyurethane foams and their sound absorption efficiency has been carried out by Olivieret al.12This pore morphology can be difficult to characterize directly using 2D images. However, it is reflected well in the high tortuosity values deduced with the direct acoustic characterization method. The deduced value of tortuosity reduces by 34% in the case of sub-layer D, in which the interconnectivity of the pore structure is relatively high (see also Figs.5(g)and5(h)). Thirdly, the behavior of the deduced values of standard deviation for the material pore size,ru, is rather complex and it is difficult to relate to the pore size distribution data presented in Fig.8. In the case of sub-layer A, which (according to Fig.8) is characterized with a relatively broad pore size distribution, the deduced standard deviation in the pore size is low. The highest value of the deduced standard deviation corresponds to sub-layer B. After sub-layer B, the standard deviation in the pore size reduces consistently with the increased sample depth. This pattern in the behavior of the standard deviation can be attributed to the complexity in the pore size distribution, existence of a proportion of closed or partly closed pores, pore size stratification with the depth, and to the quality of the pore size distribution data, which depends on the image contrast and software settings. The image analysis has been
applied to photographs taken on the surface of the examined material samples. It is unclear whether or not 2-D images can provide a very accurate representation of a stratified 3-D pore structure in which a majority of pores are hidden below the surface. X-ray micro-tomography studies have been made by Boeckxet al.13who studied the effect of 3D geom-etry of the microstructure of partially closed cell foams on sound absorption.
D. Acoustical characteristics of the porous sample with stratification
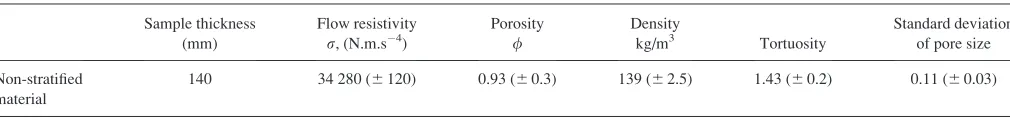
The theoretical work presented in Refs.1–3suggests that the stratification in the pore structure of a porous material must have significant effects on its acoustic absorption coeffi-cient. It can be assumed that the absorption coefficient is likely to depend on the sample orientation when it is subjected to an incident sound wave. The effect of the pore stratification is shown in Fig. 10, which presents the acoustic coefficient spectra measured for the top and bottom sides of the material sample with stratification. A 20–30% difference in the absorp-tion coefficient measured in the direct and reverse orientaabsorp-tions is observed. As a comparison, this figure also presents the acoustic absorption coefficient of a non-stratified porous sam-ple prepared using an adhesive with polyol of a higher molec-ular weight. The directly measured non-acoustical parameters of the non-stratified material sample are given in Table IV. We note that the values of the non-acoustical parameters of this material fall within the range of those characteristic to the material with pore stratification (see TableIII).
[image:7.612.53.297.62.258.2]It is evident that the absorption coefficient of the material sample with pore size stratification measured in the reverse orientation is 10–20% higher than that measured in the case of the non-stratified material sample of the same thickness and comparable values of the four non-acoustical parameters. This enhancement is particularly pronounced in the low frequency range, in which it is rather problematic to achieve a high value of acoustic absorption coefficient without increasing the layer thickness. It is clear that the absorption coefficient measured from the bottom side of the stratified material sample (layer D), with a greater proportion of larger pores exposed to the incident sound wave in the impedance tube, is 25–30% higher than that measured in the case when the sound wave was inci-dent on the top side of this sample, with a greater proportion of smaller pores. This difference is largely explained by the gradient in the pore size distribution in the material sample that is illustrated in Fig.8. A higher absorption coefficient can be attained when the acoustic surface impedance of the porous sample is close to the impedance of air. A good acoustic im-pedance match can be achieved when a layer with a lower flow resistivity (larger pores) and higher porosity is exposed
FIG. 10. Comparison graph of stratified material with non-stratified material in normal and reverse orientations.
TABLE IV. A summary of experimental values for the non-stratified material.
Sample thickness (mm)
Flow resistivity
r, (N.m.s4)
Porosity
/
Density
kg/m3 Tortuosity
Standard deviation of pore size
Non-stratified material
[image:7.612.54.559.705.765.2]to the incident sound wave. Therefore, a positive flow resistiv-ity gradient (from low to high) and negative porosresistiv-ity gradient (from high to low) clearly results in a better acoustic absorption performance than that obtained when these dependencies are reversed. On the contrary, the absorption coefficient spectrum of the non-stratified porous sample is relatively independent of the sample orientation. The absorption coefficient spectrum for this sample is noticeably lower than that measured in the case of the stratified material sample in the reverse orientation.
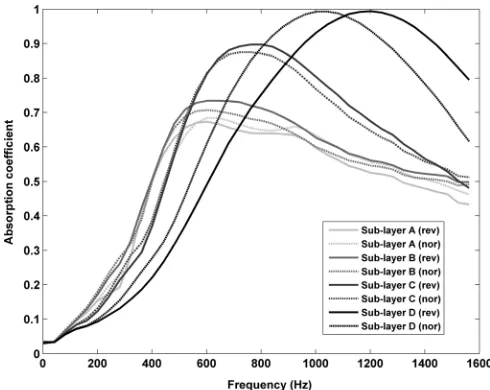
In order to understand better the effect of the pore strati-fication on the resultant acoustical properties, the absorption coefficient of the four sub-layers (layers A-D) was measured according to the acoustical method detailed in Sec.II (see also Ref.8). Figure11 presents the results of these experi-ments that illustrate the following three phenomena: Firstly, there is still some difference between the absorption coeffi-cient spectra measured for a given material specimen in dif-ferent orientations. This is a clear indication of some residual stratification within each of the four sub-layers. This stratifica-tion is particularly pronounced in the case of sub-layer D, which was cut from the bottom of the developed material sample. Material in sub-layer D consists mainly of meso-pores, as illustrated in Fig.8. The degree of this stratification (i.e., the stratification rate) reduces with the reduced layer depth, i.e., it is less pronounced in the case of sub-layer A, which was cut from the top of the developed material sample. The degree in stratification is likely to be controlled by the rate of polymerization reaction, which changes exponentially with the layer depth. In particular, the rate of reaction (r) can be defined in terms of the change in the concentration of reac-tantd½Aor productd½Bduring an interval of timedt,
r¼ d½A dt ¼
d½B
dt : (2)
Secondly, the maximum of the absorption coefficient spectra moves to the higher frequency with the increased layer depth. This is explained by the apparent increase in the proportion of meso-pores and the associated reduction in the flow resistivity. Thirdly, there is less variation in the absorption coefficient
spectra for those layers which are close to the top of the devel-oped material sample. This is explained by the bi-modal pore size distribution (see Fig.8) and more complex pressure diffu-sion effects that were studied theoretically by Olny and Boutin14and observed experimentally in Ref.9. Larger pores (meso-pores) are present in the top and bottom layers. How-ever, the pore size distribution in the top layers is more close to bi-modal (see Fig.8). There are more smaller pores in sub-layer A, resulting in a lower overall permeability and more pronounced pressure diffusion effects.9
III. THEORETICAL BACKGROUND
In the previous sections it has been illustrated that the developed porous sample consists of pores in which size varies considerably between the four individual layers. As a result, its absorption coefficient depends on the sample orien-tation and a suitable model is needed to account for a range of pore sizes in the developed porous structure. It is attrac-tive to understand how well a relaattrac-tively simple model is able: (i) to predict the acoustical properties of individual sub-layers and (ii) to be used with a well-known transfer-ma-trix approach to predict the absorption coefficient of the developed material sample with a clear pore size gradient. A theoretical model which can take into account a pore size distribution was proposed and validated by Horoshenkov and Swift.4According to this model, the acoustical properties of a porous medium can be predicted accurately if the pore size,s, follows a log-normal distribution, i.e., when the prob-ability density function for the pore size is given by
eðsÞ ¼fðuÞdu
ds; (3)
where
fðuÞ 1
ru
ffiffiffiffiffiffi
2p
p e
ðu<u>Þ2
2r2u (4)
is a Gaussian function with u¼ log2sbeing the pore size, hui ¼ log2hsi being the median pore size, and ru being the standard deviation in terms ofu, which is a measure of the deviation in the pore sizes. In this case, the characteris-tic impedance and wave number for sound propagation in a medium with pores which size follows fðuÞ law can be found as
zb¼
xqbðxÞ
kbðxÞ
¼ ffiffiffiffiffiffiffiffiffiffiffiffiffiffiffiffiffiffiffiffiffiffiffiffiffiffiqbðxÞ=cbðxÞ p
; (5)
kb¼x
ffiffiffiffiffiffiffiffiffiffiffiffiffiffiffiffiffiffiffiffiffiffiffi
qbðxÞcbðxÞ
p
; (6)
respectively. Here, cbðxÞ ¼/cxðxÞ is the bulk medium
complex compressibility and
cxðxÞ ¼
1
cP0
cq0ðc1Þ
qxðNprxÞ
(7)
[image:8.612.50.295.61.256.2]is the complex compressibility of air in a single pore. In expression (7),P0 is the atmospheric pressure,cis the ratio FIG. 11. The absorption coefficient spectra for sub-layer A, B, C, and D in
normal (nor) and reverse (rev) orientations.
of specific heat,q0 is the equilibrium density of air,Npr is
the Prandtl number, and qx¼qbðxÞ/=a1 represents the effective dynamic density of fluid in a single pore. The bulk dynamic density is given by
qbðxÞ ¼
a1
/ q0
/r
ixa1
FðxÞ
; (8)
whereu is the porosity,a1 is the tortuosity, and r is the flow resistivity.FðxÞin expression (8) is the Biot viscosity correction function, which can be represented by a simple Pade´ approximation, as proposed in Ref.3,
FðxÞ ffi1þa1eþa2e 2
1þb1e
: (9)
In the above expression, the coefficients a1 ¼hh12, a2 ¼h2,
and b1¼a1 are real, positive coefficients in the Pade´
approximation ande¼ ffiffiffiffiffiffiffiffiffiffiffiffiffiffiffiffiffiffiffiffiffiffiffiffiffiffiffiffiffiffiffiffiixq0a1=ðurÞ
p
. The values ofh1
andh2 depend on the assumed pore geometries. The choice
of pore geometry has relatively little difference on the pre-dicted acoustical properties, and in this work, the triangular pore geometry is assumed. In the case of triangular pores, these are given by
h1¼
10 7 e
4n1; (10)
h2¼
ffiffiffi
3 5
r
en; (11)
wheren¼ ðr/ln2Þ2 is a measure of the deviation from the mean pore size.
The absorption coefficient for a hard-backed material spec-imen can then be calculated from the following expression:
a¼1
zs
1 zsþ1
2
; (12)
wherezsis the normal acoustic surface impedance of a
hard-backed porous layer of thicknessd,
zs¼ ðqb:cÞ
1
zbcothðikbdÞ: (13)
The above model can capture accurately the behavior of those sub-layers where the pore size distribution obeys the log-normal law. In the case of the developed porous material sample, the model works well for all the sub-layers, which mainly consist of meso-pores with the mean radius of 1 mm (see Fig.12). In the case of the upper sub-layers with a pro-nounced bi-modal pore size distribution (sub-layers A and B), this model can still provide a good fit to the data. This can be associated with a relatively high flow resistivity of these layers, which means that the effect of micro-pores is dominating and that the distribution of these pores is of pri-mary importance to the proposed model.
IV. ACOUSTICAL MODELING OF POROUS MEDIA WITH STRATIFICATION
[image:9.612.51.365.489.765.2]The above model was used to predict the acoustic absorption coefficient of each of the four sub-layers in which the stratified porous material was divided. Figure12presents a comparison between the measured and predicted absorp-tion coefficient spectra for sub-layers A-D in the direct and reverse orientations. These graphs also present the relative error between predicted and measured absorption coefficient spectra. This error was calculated using the following expression:
E¼
PN n¼1
jaexpð
fnÞ athðfn;x0Þj
PN n¼1
aexpðf
nÞ
100%; (14)
where the parameter vectorx0¼ fr;/;a1;rsgin expression
(14) is composed of the four mean values of the non-acoustical parameters listed in Table III. This comparison enables us to draw the following conclusions: (i) despite a rel-atively small residual stratification within each of the sub-layers, the adopted model can capture accurately their acous-tic absorption behavior, which is measured in the direct and reverse orientations; (ii) modeling of the acoustical properties of the porous sub-layer with the smallest pores (sub-layer A) requires a relatively high value of tortuosity (a1 >3); (iii) the adopted value of tortuosity is determined directly and reflects the complexity of the pore structure within the devel-oped material sample; and (iv) because the model predicts well the acoustical properties of each of the four material specimens, there is an opportunity to adopt a relatively simple transfer matrix model (e.g., Ref.15) to predict the absorption coefficient of the whole material sample with stratification.
The non-acoustical characteristics obtained in TableIII were used to predict the acoustic absorption coefficient of the material sample with pore stratification. The acoustic absorption coefficient was predicted using a standard transfer matrix approach, which is based on the recursive application of the following expression for the input impedance of then -th layer in a stack:15
zðinnÞðxÞ ¼zn
zðinn1ÞzntanhðiknhnÞ
znz
ðn1Þ
in tanhðiknhnÞ
: (15)
In expression (15),zn,kn, andhnare the characteristic
imped-ance, wave number, and the thickness of then-th layer. This formula is applied recursively starting with bottom layer 1, which typically rests on a perfectly reflecting wall or is loaded with a semi-infinite air space. In the case of the rigid termination, the impedance at the interface between the bot-tom of the 2nd layer and the top of the 1st layer in the stack is given byzðin1ÞðxÞ ¼z1cothðik1ðxÞh1Þ. The characteristic
impedance and the wave number in Eq. (15)can be deter-mined from expressions (5) and (6) using the averaged val-ues of the four non-acoustical parameters listed in TableIV. The absorption coefficient can then be calculated from
a¼1
zðin4Þ1
zðin4Þþ1
2
: (16)
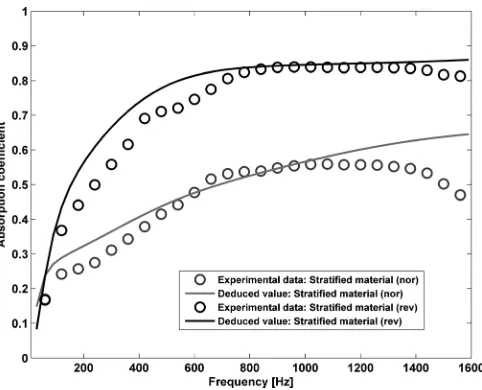
A comparison between the absorption coefficient for the 140-mm material sample with pore stratification predicted by expression (16) and the absorption coefficient for this ma-terial sample measured in the impedance tube is presented in Fig.13. A piece-wise homogeneity in each of the four sub-layers was assumed. The proposed model made use of the averaged values of the four non-acoustical parameters listed in Table III. It is clear that the model captures closely the differences between the absorption coefficient data obtained
for the two sample orientations. In this respect, the model dis-criminates well between the two possible gradients in pore size stratification, suggesting that a higher absorption can be achieved if the flow resistivity increases with the increased sample depth. The performance of the model is particularly good in the middle frequency range (between 600 and 1400 Hz). There is a noticeable discrepancy between the meas-ured and predicted absorption coefficient in the low (below 600 Hz) and high (above 1400 Hz) ranges. These discrepancies can be explained by the limits of the piece-wise homogeneity assumption and by the failure of the adopted theoretical model to account for the full complexity in the pore size distribution data observed in each of the four sub-layers. Recent work car-ried out by Dupont and Leclaire16 examined the acoustical properties of materials containing partially open (dead-end) pores. This work suggests that the effect of partly closed pores could not be fully accounted by some existing equivalent fluid models for porous media, and these models may need improv-ing if the proportion of these pores becomes relatively large.
V. CONCLUSIONS
[image:10.612.318.559.60.255.2]This work reports a novel method for the production of a porous material with stratification. It is shown that the reaction time is a main parameter that needs to be controlled in the foaming process in order to produce continuous pore stratifi-cation. Additionally, the reaction time is a key parameter for controlling the pore size and pore size distribution in the re-sultant porous sample. The pore size distribution is the prime non-acoustical property that has a strong effect on the other three key non-acoustical parameters: flow resistivity, porosity, and pore tortuosity. These three non-acoustical parameters, to-gether with the pore size distribution, influence sound propa-gation in the porous materials and have a direct effect on their acoustic absorption coefficient. These parameters were care-fully measured as a function of material sample depth. It is shown that, for a given porosity value, a continuous pore size stratification with a 5-6-fold variation in the flow resistivity can improve the acoustic absorption performance of a porous layer
FIG. 13. Comparison between predicted and measured absorption coeffi-cient spectra for the stratified material in normal and reverse orientations.
[image:10.612.97.294.64.115.2]without the need to increase the layer dimensions. A 20–30% difference in the absorption coefficient spectra measured in the direct and reverse sample orientations was observed. A compar-ison of the absorption coefficient spectra for the material sam-ple with pore stratification and the absorption coefficient for a non-stratified porous sample suggest that a 10–20% enhance-ment in the absorption coefficient spectra can be achieved, due to the proposed degree of pore size stratification.
The acoustic absorption coefficient of a material with pore stratification can be modeled, provided the depth varia-tion in the four non-acoustical properties is known. For this purpose, a suitable acoustical model based on pore size dis-tribution data can be adopted and used together with the standard transfer matrix approach. In this work, the adopted theoretical model was that proposed in Ref. 4. This model can also be used to deduce the four non-acoustical parame-ters in a porous sub-layer, which is piece-wise homogeneous, i.e., within which the pore stratification is relatively small.
1
B. Brouard, D. Lafarge, and J.-F. Allard,J. Sound Vib.183(1), 129–142 (1995).
2
L. De Ryck, J. P. Groby, P. Leclaire, W. Lauriks, A. Wirgin, Z. E. A. Fellah, and C. Depollier,Appl. Phys. Lett.90(18), 181901 (2007).
3
L. De Ryck, W. Lauriks, P. Leclaire, J. P. Groby, A. Wirgin and C. Depollier,
J. Acoust. Soc. Am.124(3), 1591–1606 (2008).
4K. V. Horoshenkov and M. J. Swift, J. Acoust. Soc. Am. 110(5),
2371–2378 (2001).
5
International Standards Organization. “Acoustics — determination of sound absorption coefficient and impedance in impedances tubes — part 2: Transfer-function method,” ISO Report 10534-2, 1998.
6International Standards Organization. “Acoustics - Materials for acoustical
applications-Determination of airflow resistance,” ISO Report 9053, 1991.
7
P. Leclaire, O. Umnova, K. V. Horoshenkov, and L. Maillet,Rev. Sci. Ins-trum.74(3), 1366–1370 (2003).
8K. Horoshenkov, “Characterisation of acoustic porous materials - Tyndall
medal paper,” on the CD-ROM: Southampton, UK, Proceedings of the Institute of Acoustics, available from the Institute of Acoustics,28(1), 3–4 April 2006.
9G. Pispola, K. V. Horoshenkov, and A. Khan,J. Acoust. Soc. Am.
121(2), 961–966 (2007).
10
Seehttp://www.meyerinst.com/html/optimas/optimas.htmfor information about Optimas version 5.2.
11
J. G. Berryman,Appl. Phys. Lett.37, 382–384 (1980).
12
O. Doutres, N. Atalla, and K. Dong, “Effect of the microstructure closed pore content on the acoustic behavior of polyurethane foams,” J. Appl. Phys.110, 064901 (2011).
13L. Boeckx, M. Brennan, K. Verniers, and J. Vandenbroeck, “A numerical
scheme for investigating the influence of the three dimensional geometri-cal features of porous polymeric foam on its sound absorbing behaviour,”
Acta Acustica United with Acustica96, 239 (2010).
14X. Olny and C. Boutin,J. Acoust. Soc. Am.
114(1), 73–89 (2003).
15
L. M. Brekhovskikh,Waves in Layered Media, Page 20, Nauka, Moscow, 1973. In Russian.
16T. Dupont, P. Leclaire, O. Sicot, X. L. Gong, and R. Panneton,J. Appl.