l
I I
(
I
I·I
Commission of the European Communities
European Coal and Steel Community
FINANCIAL REPORT 1979
This publication is also available in the following languages:
DA ISBN 92-825-2151-6 DE ISBN 92-825-2152-4 FR ISBN 92-825-2154-0 IT ISBN 92-825-2155-9 NL ISBN 92-825-2156-7
Cataloguing data can be found at the end of this volume.
' /
Luxembourg: Office for Official Publications of the European Communities, 1981
ISBN 92-825-2153-2
Catalogue number: CB-31-80-142-EN-C
Articles and texts appearing in this document may be reproduced freely in whole or in part so long as their source is mentioned.
European Coal and Steel Community
Commission of the European Communities
Roy Harris Jenkins Franyois-Xavier Ortoli Wilhelm Haferkamp Finn Olav Gundelach Lorenzo Natali Henk Vredeling Claude Cheysson Guido Brunner Raymond Vouel Antonio Giolitti Richard Burke
Vicomte Etienne Davignon Christopher Samuel Tugendhat
President Vice-President Vice-President Vice-President Vice-President Vice-President Member Member Member Member Member Member Member
As from 1 January 1976, the Commission of the European Communities adopted for its operations under the ECSC Treaty the unit of account al-ready used in other sectors of activity of the European Communities and known as the European unit of account (EUA).
This EUA is defined as equal to the sum of the following amounts of the national currencies of the Member States:
Deutschmark Pound sterling French franc Italian lira Dutch guilder Belgian franc Luxembourg franc Danish krone Irish pound
The value of the EUA is determined daily.
0,828 0,0885 1 '15 109,00 0,286 3,66 0,14 0,217 0,00759
The daily calculation of the EUA equivalent in a Community currency is made by converting into that currency the above fixed amounts in each na-tional currency composing the EUA on the basis of the official rates record-ed on the exchange market of the country concernrecord-ed. The day-to-day cal-culation into a non-Community currency of an amount in EUA is determin-ed on the basis of the cross rate of this currency on a financial market of the Community which is considered to be representative by the Commission for the currency in question: in general this is the Brussels market.
The amounts which, in this report, are expressed in EUA and represent sums in national currencies have been calculated on the basis of the con-version rates for the European unit of account. On 31 December 1979 one EUA was equal to:
BFR 40,3181 LFR 40,3181
DKR 7,71697 UKL 0,646904
IRL 0,670579 SFR 2,29783
FF 5,79312 OM 2,49057
HFL 2,74085 LIT 1157,19
USD 1,43839 CAD 1,68436
u.a. 0,562628 ~ 0,680484
Contents
Introduction . . . 8 ECSC borrowing operations . . . 1 0 ECSC lending and guarantee operations . . . 16 Changes in reserves and provisions . . . 30
Annexes
I - Main characteristics of loans contracted to 31 December 1979 32
I I - ECSCbalancesheetat31 December1979and 1978... 38
Ill - ECSC income and expenditure for the years 1979 and 1978... 40
Luxembourg, July 1980
This financial report covers the year 1979, the 27th year of the European Coal and Steel Community's existence and the 25th year of its borrowing and lending operations.
Since the entry into force of the Treaty establishing a Single Council and a Single Commission of the European Communities (1967). the Commission has exercised the powers vested in the former High Authority, each of the three Communities continuing to be governed by its own Treaty. Conse-quently, this report refers only to the 'Commission' of the European Com-munities unless it is absolutely necessary to use the name 'High Authority'.
G.K.N. General Steel Division, Cardiff
Introduction
·General economic situation
Despite a further oil price increase, the economic re-sults of the Community for 1979 were relatively satis-factory. Current estimates show the Community's gross domestic product to have increased by 3,4% compared with 1978, following a rise of 3,0% the previous year.
The economic expansion which began in 1978, no-tably as a re.sult of concerted budgetary measures in July of that year, continued in 1979 and produced the · highest annual growth rate for private investment achieved since 1973. Employment improved by 0,9%, the best result noted in the last six years. There was even a slight fall in overall unemployment during the year.
After the large surplus recorded in 1978 the Commu-nity's trade balance deteriorated markedly in 1979, ending in a deficit of 3 400 million ECU on a fob-fob basis. Approximately two-thirds of this decline in the trade balance of the Community, which totalled 16 500 million ECU, was due to developments in real terms. Community imports increased in volume by
1 0,8%, whereas the rate ofgrowth of exports in real ter,ms should not be higher than the world rate
(6,5% ). The balance is attributable to the deteriora-. tion in terms of trade which resulted from the steep deteriora-.
increase in world prices of raw materials, especially crude oil (even though this increase, expressed in ECU, was tempered by the appreciation of European currenCies against the US dollar).
The oil price increase recorded in 1979 (averaging al-most 50% in
Us
dollars over the year) is partly responsible for the deterioration in price trends in the Community. Whereas in 1978 the mean increase in consumer prices in the Community had been the low- ' est for seven years (7,3.% ), the figure for the whole of1979 was 8,6%, with a very steep rise in the second half of the year. The upward trend in the prices of all t,he major components of the consumer price index (foodstuffs, services, rents, manufactured products and indirect taxes) became more pronounced. The increase in consumer prices was higher even than the rise in energy prices. The differences already noted between the inflation rates in the Member States became more marked.
Steel
In '1979, world steel production increased by 4% to 745 million tonnes. Production of crude steel in the European Community increased by6,2% to 141 mil-lion tonnes, compared with 133 milmil-lion in 1978, 126
production, however, represents a fall of 10% from the record year of 1974. The increase in production was entirely due to an improvement in internal de-. mand, which contributed to a decline in the balance
of trade for steel products, with exports being re-duced to 24,6 million tonnes (25,8 million tonnes in
1978) and imports increasing from 8,7 million .tonnes in 1978 to 9,4 million tonnes in 1979.
The increase in production enabled a further small increase in the rate of utilization of production capaci-ties to be made, namely from 66% to 69% for crude steel and from 60% to 63,5% for finished products. The annual investment survey of 1 January 1980 rein-forces the view taken in last year's Financial Report that crude steel production potential -after the can-cellation of most expansion programmes - will not fall below the level of 200 million tonnes per year until . at least 1983. The production potential for finished
products will even increase from its present level of 167 million tonnes to 171 million tonnes in 1983. Contributing to this overall figure is a significant in-crease in production potential for hot coils, amount-ing to 6,7million tonnes, or 9,6%,
Between now and 1983, the considerable number of partial or total closures decided recently, particularly in the United Kingdom, will be offset by
commission-ing of new plant andre=evaluation of production po~
tentials at a number of works. The excess of produc-tion capacity for crude steel in 1979 was still well above the figure of 27 million tonnes mentioned in the latest.General Objectives. Any marked improve-ment in the balance between the.supply and demand for iron and steel products will depend not only on favourable market trends but also on an intensifica-tion of the restructuring work currently in progress.
1979 saw some slight improvements in prices, parti-cularly for long products. By the end of the year, however, prices were weakening. Despite the price increases, further substantial financial restructuring and an improvement of 10% in labour productivity brought about by the somewhat higher levels of pro-duction, closures and the general trimming of labour for'ces, only a limited number of steel producers were· restored to profitability.
According to the annual investment survey of 1 Jim-uary 1980, investments in the iron and steel sector showed signs of incipient stabilization in 1979, when they totalled 2 000 million EUA, compared with 2 1 00 million EUA in 1978 and 2 400 million .EUA in 1977.
de-profitably met. Investment decisions are unlikely to be put into effect as long as excess capacity continues to depress prices, inflation and interest rates remain at their present high levels, and the present serious recession continues unabated.
Coal
In 1979, coal production in the European Community stabilized (238, 1 compared with 238,7 million tonnes in the previous year), with an increase of 3,5% in the Federal Republic of Germany more than offsetting decreases in France, Belgium and the United King-dom (- 5,4%,- 6,6%,- 0,8% respectively). Figures for the first quarter of 1980 would appear to indicate that the trend towards growth in output is continuing, with an overall increase in production for the quarter of 3,8%, marked by a very large rise (8,4%) in the United Kingdom and a further improve-ment in the Federal Republic of Germany.
Consumption in 1979 increased by 7,6% to 310 mil-lion tonnes, the main contributing sectors being power-stations (7 ,7%) and coking plants (6,0%), the latter figure reflecting the higher level of steel produc-tion. Almost all of this increase, however, was cover-ed by imports, which rose by 36% to 58,9 million ton-nes, and by a decrease of 4,1 million tonnes in pit-head stocks.
The extraction potential of the Community's mines continued to decline in spite of considerable invest-ment: in 1979 it was 245 million tonnes, compared with 260 million tonnes in 1976 and 252 million ton-nes in 1978. This is largely the result of the closure of uneconomic or worked-out pits. The coalproducing companies expect this decline to continue although much more slowly than in recent years -with extraction potential for the Community falling to 239 million tonnes by 1983. Although in some coalfields extraction potential will increase significantly -particularly in Yorkshire, the Midlands and Kent in the United Kingdom, and the Ruhr and Saar in the Fed-eral Republic of Germany - these increases will be more than offset by decreases in other areas. There-sult of the investment in new mines and the closures of uneconomic mines. is evidenced by an increase in output per working day of 4,5% for the Community as a whole.
During 1979, investment in the coal industry amount-ed to 1 167 million EUA at current prices, comparamount-ed with 932 million EUA in 1978 and 744 million EUA in 1977. At constant prices (1970) the investments for 1977, 1978 and 1979 were 354 million, 435 million and 614 million EUA respectively, showing that in-creasing real expenditure has been necessary to
main-tain extraction potential at its present level of about 240 million tonnes. However, investments on a mas-sive scale would be required to reach the target of 270 million tonnes set for 1985 in the Community's 'Medium-term guidelines for coal1975-85' (i.e. 250 million tee).
Various factors make this target difficult to achieve:
- uncertainty regarding the sale of a higher
Commu-nity coal output in the face of increased imports at prices well below the cost of Community-produced coal;
- a faster rise in production costs than in revenues, despite increases in productivity;
ECSC borrowing
operations
Borrowings
1979 witnessed a slight increase in Eurobonds on the capital markets as compared with 1978, while issues of conventional international loans declin-ed, mainly as a result of the slump on the New York market. The proportion of US dollars in overall issues increased, however, at the expense in particu-lar of the yen and the OM, but owing to the extreme uncertainty about fu-ture trends in interest rates, a gradual and increasing tendency emerged to issue loans at floating rates. The volume of new international syndicated bank credits and loans, which had already shown a sharp increase in 1978, grew by 10%from 1978to 1979.
The upward trend in interest rates in 1979 intensified considerably during the first few months of 1980. Furthermore, because of the financial require-ments associated with the purchase of oil, which will prove an extremely heavy burden, the major banks are becoming increasingly selective in grant-ing new loans.
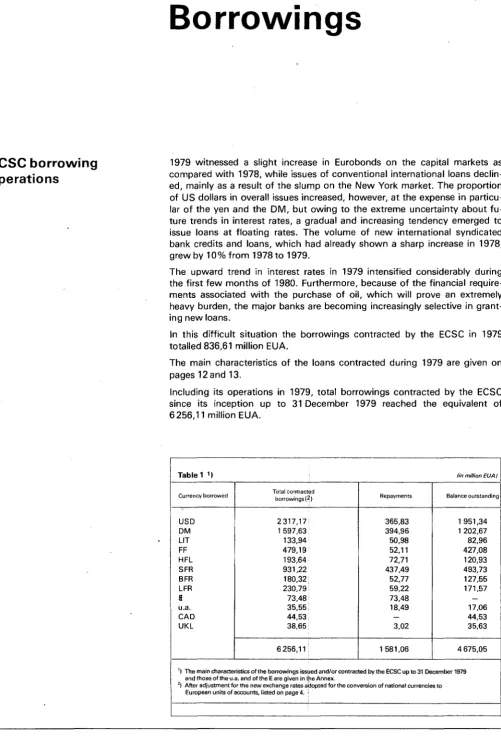
In this difficult situation the borrowings contracted by the ECSC in 1979 totalled 836,61 million EUA.
The main characteristics of the loans contracted during 1979 are given on pages 12 and 13.
[image:9.587.49.550.51.792.2]Including its operations in 1979, total borrowings contracted by the ECSC since its inception up to 31 December 1979 reached the equivalent of 6256,11 million EUA.
Table 1 11 /in million EUAJ
Currency borrowed Total contracted borrowings (2} Repayments Balance outstanding
I
USD 2317,17 365,83 1 951,34
OM 1 597,63 394,96 1 202,67
LIT 133,94 50,98 82,96
FF 479,19 52,11 427,08
HFL 193,64 72,71 120,93
SFR 931,22 437.49 493,73
BFR 180,32 52,77 127,55
LFR 230,79 59,22 171,57
II 73.48 73,48
-u.a. 35,55 18.49 17,06
CAD 44,53 - 44,53
UKL 38,65 3,02 35,63
6 256,11 1 581,06 4675,05
I
1 I The main characteristics of the borrowings iss~ed and/or contracted by the ECSC up to 31 December 1979 and those of the u.a. and of the E are given in t,he Annex.
2
Loans contracted
by
the ECSC in 1979
Kind of loan Currency Amount Rate Issue price (in millions) of interest % %
Debenture FF 325 9,70 15 100
Debenture USD 150 103/4-9 1/4 12 993/4
Debenture USD 125 93/4 20 98,915
Debenture USD 100 from 12to 101/z 7 987/a
Debenture USD 40 11 1/z 8 993/4
Debenture USD 50 115/a 10 995/s
Debenture DM 150 7 12 100
Debenture DM 150 77Ja 10 100
Debenture LFR 500 83/4 8 993/4
Private placement USD 15 11 1/4-9 1/4 12 Private placement USD 10 93/4 10 Private placement USD 20 11 1/z -93/s 10 Private placement DM 34 61/z-6 3/4 6 Private placement DM 50 63/4 6 Private placement DM
{~
61/z 5 63/4 7Private placement DM 25 8 10
Private placement DM 25 8 10
Private placement DM 40 71/z 12 Private placement DM 50 73/4 15 Private placement DM 40 81/4 10 Private placement DM 60 81/s · 10 Private placement DM 12 81/4 10
Private placement DM 40 8 10
Private placement FF 100 11 10 Private placement FF 20 1Q7/s 8 Private placement FF 30 113/4 8
Private placement FF 23 111/z 9 Private placement SFR 52,5 13/a 1,9 Private placement SFR 123,5 3 8
Private placement SFR 18 1 2
Private placement SFR 45 3 5
Repayment tin millions)
From 1982,13 equal instalments
From 1982, 9 equal instalments, the last of 82,5 From 1987,6 instalments of 6,250 and 7 of 12,5 Whole amount in 1986
From 1985, 4 equal instalments Whole amount in 1990
From 1984, 4 instalments of 10, 1 of 20 and 3 of 30
Whole amount in 1990
Whole amount in 1987 From 1988, 4 equal instalments From 1986,2 instalments of 2 and 2 of 3 From 1985,5 equal instalments From 1984, 2 equal instalments Whole amount in 1985 Whole amount at maturity Whole amount in 1989 Whole amount in 1989 From 1984, 8 equal instalments From 1985, 10 equal instalments Whole amount in 1989
From 1985, 5 equal instalments From 1985, 5 equal instalments Whole amount in 1990 Whole amount in 1989 Whole amount in 1988 From 1985, 5 equal instalments Whole amount in 1989 Whole amount in 1980
From 1982,2 instalments of 9, 1 of 26,5, 2 of 20,5 and 38 Whole amount in 1981
From 1981, 1 instalment of 5, 1 of 25, 1 of 5 and 1 of 10 In 1981,1 instalment of 12,5and in 1983,1 of 12,5 From 1985,5 equal instalments
From 1984, 5 instalments of 0,85 and 1 of 0,75
Quotation Stock Exchange
Paris Luxembourg New York Luxembourg Singapore Luxembourg
TOTAL BORROWINGS UP TO 31 DECEMBER 1979
Amounts in million European units of account
6600-
6500-
6400-
6300-
6200-
6100-
6000-
5900-
58005 7 0 0
-
56005 56005 0 0
-
5400-
5300-
6200-
5100-
5000-
4900-
4800-
4700-
4600-
4500-
4400-
4300-
4200-
4100-
4000-
39003 8 0 0
3 7 0 0
-
3600-
3500-
3400-
3300-
3200-
3100-
3000-
2900-
2800-
2700-
2600-
2500-
2400-
2300-
2200-
21002 0 0 0
-
1900-
1800-
1700-
1600-
1500-
1400-
1300-
1200-
1100-
10009 0 0
8 0 0
7 0 0
6 0 0
5 0 0
-
-BREAKDOWN BY SECTOR OF LOANS DISBURSED AND GUARANTEES GRANTED UP TO 31 DECEMBER 1979
Amounts in million European units of account
6600- 6500- 6400- 6300-6200 -6100 -6000 - 5900- 5800- 5700- 5600- 5500- 5400-5300 - 5200- 5100- 5000- 4900- 4800- 4700- 4600-4500 - 4400- 4300-4200 -4100 -
40003 9 0 0
- 3800-3700 - 3600- 3500- 3400-3300 -
3200-310 0
-3000 - 2900- 2800- 2700- 2600- 2500- 2400- 2300- 2200- 2100- 2000- 1900-1800 -1700 - 1600-1500
-14 0 0
-1300 - 1200- 1100- 1000-900 -800 -
7006 0 0
5 0 0
4 0 0
3 0 0
-200
-
100-Miscellaneous
- Readaptation and industrial redevelopment and reconversion
- Workers' housing
- Industrial loans
ECSC lending and
guarantee operations
Loans
The funds available to the Commission in 1979 for lending to undertakings totalled 866,81 million EUA, broken down as follows:
1. Borrowed funds
- available at the beginning of the year - product of loans floated in 1979
2. Own funds
- repayment of earlier loans
21,58
836,61 858,19
8,62
866,81
These funds were used for loans to industry (Article 54 of the Treaty), re-conversion loans (Article 56) and loans for worker housing. The industrial and reconversion loans were disbursed out of borrowed funds, while the bulk of the housing loans were drawn from the ECSC's own resources.
Total loans amounted to 675,80 million EUA.
The funds remaining on 31 December 1979 - as well as the loans
contract-ed in the first quarter of 1980 - permitted substantial disbursements to be made in the first three months of 1980 for a number of loans approved in the last months of 1979.
I
Table2
I
Loans disbursed in 1979 (in million EUA I I
i':
~ E ·c
Sector
0 § §
~
~ ~ ~ ~ "0 0 "0E
~"' :5
:§1 > -s-o X ~ - 0> E
0: ~
" ~ ~ c ~ 0 ·c £ ~ 0
u.l!l
"'
Ll: Z.!!l ...J..C ::::>>< u-· I
~
I - Coal industry 8,58
Iron-ore mines - - - - - - - 229,04 - 237,62
Iron and steel - - -
-indus(ry 114,15 - - 72,28 90,37 - 15,29 10,43 13,90 316,42 Thermal
power-station,s 12,37 - - 28,71 - - - 41,08
Total 135,10 - - 100,99 90,37 - 15,29 239,47 13,90 595,12
II - Industrial
reconversion 7,88 - - 27,20 3,88 - 4,17 15,92 - 59,05 Ill - Social housing 6,08 0,44 0,28 3,16 7,35 0,55 0,12 3,62 0,03 21,62
·:·']'
ECSC loans between
1. Industrial loans (Article 54)
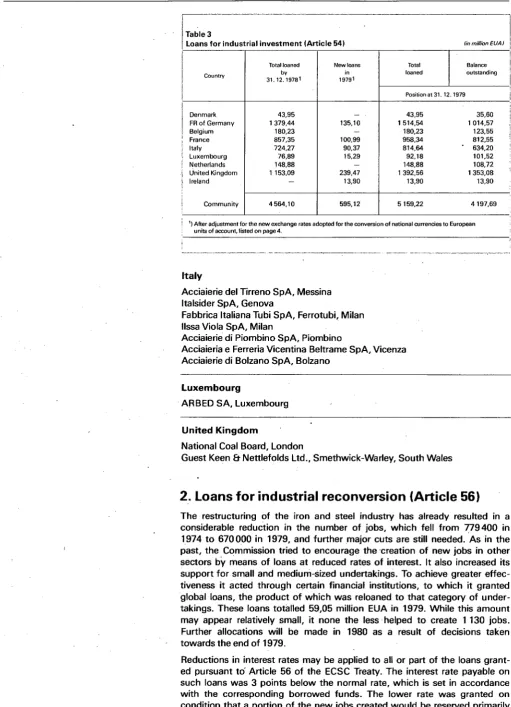
1979 was marked by an increase in the number of loans granted for in-dustrial investment projects pursuant to Article 54 of the ECSC Treaty.
Loans granted totalled 595,12 million EUA.
A sizeable proportion of industrial loans was used for restructuring projects in the iron and steel industry. In accordance with the criteria laid down in the Commission Communication of 22 July 1977, some undertakings re-ceived loans at reduced rates of interest for projects of this kind.
Other categories of loans - for environmental protection projects and for
vocational training and research centres - were also granted at reduced
rates of interest.
The Commission also continued to attach particular importance to the fi-nancing of projects outside the Community for the purpose of safeguarding the supply of raw materials for the Community iron and steel industry. It is interested in increasing its involvement in this sector, in cooperation with ECSC undertakings and producers in third countries.
As part of the Community's energy policy, a very large proportion of ECSC loans was used to finance projects in the coal industry. A total of 237,62 million EUA was disbursed for projects aimed at the modernization and amalgamation of mines.
In particular, the Selby project in the north of England, which will require a total investment of 735 million EUA, should provide a further capacity of 10 million tonnes/year from 1984, intended primarily to meet the supply re-quirements of a new electric power plant.
Loans totalling 41,08 million EUA were granted for the financing of power plants to be fuelled with Community coal.
The loans to industry disbursed in 1979 went to the following undertakings:
Federal Republic of Germany
STEAG AG, Essen
Norddeutsche Ferrowerke, Emden Kl6ckner-Werke AG, Duisburg Thyssen AG, Duisburg
ARBED-Finanz Deutschland GmbH, Saarbrucken Krupp Huttenwerke AG, Bochum
Saarbergwerke AG, Saarbrucken
Gewerkschaft Norbert Metz, Herzogenrath
Belgium
Cockeriii-Ougree-Providence and Esperance-Longdoz SA, Seraing (Liege)
France
Societe Siderurgique de Ch;Hillon-Neuves-Maisons, Neuves-Maisons Societe Lorraine de La min age Continu (SOL LAC) SA, Paris
Charbonnages de France, Paris SA Finolor, Paris
Union Siderurgique du Nord etde I'Est de Ia France (USINOR) SA, Paris
Ireland
Table 3
Loans for industrial investment (Article 541 (inmillionEUAI
Total loaned New loans Total Balance
Country by in loaned outstanding
31. 12. 19781 19791
Position at 31. 12. 1979
Denmark 43,95 - 43,95 35,60
FR of Germany 1 379,44 135,10 1514,54 1014,57
Belgium 180,23 - 180,23 123,55
France 857,35 100,99 958,34 812,55
l1aly 724,27 90,37 814,64 634,20
Luxembourg 76,89 15,29 92,18 101,52
Netherlands 148,88 - 148,88 108,72
United Kingdom 1153,09 239,47 1392,56 1353,08
Ireland - 13,90 13,90 13,90
Community 4564,10 595,12 5159,22 4197,69
1
) After adjustment for the new exchange rates adopted for the conversion of national a.rrrencies to European
units of account, listed on page 4.
Italy
Acciaierie del Tirreno SpA, Messina ltalsider SpA, Genova
Fabbrica ltaliana Tubi SpA, Ferrotubi, Milan IIssa Viola SpA, Milan
Acciaierie di Piombino SpA, Piombino
Acciaieria e Ferreria Vicentina Beltrame SpA, Vicenza Acciaierie di Balzano SpA, Balzano
luxembourg
ARBED SA, Luxembourg
United Kingdom
National Coal Board, London
Guest Keen & Nettlefolds Ltd., Smethwick-Warley, South Wales
2. Loans for industrial reconversion (Article 56)
I
:
The restructuring of the iron and steel industry has already resulted in a considerable reduction in the number of jobs, which fell from 779 400 in 1.974 to 670 000 in 1979, and further major cuts are still needed. As in the past, the Commission tried to encourage the ·creation of new jobs in other sectors by means of loans at reduced rates of interest. It also increased its support for small and medium-sized undertakings. To achieve greater effec-tiveness it acted through certain financial institutions, to which it granted global loans, the product of which was reloaned to that category of under-takings. These loans totalled 59,05 million EUA in 1979. While this amount may appear relatively small, it none the less· helped to create 1130 jobs. Further allocations will be made in 1980 as a result of decisions taken towards the end of 1979.
.'
Under the. terms' of th'e Treaty, requests for loans of this type are submitted to the Com.mission by the government of the Member State concerned. The geographical distribution of the loans granted therefore largely reflects the national policies on reconversion. Loans were granted to the following undertakings:
FR of Germany
North Rhine-Westphalia
Ruhrkohle AG, Essen (Mon6pol colliery)
Saar
ARBED-Finanz Deutschland GmbH, Saarbrucken (Rochling-Burba.ch works at Volklingen) ·
France
Lorraine
S.A. Forges et Boulonneries d' Ars-sur.-Moselle, Ars-sur-Moselle
Banque Populaire de Lorraine, Metz (for small and medium-sized under- · takings)
Compagnie Electro-Mecanique (CEM) Paris.(Maizieres-les-Metz works) Societe de Developpement Regional de Lorraine (LORDEX), Nancy (for small and medium-sized undertakings)
Societe Mecanique Automobile de I'Est (SMAE), Metz (Ennery and Metz· works)
Nord/Pas-de-Calais
Societe Franyaise de Mecanique, Douvrin
Languedoc-Roussillon
Societe Financiere pour favoriser !'Industrialisation des Regions Minieres.
(SOFIREM), Paris (for Merlin Gerin, Ales/Gard) ·
Auvergne
Rockwool-lsolation S.A., Paris (Saint-Eioy-les-Mines/Puy-de-06me works) ·.
Italy
Val d'Aosta
. Societa Nazionale Cogne, Aosta
luxembourg
.Societe Nationale de Credit et d'lnvestissement (SNCI ), !-uxembourg (for small and medium-sized undertakings)
Ville roy et Bo(::h Sari~ Luxembour-g ·
United Kingdor:n_
North Yorkshire
Thyssen (GB) Ltd, Llanelli
· Dyfed
Thyssen (GB) Ltd, Llanelli
Gwent
Girling Midland Ross Air Actuation Ltd, Tredegar
Mid-Giamorgan
Rockwool Ltd, Bridg€md.
Multiregional·
. Finance for Industry, London (for small andmed.ium-si;led undertakings)
I
I
I
Table4
Loans for industrial reconversion (Article 561
A - Breakdown by country {in million EVA)
Total loaned New lOans Total Balance
Country by in loaned outstanding
31. 12.19781 19791
Positionat31.12.1979
Denmark - - -
-FR of Germany 204,17 7,88 212,05 116,95
Belgium 54,78 - 54,78 24,35
France 148,70 27,20 175,90 135,65
Italy 62,28 3,88 66,16 41,35
Netherlands 0 30,02
- 30,02 13,40
United Kingdom 67,78 15,92 83,70 76,39
Ireland 0,42 - 0,42 0,42
Luxembourg - 4,17 4,17 4,17
Community 568,15 59,05 "627,20 412,68
1
) After adjustment for the new exchange rates adopted for the conversion of national currencies to European units of account, listed on page 4.
B - Breakdown by industry
category Amount (in mmion EUA} %
1. Iron and steel industry 136,98 21,84
2. Manufacture of motor vehicles 123,65 19,71 and accessories
3. Coal, gas 68,54 10,93
4. Chemicals 52,23 8,33
5. Non-ferrous metals 32,91 5,27
6. Industrial estates 28,37 4,52
7. Global loans 24,81 3,95
8. Rubber 23,12 3,69
9. Power-stations 22,45 3,58
10. Mechanical engineering 22,35 3,56
11. Articles of cast iron,
steel and other metals 20,15 3,21
12. Joinery and furniture manufacture 11,18 1,78 13. Ceramic ware, glass, lime and stone 10,51 1,67
14. Paper and printing 9,81 1,56
15. Electrical equipment 9,45 1,51
16. Textiles and clothing 9,26 1.48
17. Food industries 6,69 1,07
18. Processing of plastics 6,30 1,00
19. Metal engineering 1,59
20. Transport 1,38
21. Aeronautical engineering 0,87 3,84 0,61
22. Miscellaneous - 4,60 0,73
Total 627,20 HiO,OO
I
I
I
I
I
3. Loans for housing (Article 54.2)
1979 saw the continuation of the policy for housing finance. These loans are in principle drawn from the ECSC's own funds at a rate of 1% per an-num on a long-term basis. As a rule they are granted in the currency of the country concerned to avoid any exchange risks to recipients. They may be combined with other loans generally granted by financial institutions in the country concerned.
The funds paid out by the Commission in 1979 under the ECSC social housing programme amounted to 21,63 million EUA. This sum was disburs-ed under the 8th programme which is still in progress.
The loans disbursed from own funds at the rate of 1% totalled 17,75 million EUA in 1979; this sum was supplemented by 3,88 million EUA from bor-rowed funds. These amounts enabled the Commission to finance approxi-mately 6 500 new worker housing units. Since the beginning of its financial activities, the ECSC has therefore financed the construction of over 166 500 of these housing units.
The very low interest rates applied enabled borrowers to combine this type of loan with other capital raised on national markets at the terms prevailing on those markets. Borrowers thus have larger sums to draw on, while at the same time the average rate on their borrowings remains moderate.
Table5
Loans for social housing (Article 54.2) (in million EVA)
0
Total loaned New loans Total Balance
Country by in ~oaned outstanding
31. 12.19781 19791
Position at 31. 12. 1979"'
Denmark 1,20 0,28 1,48 1,16
FR of Germany 134,59 6,08 140,fl7 83,43
Belgium 38,90 0,44 39,34 14,29
France 36,65 3,16 39,81 23,99
Italy 16,35 7,35 23,70 17,16
Netherlands 13,32 0,55 13,87 7,27
United Kingdom 5,72 3,62 9,34 8,14
Ireland 0,49 0,03 0,52 0,49
Luxembourg 6,72 0,12 6,84 3,80
Community 253,94 21,63 275,57 159,73
1
4. Guarantees
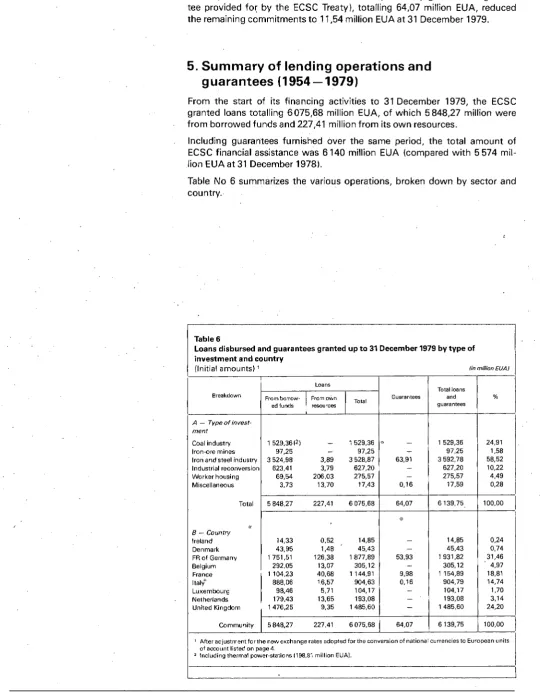
Redemption of the initial amounts of loans previously guaranteed (guaran-tee provided fa~ by the ECSC Treaty), totalling 64,07 million EUA, reduced the remaining commitments to 11 ,54 million EUA at 31 December 1979.
5. Summary of lending operations and
guarantees (1954-1979)
From the start of its financing activities to 31 December 1979, the ECSC granted loans totalling 6 075,68 million EUA, of which 5 848,27 million were from borrowed funds and 227,41 million from its own resources.
Including guarantees furnished over the same period, the total amount of ECSC financial assistance was 6 140 million EUA (compared with 5 574 mil-lion EUA at 31 December 1978).
[image:22.580.24.563.86.786.2]Table No 6 summarizes the various operations, broken down by sector and country.
Table 6
Loans disbursed and guarantees granted up to 31 December 1979 by type of investment and country
(Initial amounts) 1 lin million EUAJ
Loans
Total loans Breakdown
From borrow-
I
From ownI
Total Guarantees and %ed funds resources guarantees
A -
Typeofinvest-ment
Coal industry 1 529.3612) - 1 529,36 0 - 1 529,36 24,91
Iron-ore mines 97,25 - 97,25 - 97,25 1,58
Iron and steel industry 3 524,98 3,89 3 528,87 63,91 3 592,78 58,52 Industrial reconversion 623,41 3,79 627,20 - 627,20 10,22 Worker housing 69,54 206,03 275,57 - 275,57 4,49 Miscellaneous 3,73 13,70 17,43 0,16 17,59 0,28
Total 5 848,27 227,41 6 075,68 64,07 6139,75 100,00
I
"
«
8 - Country
Ireland 14,33 0,52 14,85 - 14,85 0,24
Denmark 43,95 1,48 45,43 - 45,43 0,74
FR o! Germany 1 751,51 126,38 1 877,89 53,93 1 931,82 31,46
Belgium 292,05 13,07 305,12 - 305,12 4,97
France 1104,23 40,68 1144,91 9,98 1154,89 18,81 I tall 888,06 16,57 904,63 0,16 904,79 14,74
Luxembourg 98,46 5,71 104,17 - 104,17 1,70
Netherlands 179,43 13,65 193,08 - 193,08 3,14 United Kingdom 1 476,25 9,35 1 485,60 - 1 485,60 24,20
Community 5 848,27 227,41 6 075,68 64,07 6139,75 100,00
I
1 After adjustment for the new exchange rates adopted for the convers~on of national currencies to European units of account listed on page 4.
[image:22.580.29.570.88.788.2]Changes in reserves and provisions
[image:23.580.189.547.135.418.2]The table below ·shows the changes in ECSC reserves and provisions between 31 December 1978and 31 December 1979.
Table 7 fin miHion EVA!
'·
I
Position at Changes Position at31. 12·. 1978 in 1979 31. 12.1979
Reserves
- Guarantee fund 200,00 30.00 230,00
- Special reserve 138,5.0 1,50 140,00
- Former pension fund 41,06 0.47 41,53
Budgetary provisions
Ia) for rehabilitation of workers 158,94 30,63 189,57 (b) fortechnical and
economic research 65,37 8,01 73,38
(c) assis!ance (Article 56) 19,56 1,00 20,56 ld) assistance IArti_cle 54) 12,63 5,06 17,69
(e) assista nee to coke 10,5$ -1,76 8,82
Other provisions 76,19 ' 28,84 105,03
Total ! 722;83 ; 103,75 826,58
Unalloca/ed balance ...:.;;_{
l
0,1r 0,_31 0,42Gr~md total
····
.
1
.722,94 104,06 827;00..
' ,_."
Revenue from the levy, which has been fixed at 0,29% since 1 January
1972, amounted to 103,24 million EUA in 1979, compared with 100,78 mil-lion EUA in 1978. This total comprises 23,87 milmil-lion EUA from coal produc-tion and 79,37 million EUA from iron and steel producproduc-tion.
Revenue resulting from the management of liquid assets, i.e. from interest on own resources invested, was 44,08 million u. a., and income from bor-rowed funds not yet disbursed was 18,81 million u. a.
0
Annexes
I -
Main characteristics of loans contracted to
31 December 1979
II -
ECSC balance sheet at 31 December 1979 and 1978
Ill -
ECSC income and expenditure for the years 1979
Annex I
Main characteristics of loans contracted to 31 December 1979
Initial amount
Balance outstanding at Year Interest Term
of issue %p.a. (years)
. I
31. 12. 1979in currency equivalent in European lin European units of account I units of account
Anne-x I
Main characteristics of loans contracted to 31 December 1979
Initial amount
Balance outstanding at Year· Interest Term
of issue %p.a. (years)
I
31. 12. 1979
in currency equivalent in European (in European units of account) units of account
1978 91/4 12 USD 18000000 12 513 991,33 12 513 991,33 1978 91/4 12 40000000 27 808 869 ,63 27 808 869,63 1978 9-93/4 20 50000000 34 761 087,05 34 761 087,05 1979 11 1/4-91/4 12 15000000 1 0 428 326' 11 1 0 428 326' 11
1979 93/4 10 10 000 000 6952217,40 6952217,40
1979 11 1/2-93/a 10 20000000 1 3 904 434,82 1 3 904 434,82 1979 103/4-91/4 12 150000000 1 04 283 261 '1 5 104283261,15 1979 93/4 20 125000000 86 902 717,62 86 902717,62 1979 12-101/2 7 100000000 69522174,10 69 522 174,10
2 102 894 235,95 1 965 652 569,88
1955 33/4 25 DM 50000000 20 075 725,64 500849,20 1965 51(2 18 150000000 60 227 176,91 18 469 667,59
1968 6 1/4 13 60000000 24 090 870,76 4818174,15
1969 6 1/4 15 40000000 16 060 580,50 8 030 290,25 1969 6 1/2 13 50 000 000 20 075 725,63 . 6022717,69 1971 71(2 15 100000000 40 151 451,27 28 106 015,89
1972 61(2 15 100000.000 40151451,27 32121161,02
1972 7 16 150000000 60 227 176,91 48 1 81 7 4 1 ,53 1973 61/2 15 150000000 60 227 176,91 54 204 459,22 1973 73/4 15 100000000 40 151 451 ,27 36136 306,15
1974 10 7 50000000 20 075 725,64 20 075 725,64
1974 93/4 7 150000000 60227176,91 60227176,91
1975 81/2 10 56000000 22484812,71 16 863 609,54
1975 8112 7 20000000 8030290,26 8030290,26
1975 81(2 10 150000000 60 227176,91 45 170 382,68
1975 81(2 5 16 000 000 6424232,20 6424232,20
1975 8 5 60000000 24 090 870,76 24 090 870,76
1975 8 7 150000000 60227176,91 60227176,91
1976 73/4 10 80000000 32 1 21 161 ,0 1 28 106 015,89 1976 81/4 10 45000000 18 068 153,07 13 551 114,81
1976 8 5 50000000 20 075 725,64 20 075 725,64
1976 73/4 7 125000000 50 189 314,09 50189314,09
1976 73/4 10 75000 000 30 113 588,46 30 113 588,46 1977 7 12 81 630 000 32 775 629,68 32 775 629,68
1977 7 12 19 800 000 7949987,35 7 949987,35
1977 6 12 16 000 000 6424232,20 6424232,20
1977 6 12 32000000 12 848 464,41 12 848 464,41
1977 53/4 8 20000000 8030290,26 6 022 717,69
1977 51/2 8 20000000 8030290,26 6022717,69
1977 51/2 8 20000000 8030 290,26 6 022 717,69
1977 51/2 8 20000000 8030290,26 6022717,69 .
1977 6 14 98000000 39 348 422,24 33 727 219,07
1977 51(2 8 18000000 7 227 261,22 5420445,92
1977 51/2 8 12000000 4818174,15 3613630,61
1977 6 1/s 10 25000000 1 0 037 862,82 10 037 862,82 1978 53/4 10 30000000 12 045 435,38 12 045 435,38
1978 57/s 10 20000000 8030290,26 8030290,26
1978 51/4 12 150000000 60227176,91 60 227 176,91
1978 61(2 15 15 000 000 6 022 717,69 6022717,69
1978 61/2 15 50000000 20 075 725,64 20 075 725,64
Annex I I
Main characteristics of loans contracted to 31 December 1979
Initial amount
Balance outstanding at Year Interest Term
of issue %p.a. !years)
I
31. 12. 1979
in currency equivalent in European (in European units of account) units of account
1978 6 12 DM 70000000 28106015,89 28 106 015,89 1978 61/2 15 32400000 13 009 070,21 13 009 070,21 1978 61/4 10 9000000 3 613630,61 3 613 630,61 1978 6 10. 150000000 60 227 176,91 60227176,91 1978 51/2 6 16 200 000 6 504535,10 5420445,92 1978 61/2 12 20000000 8030290,26 8030290,26 1978 63/4 10 20000000 8030290,26 8030290,26 1978 6 6 20000000 8030290,26 8030290,26 1979 6 1/2-63/4 6 34000000 13 651 493,43 13 651 493,43 1979 63/4 6 50000000 20 075 725,64 20 075 725,64 1979 61/2-63/4 7 10000000 4015145,13 4015145,13 1979 7 12 150000000 60227176,91 60227176,91 1979 8 10 25000000 1 0 037 862,82 1 0 037 862,82 1979 8 10 25000000 1 0 037 862,82 1 0 037 862,82 1979 71/2 12 40000000 16 060 580,51 16 060 580,51 1979 73/4 15 50000000 20 075 725,64 20 075 725,64 1979 8 1/4 10 40000000 16 060 580,51 16060580,51 1979 81/4 10 60000000 24090870,76 24 090 870,76 1979 81/4 10 12000000 4818174,15 4818174,15 1 394 471 950,14 1 202 667 421,51
1963 51/2 20 LIT 15 000 000 000 12 962 434,86 3456649,30 1966 6 20 15 000 000 000 12 962 434,86 6049136,27 1966 6 20 1 5 000 000 000 12 962 434,86 6049136,27 1968 6 20 1 5 000 000 000 12962434,86 7 777460,92 1968 6 20 15 000 000 000 12962434,86 7777460,92 1972 7 15 20 000 000 000 17 283 246,49 1 3 826 597' 18 1972 7 15 20 000 000 000 17283 246,49 13826 597,18 1974 7 15 1 0 000 000 000 8641623,24 8641623,24 1975 10 10 30 000 000 000 25 924 869,73 19 443 652,30
133 945160,25 86 848 313,58
1957 31/2 25 BFR 200 000 000 4960 551,22 863135,90 1957 31/2 25 20000000 496055,12 86313,58 1962 51/4 20 300000000 7441826,82 1 562573,63 1963 51/2 20 300000000 7440826,82 2083431,50 1968 63/4 15 750000000 18 602 067 ,06 8928992,17 1970 83/4 20 500000000 12401 378,04 9097650,92 1971 73/4 15 700000000 17 361 929,26 12153350,47 1973 73/4 12 1 000000000 24 802 756,08 18 602 067,05 1975 81/4 10 1 500000000 37 204 134,13 32 243 582,90 1978 81/2 8 2000000000 49605512,16 49 605 512,16
180 316 036,71 135226610,38
Annex I
Main characteristics of loans contracted to 31 December 1979
Initial am aunt
Balance outstanding at Year Interest Term
of issue % p,a, I years)
I
31. 12, 1979
in currency equivalent in European On European units of account}
units of account
1976 101/4 5 FF 40000000 6904 742,18 4142845,31
1976 10 5 60000000 10 357 113,27 6 214267,96
1976 10 7 50000000 8630927,72 8630927,72
1976 101/5 18 250000000 43 154 638,60 43 154 638,60
1976 101/2 7 50000000 8630927,72 6904742,18
1977 113/a 5 60000000 10357113,26 10357113,26
1977 11 12 300 000 000 51785566,33 51785566,33
1978 114!1o 6 4000000 690474,22 690474,22
1978 11 4/10 7 4000000 690474,22 690474,22
1978 1 oa;,o 15 275000000 47 470 102,47 47 470 102,47
1978 101/2 7 50 000000 8630927,72 8630927,72
1978 1 Q9,5/10 12 50000000 8630 927,72 8630927,72
1978 10 10 300000000 51 785 566,32 51785566,32
1979 97/10 15 325000000 56 1 0 1 030' 1 9 56101030,19
1979 11 20 100000000 17 261 855,44 17261855,44
1979 11 112 20 23000000 3970226,75 3 970226,75
479189107,07 431956355,12
1961 41/2 20 H FL 50 000 000 18 242 516,00 2353284,57
1962 43/4 25 6000000 2 189 101,92 700512,61
1962 43/4 20 25000000 9121 258,00 1897 221,66
1963 45/a 30 1 750000 638488,06 299906,96
1964 53/4 20 25000000 9121 258,00 3101227,72
1965 53/4 20 40000000 14594012,80 5892332,67
1975 81/2 15 60000000 21 891 019,20 16053414,09
1975 85/a 10 20000000 7 297 006,40 4378203,84
1976 8 7 60000000 21 891 019,21 21 891019,21
1976 83/4 25 25000000 9121 258,00 8026707,05
1976 85/a 25 30000000 10 945 509,60 9 632048,45
1976 83/4 20 14000000 5107 904,48 5107904,48
1978 71/4 15 100000000 36 485 032,02 36 485 032,02
1978 75/a 15 14000000 5107 904,48 5107904,48
171753 288,17 120 926 719,81
1957 53/a '25 LFR 100 000 000 2 480 275,61 540 541,00
1961 51/4 25 100000000 2480275,61 1133852,29
1961 5 25 100000000 2480275,61 1119384,00
1962 51/s 25 250000000 6200689,02 3144374,24
1964 53/a 20 150000000 3720413,41 1 240 137,80
1971 7 15 250 000 000 6200689,02 6200689,02
1971 73/4 12 300 000 000 7 440826,82 4241271,29
1972 63!4 12 300000000 7 440826,82 4166863,02
1972 63/4 15 400000000 9 921 102,43 7 936 881,95
1973 63!4 15 300000000 7 440826,82 6696744,14
1973 7 12 800000000 19 842 204,86 14881653,65
1973 7 15 800000000 1 9 842 204,86 17 857 984,38
1973 8 12 300000000 7440826,82 4985353,97
1973 8 12 200000000 4960551,21 3323 569,32
Annex I
Main characteristics of loans contracted to 31 December 1979
Initial amount
Balance outstanding at
Year Interest Term . of issue %p.a . (years)·
I
31. 12. 1979
in currency equivalent in European iin European units of accounti units of account
1973 7112 8 LFR 250 000 000 6200689,02 1 984220,48 1974 10 7 400000000 9921102,43 4 960 551,22 1975 9 10 500000000 12401378,04 12 401 378,04 1975 9 9 100000000 2480275,61 2 480 275,61 1976 9112 8 500000000 12401378,04 12401378,04 1976 9112 6 200000000 4960 551,21 3 720413,41 1977 81{2 10 500000000 12401 378,04 12401378,04 1978 73/4 10 250000000 6200689,02 6200689,02 1978 73/4 10 600000000 14881653,65 14 881 653,65 . 1978 8 6 200000000 4 960 551,21 4 960 551,21 1979 83/4 8 500000000 12401378,04 12401 378,04 219 504 391 ,27 177 920462,19
1976 9 7 CAD 50 000 000 29 684 865,47 29 684 865,4 7 1977 9 7 25000000 14 842 432,73 14 842 432,73 44 527 298,20 44 527 298,20
1962 41/2 18 S FR 60 000 000 26 111 592,24 2 611 159,23 1975 73/4 15 80000000 34815456,32 34 815 456,32 1976 61/4 5 30000000 13055796,12 13 055 796,12 1976 61{2 7 30000000 13055 796,12 13 055 796,12 1976 53/4 15 80000000 34 815 456,32 34 815 456,32 1977 41/2 8 65000000 28 287 558,26 28 287 558,26 1977 41/2 16 80000000 34815 456,32 34 815 456,32 1978 33/4 4 100000000 43 519 320,40 43 519 320,40 1978 31/4 3 52500000 22 847 643,21' 22 847 643,21 1978 33/s 4. 57500000 25 023 609,23 25 023 609,23 1978 35/s 5 37500000 16 319 745,15 16 319 745,15 1978 31/4 5 25000000 1 0 879 830' 1 0 10 879 830,10 1978 31/4 6 25000000 10879 830,10 10 879 830,10 1978 21/4 2 40000000 17407728,16 17 407 728,16 1978 23/s 2 35000000 15231762,14 15231762,14 1978 3 5 20000000 8703864,08 8703864,08 1978 21{2 3 100000000 43519320,40 43519320,40 1979 13/s 11{2 52500000 22 847 643,21 22 847 643,21 1979 3 8 123 500000 53 746360,70 53 746 360,70 1979 1 2 18000000 7 833477,68 7833477,68 1979 3 5 45000000 19 583 694,18 1 9 583 694' 1 8 1979 29/10-31/4 4 25000000 10879830,10 10 879 830,10
1979 43/4 . 10 7000000 3 046352,43 3 046352,43
517227122,97 493 726 689,96
1966 53/4 20 UC1)20000000 35 547 466,53 17062783,93 1977 95/s 12 UKL20000000 30 916 488,38 28 906 916,63 1979 131/s-111/2 10 UKL 5000000 7729122,09 7729122,09 38645610,47 36 636 038,73 5318021667,732) 4 713151263,29
Annex II
I
European Coal and Steel Community
Balance sheets as of 31 December 1979 and 1978
(in European units of account)Assets
Loans outstanding (note 3} Bank balances and deposits Investment securities Accrued interest receivable Deferred issuing costs and premiums Other assets (Note 4)
Bank deposits for bonds and coupons payable Repurchased bonds (Note 5 I
Property
1979
4 793693 335 448858943 169380099 113121166 70 902275 47523448 40376952 37254525 260752
5721371495
1978
4549891467 309677951 167 265646 105172535 70494437 43356556 34 230 814 78209905 272401
5358571712
\ The accompanying notes are an integral part of these statements.
I
I
Reserves (Note 6)-Guarantee fund
Special fund {housing and reconversion) Former pension fund
Allocations from income {Note 7)-Financial aid
Other
Unallocated income
Total reserves and allocations
Borrowings (Note 8) Accrued interest
Bonds and coupons payable Due to banks
Other liabilities and payables Reimbursement premiums payable
®
Annex II
Liabilities
1979
I
1978230000000 200000000
140 000 000 138 500 000
41 530 962 41062662
411 530 962 379562 662 0
310021 337 267084274
105 033 906 76194889
415 055 243 343 279163
419033 113045
827005238 722954870
4675047371 4416 237 654
166 822 885 151 289 973
40376859 34230814
8268671 28 457135
2848488 4196928
1 001 983 1204338
5 721371495 5358571712
European Coal and Steel Community Commission of the European Communities
F.-X. ORTOLI
Vice-President
A. NICOLETTI
Annex Ill European Coal and Steel Community
Statements of revenues and expenditures for the years
ended 31 December 1979 and 1978
(in European units of account)
Revenues:
From loans and guarantees (Note9)
Levy (Note 10)
Contributions from Member States Interest from deposits and investments Gain on retirement of repurchased bonds
(Note 8) Miscellaneous
Expenditures:
For borrowings and guarantees (Note 11)
Reduction of portfolio to market value (Note 12}
Other financial expenses Budgetary expenditures; Research projects Rehabilitation projects Assistance under Article 54 Assistance under Article 5.6 Coktl projects
Administration (Note 13)
Excess of revenues over expenditures Loss from conversion of foreign currencies
Net income available for allocations
~~accompanying
notes are an integral part of these statements.I
1979406186807 103239638 28000000 44080665
2 739 281 801 725
585 048116 382613609 10387724 231627 33101 821 33020436 5374622 6399 500 4570486 5000000 480699825 104348291 297923 104050368
I
1978374 456 791 100 775 514 28000000 33781463
187 876
537201644
352 181 251
236252 32306675 20993860 3976808 4 799675 5000000 419494 521 117 707123 10783339 106923784
European Coal and Steel Community Commission of the European Communities
F.-X. ORTOLI
Vice-President of the Commission
A. NICOLETTI
European Coal and Steel Community
Statements of net income allocations
for the years ended 31 December 1979 and 1978
(in European units of account)Unallocated income as of 1 January Net income available for allocations
Available for allocations
Allocations to !Note 1 ): Guarantee fund Special fund Former pension fund Financial aid Other
Unallocated income as of 31 December
Total allocations
1979
113045 104050368
104163413
30000000 1 500000 468300 42937063 28839017
103744380
419033
I
The accompanying notes are an integral part of these statements.L--~---
-1978
85593 106923 784.
107009377
17 000 000 4000000 1146241 76917 616 7 832475
106896332
·European Coal and Steel Community
Notes to financial statements
31 December 1979 and 1978
(in European units of account)1. Presentation of financial statements
The accompanying financial statements as of 31 December 1979 include the proposed allocations of the 1979 net income.
2. Summary of significant accounting policies
(a I Gain or loss from conversion
The gain or loss resulting from the conversion at year end of the accounts in foreign currency is taken into account in the determination of net income available for allocation.
(b I Investment securities
Investment securities, mainly governmental sec:urities, are valued at the lower of average cost or market.
(c) Property
Property consists of a building located in Washington D.C., which is valued at cost.
(d) Deferred issuing costs and premiums
Issuing costs and related expenses are amortized over the terms of the respective borrowings.
3.loans
The breakdown of approximately 1 000 loans granted is as follows, as of 31 December 1979:
From borrowed funds in
United States dollars German marks Swiss francs French francs Luxembourg francs Belgian francs Dutch guilders Italian lire Canadian dollars United Kingdom pounds European units of account European monetary units
From other sources
Special reserve fund for the financing of social housing projects Pension fund for housing loans to the European
Communities' personnel
Pension fund for Friuli iron industry Funds allocated for technical research Funds allocated for rehabilitation
An analysis of these loans by country is as follows:
FR of Germany United Kingdom France Italy Belgium Netherlands Denmark Luxembourg Ireland
Loans for the construction of housing for the personnel of the European Communities
1 951 819 054 1149083958 491932563 422395220 159997281 135183023 120 542 897 85 776952 44 527 298 41240663 8908071 17 062 784
4628469764 137743 009 2124!5399 3888730 2114038 231395 165223 571
4 793 693 335
1 216142003 1 437608204 942524992 692 784344 192 711 409 141129397 36760 068 97970 568 14815951
4 772446936 21 246399
A breakdown of these loans by principal form of guarantee is as follows:
Loans secured by Member States Loans secured by banks Loans secured by mortgages Loans secured by other guarantees Loans secured by industry groups
1 981 423492 977141584 961 399179 94993154
7787~5926
4 793693 335
The terms of the loans granted to corporations within the European Community vary significantly.
The duration of the loans for worker housing projects varies between 20 and 25 years while the duration of the loans to the Communities' personnel varies between 10 and 20 years.
4. Other as!!ets
As of 31 December 1979, this caption included the following accounts:
Levy receivable
Member States' contributions Others
5. Repurchased bonds
21 547051 19 676 293 6300104
47 523448
Repurchased bonds, which are temporarily held in treasury, are valued at the lower of the average cost or market value, except for the bonds maturing in 1980, which were withdrawn from the market (Note 8).
At 31 December 1979, the nominal value of the repurchased bonds in portfolio was 45 227 489.
6. Reserves
The guarante~ and speCial fund result from allocations of the ECSC's net income made by the Commission.·
The former pension fund r~p.resen~~ 'the balance of the pensions funded by the ECSC prior to 5 March 1968,
from which date on the pension com111itments for the personnel are assumed directly by the Member States.
7. Allocations from income
Allocations from net income are made for industrial projects, social housing projects for workers and tech-nical and economic research in" accordance with the provisions of the Treaty establishing the ECSC. As of
31 December 1979, these funds were planned to be used for the following projects:
Financial aid (contracted commitments):
Rehabilitation projects
Research projects " Developments and reconversion (Article 56)
Industrial loans (Article 54)
Coal and coke gra,(l.~S
Other (approved commitments): . ,:_·
Research projects . DevelopmentS and reconversion (Article 56)
Industrial loans (Article 54) · ·
Budget 1980
Other ._.,·
···,
8. BorrowinQ_s :•· · ·
189 567 279 73379930 20 562 518 17 686 418 8825192
11 930 288 41607911 18495707 23000000 10000000
310021 337
105033906
415055243
The breakdown of the net debt outstanding by currency was as follows:
United States dollars German marks Swiss francs French francs Luxembourg francs Belgian francs Dutch guilders Italian lire Canadian dollars United Kingdom pounds European units of account
1 951 344142 1202667421 493726690 427079881 171566244 127555614 120926720 82959324 44527 298 35631253 17 062 784
4675047 371
Repurchased bonds held in treasury as of 31 December 1979, for a nominal value of 38103 892 and maturing in 1980, were withdrawn from the market and a profit of 2 739 281 was recorded.
9. Revenues from loans and guarantees
The detail of the revenues from loans and guarantees is as follows:
Interest on loans Interest on available funds Guarantees fees
Miscellaneous
10.Levy
382896568 18810568 61976 4417695
406186807
The ECSC is authorized under the Treaty to impose a levy on the average value of the production of coal and steel of the enterprises in the Community. During the year 1979 the percentcrge was 0,29 %.
11. Expenditures for borrowings and guarantees
The detail of the expenditures for borrowings and guarantees is as follows:
Interest on borrowed funds Amortization of issuing costs Agency fees
Miscellaneous
12. Reduction of portfolio to market value
363 208185 14510254 3 864 210 1 030960
382613609
In accordance with its accounting policies, which call for the valuation of its portfolio of investment securities and repurchased bonds at the lower of average cost or market, the ECSC recorded a provision of 10 387 724 to reflect the reduction in market value of the portfolio as of 31 December 1979. As of 31 December 1978, the difference amounted to 6 574 993 for which no reduction was recorded but which was included in the 'Other allocations from income'.
13. Administrative expenditure
The ECSC contributed to the administrative budget of the Commission of the European Communities for an amount of 5 000 000.
14. Commitments
AS of 31 December 1979, the Commission had signed formal agreements for the borrowing of a total amount of 147 488 642; outstanding loan commitments amounted to 48 038 104.
15. Gyarantees given
European Communities-Commission
Financial report 1979
European Coal and Steel Community
Luxembourg: Office for Official Publications of the European Communities
1981 - 45 pp.: 8 ill. col., 4 graphs col. -21,0 x 29,7 em
DA, DE, EN, FR, IT, NL
ISBN 92-825-2153-2
Catalogue number: CB-31-80-142-EN-C
Price (excluding VAT) in Luxembourg
ECU 8 - BFR 330 - IRL 5.50- UKL 4.40 - USD 10.50
The twenty-fifth annual Financial Report of the ECSC for the year 1979 records the financial activity of the Commission in the field covered by the Treaty establishing the European Coal and Steel Community. The in-troductory chapter gives a summary account of the output of ECSC products and the volume of capital spending. The following chapters describe the main characteristics of the ECSC's borrowing operations and its loans for industrial investment projects, reconversion and workers' housing; they include a number of graphical illustrations and lists of beneficiaries. The concluding chapter provides an insight into changes in the ECSC's income and expenditure over the financial year 1979.