So Fast so Good: An Analysis of Answer Quality and Answer Speed in
Community Question Answering Sites
Alton Y. K. Chua, and Snehasish Banerjee
Nanyang Technological University, Wee Kim Wee School of Communication & Information, 31 Nanyang Link, SCI Building, Singapore 637718.
E-mail: {altonchua, snehasishb}@ntu.edu.sg
this paper represents an attempt to explore a territory of CQA research that has hitherto been relatively uncharted.
Introduction
Community question answering sites (CQAs) are dedicated platforms for online users to ask and answer questions, browse the corpus of already answered questions, comment and rate the quality of answers, as well as vote for the best answers (Qu, Cong, Li, Sun & Chen, 2012). One of the main motivations for CQA participation is to harness the wisdom of crowds - “ask a hundred people to answer a question or solve a problem, and the average answer will often be at least as good as the answer of the smartest member” (Surowiecki, 2004, p. 11).
Over the years, CQAs have become a popular source of information on the web given their ease of use and acceptable turnaround time of answer provision (Kitzie & Shah, 2011). Even search engines such as Google and MSN invest in indexing pages from CQAs in response to users’ natural language queries (Roussinov, Fan & Robles-Flores, 2008). On the research front, the growing popularity of CQAs has attracted much scholarly interests. A dominant theme lies in the area of answer quality (eg. Agichtein, Castillo, Donato, Gionis, & Mishne, 2008; Blooma, Chua & Goh, 2011; Kim & Oh, 2009).
Second, while much research efforts have gone into the evaluation of answer quality in CQAs to sift the grain from the chaff (e.g., Fichman, 2011; Harper, Raban, Rafaeli & Konstan, 2008; Shachaf, 2009), little scholarly attention has delved into the speed at which answers are provided. CQA users are completely dependent on the goodwill of answerers. They expect answerers to provide good quality answers promptly. However, a good quality answer may no longer be needed if it arrives late. Conversely, a prompt answer may not be valuable if its quality is found wanting. Thus, answer quality has to be evaluated in light of answer speed.
Third, answer quality in CQAs has mostly been studied as an undifferentiated corpus of content (e.g., Blooma, Chua & Goh, 2010; Kim & Oh, 2009; Shah, 2011) even though answers are responses to questions of various types (Harper, Weinberg, Logie & Konstan,
2010). In particular, questions can be classified into five types, namely, factoid, list, definition, complex interactive and target questions (Dang, Lin & Kelly, 2007; Lin & Katz, 2006; Voorhees, 2004). The analysis of quality and speed of answers with respect to the question types can highlight subtle nuances which have thus far been relatively obscured.
For these reasons, drawing data from six popular CQAs (Yahoo! Answers, WikiAnswers, Answerbag, Baidu Knows, Tencent Soso Wenwen, and Sina iAsk), the purpose of this paper is to investigate the inter-play between answer quality and answer speed across the five question types. Specifically, the following four research questions (RQs) are investigated:
RQ 1: How do answer quality and answer speed vary across question types?
RQ 2: How do the relationships between answer quality and answer speed vary across question types?
RQ 4: How do trends of answer quality vary over time across question types?
The first two RQs deal with the entire corpus of answers harvested from the six CQAs. Given that several questions attracted more than one answer, the scope of the last two RQs is trained specifically on answers with more than two competing entries intended for a given question.
The significance of this paper is two-fold. First, on the research front, the twin-focus on answer quality and answer speed across question types represents an attempt to explore a territory of CQA research that has hitherto been mostly uncharted. Answers in CQAs tend to vary acutely in terms of their quality and speed (Harper et al., 2008). Yet, the scope of extant literature is generally confined to either answer quality (eg. Agichtein et al., 2008; Blooma, Chua & Goh, 2011) or answer speed (eg. Kitzie & Shah, 2011; Mamykina, Manoim, Mittal, Hripcsak & Hartmann, 2011). This paper will thus enhance understanding of the inter-play between quality and speed of answers in CQAs.
Second, on the practical front, this paper sheds light on how different question types in CQAs tend to elicit answers of varying quality and speed. It also accounts for the variations in answer quality trends over time across question types. This in turn, provides guidance in the ways CQA users could frame their questions to draw better and faster answers. After all, both quality and speed of answers are essential for sustained patronage to CQAs (Raban & Harper, 2008).
Literature Review Answer Quality
One of the major criticisms of CQAs has always been that anyone can post answers without a peer-review process. Some users consistently strive to offer high quality answers out of altruism or motivation to earn rewards and establish reputation in the community (Nam, Ackerman & Adamic, 2009). Others, however, provide answers which are sub-par in quality. This can be due to reasons including the lack of knowledge about the domain, having limited time to prepare good quality answers, harboring malicious intentions to generate spam or simply to make fun of others (Suryanto et al., 2009). Thus, answer quality in CQAs ranges drastically from superior to abysmal (Agichtein et al., 2008; Blooma, Chua & Goh, 2010; Suryanto et al., 2009).
Content value refers to the overall content quality of answers and can be explained by three factors: reasonableness, soundness and dependability. Reasonableness is the extent to which an answer is deemed believable and internally consistent (Blooma, Chua & Goh, 2011). Soundness refers to the extent to which an answer is error free, complete, and consistently represented. A dependable answer is current, secure, and given in a timely manner (Kahn, Strong & Wang, 2002). Cognitive value refers to the ability of an answer to stimulate the cognitive cues of askers’ knowledge. It can be explained by two factors: understandability and novelty. Understandability is the extent to which an answer is easily comprehended and fully utilized (Kim, Oh & Oh, 2007; Kim & Oh, 2009). Novelty refers to the extent to which an answer invokes creative thinking about a topic or scenario (Kelly et al., 2007). Socio-emotional value refers to the social aspect of CQAs, denoting interpersonal relationships and emotions as reflected through answers. Gratitude, appreciation and empathy are some forms of emotions expressed in CQAs to thank others for sharing their knowledge or providing emotional support (Kim, Oh & Oh, 2007; Kim & Oh, 2009).
Answer Speed
As mentioned, limited scholarly attention has been trained on answer speed in CQAs hitherto. In one of the few studies that delved into this theme, the popularity of Yahoo! Answers was found to exceed that of Google Answers. This was partly because users could obtain answers faster from the former (Shah, Oh & Oh, 2008). In another related study, it was found that fastest answers in Yahoo! Answers were actually returned in a matter of a few minutes (Shah, 2011). To a large extent, the widespread support for Yahoo! Answers appears to lie in the promptness of its answers.
activities take place within the first hour after a question had been posted. The provision of fast answers was a major contributing factor to Stack Overflow’s success (Mamykina et al., 2011). Quite conceivably, CQA users value promptness in receiving answers, and are averse to any prolonged wait. In a study involving university students who interacted in an online question-answering platform, those who could not obtain their answers promptly did not even bother to return and check if their questions had been answered (Kitzie & Shah, 2011). Hence, the speed at which answers are obtained is crucial in determining continual patronage to a CQA site (Raban & Harper, 2008). Undoubtedly if a site does not offer quick turnaround time for users, its sustainability will be in jeopardy.
Question Types
While questions are posted in CQAs in free-form, they tend to be framed in a format, known as question types, that dictates the expected style of answers (Harper et al., 2010). When confronted with multiple answers to a given question, CQA users are inclined to select the best answer based on its question type. For instance, users who ask information-seeking questions tend to choose best answers based on clarity and accuracy while those asking for opinions show proclivity towards answers that carry elements of socio-emotional support (Kim, Oh & Oh, 2007). Question types were also found to have a significant influence on answerers’ effort and expertise, and hence on answer quality. In particular, questions seeking personal advice were found to attract the most effort and expertise from answerers (Harper et al., 2008).
constitute a significant fraction of all user queries on the web, for example, “Where was FIFA world cup 2010 held?” (Spink & Ozmutlu, 2001). List questions are similar to factoids but require collections of multiple related answers, for example, “What are the planets in the solar system?” (Lin & Katz, 2006). Definition questions are used to formally explain the meaning of a term, concept or acronym, for example, “What is fractional distillation?” (Voorhees, 2004). Complex interactive questions are specific context-based questions with a series of sub-questions, each being built on the previous question, for example, “What is diabetes mellitus? What is the treatment for diabetes mellitus?” (Dang, Lin & Kelly, 2007). Target questions seek instructions or procedures to accomplish a specific task, for example, “How do you change font in windows 7?” (Voorhees, 2005).
Methodology Selections of CQAs
Given that most CQA research narrowly focus on Yahoo! Answers (Fichman, 2011), this paper draws data from six popular CQAs, of which three are English and three are Chinese. These two languages were chosen for being the two most popular languages on the internet, supported by some 536.6 (26.8%) and 444.9 (24.2%) millions users respectively (Internet World Stats, 2012). Moreover, English CQAs are commonly used for research (eg. Gazan, 2006; Harper et al., 2008; Shah, 2011) while of late, Chinese CQAs such as Baidu Knows are increasingly being used by the scholarly community (eg. Deng, Liu & Qi, 2011; Wu, Zhao, Duan & Xu, 2005; Zheng et al., 2012).
Second, the CQAs must attract active participation from their online communities, resulting in a growing corpus of questions and answers. High internet traffic is indicative of active user participation. To check for unique visitor numbers, statistics from Compete Site Analytics and ChinaRank were used to select English CQAs and Chinese CQAs respectively.
The three English CQAs selected include Yahoo! Answers, WikiAnswers, and Answerbag, while the three Chinese CQAs chosen are Baidu Knows, Tencent Soso Wenwen, and Sina iAsk. All of them have been established for more than three years and attract at least 20,000 unique visitors per month on average.
Data Collection
non-chance level of agreement (Cohen, 1960). A few rounds of iterations were made to the gathering and coding of questions to ensure a balanced distribution of questions across the four categories and the five question types. The result was a collection of six sets of 100 questions, each comprising 25 questions from each of the four categories and 20 questions from each of the five question types.
The second step involved cross-posting of the gathered questions across the six CQAs. Specifically, 500 questions extracted from the other five CQAs were posted into each CQA. The questions extracted from the Chinese CQAs had to be translated to English while those drawn from the English counterparts had to be translated to Chinese. All translations were first done using Google Translate. The translated questions were jointly checked by the coders for accuracy and consistency, and rephrased if necessary. When needed, the coders conferred among themselves on the translated questions. Furthermore, care was taken to ensure that the original question type coded for each question was preserved. Since most CQAs did not support automated submission of questions, the questions were posted manually. To minimize any confounding effects of different time zones, time of the day, and day of the week on attracting answers from CQA users located around the globe, questions were posted throughout the day, seven days a week, with randomized timings as much as possible. Most CQAs imposed restrictions on the number of questions which could be posted per day. If the limit was exceeded, the coders were blocked as potential spammers. To avert derailment of the cross-posting process, they answered other bona fide CQA users’ questions to earn enough points to post more questions than they were ordinarily allowed.
of 5,356 answers were harvested. Along with the questions and their respective answers, related data items such as time-stamp and URLs were also collected.
Coding of Answer Quality
The data collection process was followed by coding of the quality scores for the harvested answers. Specifically, deductive content analysis was used (Krippendorf, 2004). It is a coding technique that uses a set of procedures to systematically and objectively identify characteristics within text (Neuendorf, 2002; Weber, 2003). Answer quality was coded independent of answer speed, and involved two stages. In the first stage, the three coders familiarized themselves with the attributes of answer quality (content value, cognitive value, and socio-emotional value), and independently rated an initial set of 180 answers randomly drawn from the six CQAs. A five-point Likert-scale (1=strongly disagree, 5=strongly agree) was used to denote the extent to which they agreed whether a given quality attribute could be observed in the answers. The mean pair-wise Cohen’s kappa among the coders was found to be 0.83, indicating non-chance level of agreement in quality scores (Cohen, 1960).
In the second stage, the remaining 5,176 answers were coded separately by the three coders in a non-overlapping fashion. The questions were distributed such that each coder could code answers from the six CQAs, the four categories and the five question types proportionately. Finally, the quality score of each answer was computed as the arithmetic mean of its scores on the three quality attributes.
Data Analysis
factorial ANOVA respectively), while RQ 4 was addressed using qualitative analysis. To address RQ 1 and RQ 2, all 5,356 answers were analyzed.
The scope of RQ3 and RQ4 is trained specifically on answers with more than two competing entries intended for a given question, since the median number of answers per question in the entire dataset was found to be two. This represented a total of 3,544 answers in response to 728 questions. By focusing only on these answers, the overlapping of data points in the best quality answers group and those in the fastest answers group would be minimized. Furthermore, by confining only to questions which had attracted multiple answers, a trend analysis of answer quality could be meaningfully undertaken.
Results
Descriptive Statistics
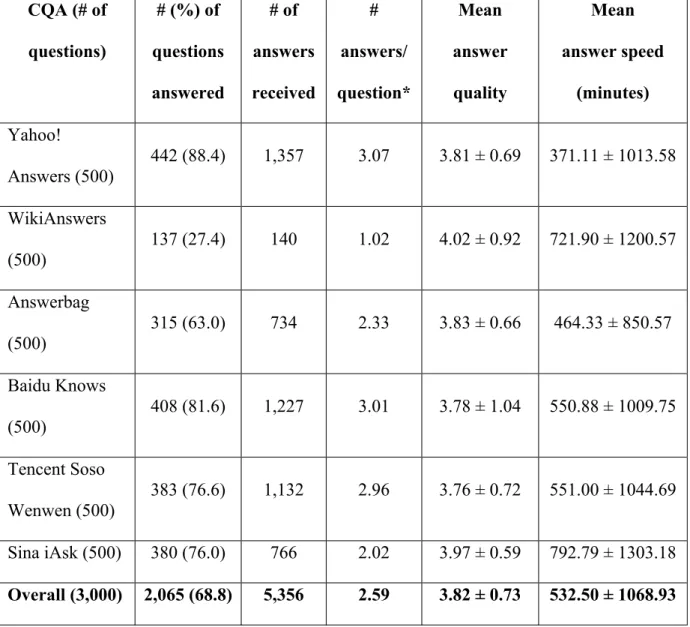
Of the 3,000 questions posted into the six CQAs, 2,065 were answered. A total of 5,356 answers were harvested: 2,231 from the three English CQAs, and 3,125 from the three Chinese CQAs. Table 1 shows the descriptive statistics of the dataset across the six CQAs.
Insert Table 1 here
Of the 2,065 questions that were answered, 862 attracted only one answer, while 475 received two answers. The remaining 728 questions attracted three or more answers. In particular, the maximum number of answers attracted by a question was found to be 26. The frequency distribution of questions against answers attracted per question exhibits a decreasing relationship, as shown in Figure 1.
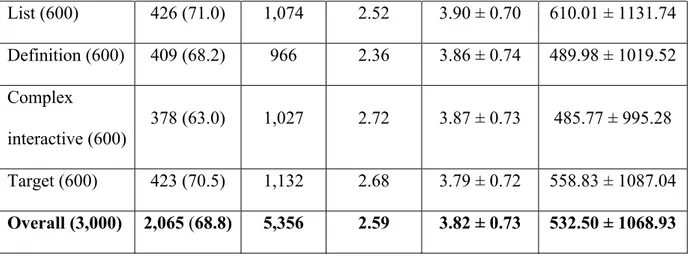
Across the five question types, factoid questions are most answered (71.5%), while complex interactive questions are least answered (63%). However, in terms of the number of answers per question, complex interactive questions top the pack (2.72) while definition questions occupy the other end of the spectrum (2.36). The question types in descending order of answer quality are as follows: list (3.90 ± 0.70), complex interactive (3.87± 0.73), definition (3.86 ± 0.74), factoid (3.81 ± 0.73) and target (3.79 ± 0.72). The question types in descending order of answer speed in minutes (starting from the fastest) are as follows: complex interactive (485.77 ± 995.28), definition (489.98 ± 1019.52), factoid (510.68 ± 1091.46), target (558.83 ± 1087.04) and list (610.01 ± 1131.74). Table 2 shows the descriptive statistics of the dataset across the five question types.
Insert Table 2 here
Table 3 shows the descriptive statistics of the dataset used for investigating RQ 3 and RQ 4. Specifically, target questions attracted more than two answers the highest number of times (28.5%), whereas complex interactive questions were found to lie at the other end of the spectrum (21.2%) despite receiving the highest number of answers per question.
Insert Table 3 here
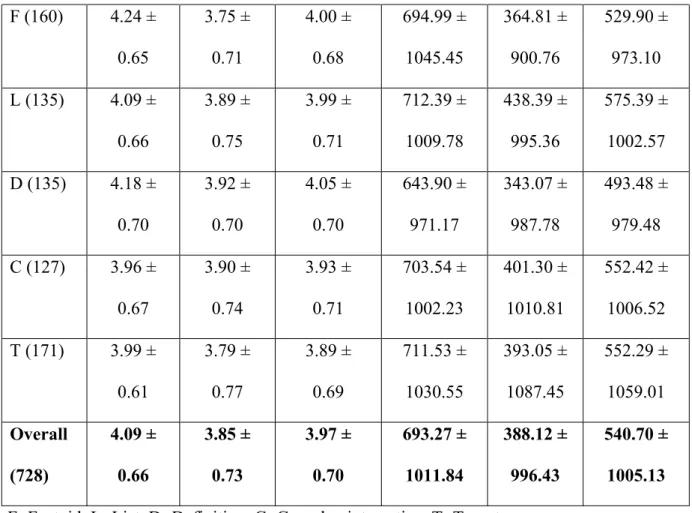
answers received for that question. An answer to a given question is regarded as the “fastest answer” if it is the earliest to arrive among other responses for that question. Across all the five question types, answer quality for the fastest answers (3.85 ± 0.73) is generally inferior vis-à-vis the best quality answers (4.09 ± 0.66), while the best quality answers generally arrive much later (693.27 ± 1011.84) than the fastest answers (388.12 ± 996.43).
Insert Table 4 here
Inferential Statistics
To address RQ 1, ANOVA was used to investigate whether answer quality and answer speed vary across question types. There was a significant difference in answer quality across the five question types [F (4, 5351) = 5.49, p < 0.05]. In particular, list questions attracted answers of the highest quality (M = 3.90). There was also a significant difference in answer speed across the question types [F (4, 5351) = 2.58, p < 0.05]. Complex interactive questions received the fastest answers (M = 485.77 min.). This suggests that differences in quality and speed of answers in CQAs could be attributed to question types.
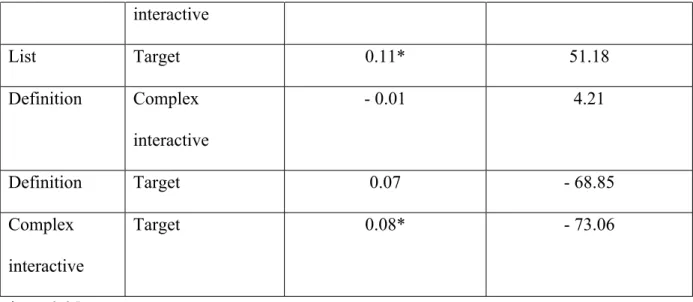
answers associated with target questions (M = 3.79). For answer speed, differences between two pairs of question types were statistically significant. First, the speed of answers to list questions (M = 610.01 min.) was poorer than that of definition questions (M = 489.98 min.). Second, the speed of answers to list questions (M = 610.01 min.) was poorer than that of complex interactive questions (M = 485.77 min.).
Insert Table 5 here
To address RQ 2, Pearson’s correlation was used to determine the relationship between answer quality and answer speed. Across all question types, there were generally no significant correlations between answer quality and answer speed. The exception was found only in definition questions which showed a weak Pearson’s correlation (r = -0.09, p < 0.05). The lack of correlation between quality and speed could point to the dynamic nature of CQAs, where neither all good quality answers arrive late, nor all fast answers lack in quality.
To address RQ 3, two groups of answers, namely, the best quality answers and the fastest answers in response to a given question were drawn from the dataset (N = 728 x 2 = 1,456). Thereafter, 2 (answer groups) X 5 (question types) factorial ANOVA was used to investigate the main effects and the interaction effects on both answer quality and answer speed. The presence of interaction effects was verified using interaction plots (Fu & Chen, 2011; Jansen, Zhang & Schultz, 2009; Tractinsky & Meyer, 1999).
for target questions (3.89 ± 0.69). As shown in the interaction plot (Figure 2), the magnitudes of the difference in answer quality for the best quality answers and the fastest answers across the five question types are not uniform. Hence, statistically significant interaction effect is also detected [F(4, 1446) = 12.30, p < 0.05]. The fastest answers to complex interactive questions turn out to be almost as good as the best quality answers. On the other hand, difference in answer quality between the best quality answers and the fastest answers for factoid questions is the most conspicuous.
Insert Figure 2 here
In terms of answer speed, there is a significant main effect of answer groups [F(1, 1446) = 33.09, p < 0.05]. The best quality answers (693.27 ± 1011.84 min.) take longer to arrive than the fastest answers (388.12 ± 996.43 min.). There is also a significant main effect of question types [F(4, 1446) = 3.89, p < 0.05]. Across all the best quality answers and the fastest answers, answer speed is the fastest for definition questions (mean=493.48 min.; SD=979.48 min.) and slowest for list questions (mean=575.39 min.; SD=1002.57 min.). However as shown in the interaction plot (Figure 3), the magnitudes of the difference in answer speed for the best quality answers and the fastest answers across the five question types are nearly uniform. As expected, statistically significant interaction effect is not detected. The best quality answers consistently take longer to arrive than the fastest answers across all question types.
Insert Figure 3 here
To address RQ 4, the 3,544 answers were manually reviewed to disinter the trends of answer quality over time across question types. Based on the observations, four trends in answer quality were identified: (1) increasing, when answer quality improved over time; (2) decreasing, when answer quality deteriorated over time; (3) steady, when answer quality remained uniform without variations; and (4) random, when answer quality wavered irregularly. As shown in Table 6, the most commonly observed trend of answer quality is random (45.1%), followed by steady (27.5%), increasing (17.0%), and decreasing (10.4%). Questions showing increasing and decreasing trends in answer quality were analyzed further.
Insert Table 6 here
Increasing trend of answer quality is most conspicuously observed among factoid questions (22.5%), followed by list (19.2%), definition (16.3%), complex interactive (14.2%) and target (12.8%) questions. For instance, the factoid question “How many championships did Kobe Bryant take?” which appears to seek factual and objective answers attracted nine responses in Yahoo! Answers. Most of the answers such as “5 championships”, “5 rings” that arrived within the first hour are terse and incomplete. However, the last answer “Kobe Bryant has won a total of five NBA Championships during the 1999-2000 season, 2000-2001 season, 2001-2002 season, 2008-2009 season, and 2009-2010 season.” posted more than three hours after the question, is of the best quality vis-à-vis the rest of the answers.
sporting goods stores” was received 10 hours after the question was posted. The second answer “Wipe, clean the stick…a long time” and the third answer “Put the ball cleaning agent…protective film” came in four hours and six hours after the first answer respectively. All three answers are of comparable quality. However, the fourth answer “Wash any time” posted on the second day lacks in all the quality attributes. This represents a possible case where the answer might have been posted with mischievous intentions to mock the asker (Suryanto et al., 2009).
Irrespective of the question types, a sizeable proportion of the questions (45.1%) received answers with random quality trends (45.1%). This is conceivable given the dynamics of online communities in CQAs. Interestingly, the steady (27.5%) and the increasing (17%) quality trends are found to dominate over the decreasing (10.4%) quality trend. In particular, for factoid, list and target questions, the combined steady and increasing quality trends (47.5%, 47.4%, 45.6% respectively) is even higher than their random quality trends (43.7%, 44.4%, 38.6% respectively). CQA users could have taken the cues from earlier responses to produce answers which are of comparable or even better quality.
Discussion
with prior research, users appear to be driven by different extrinsic and intrinsic motivations in answering different types of questions (Raban & Harper, 2008).
Factoid questions are most answered probably because they constitute the most familiar question type in CQAs (Spink & Ozmutlu, 2001). Complex interactive questions, on the other hand, can be challenging, and are thus least answered (Dang, Lin & Kelly, 2007). However, once the first answer to a complex interactive question has been submitted, it seems to pique the interests of other users who offer more answers. Hence, despite being the least answered question type, complex interactive questions receive the most number of answers per question. This could be a reflection of users’ tendency of self-presentation (Goffman, 1959; Schau & Gilly, 2003). They may wish to show their abilities in answering challenging questions to obtain social status and reputation in the online community. The inability of definition questions to attract multiple answers per question can possibly be due to the stereotypical nature of their answers (Voorhees, 2004). Since multiple answers will invariably lead to redundancy, users tend to refrain from answering when an answer has already been submitted.
Second, the interaction plots for answer quality (Figure 1) and answer speed (Figure 2) across answer groups and question types suggest that quality and speed do not generally go hand in hand in the context of CQAs (Shah, 2011). On average, the best quality answers have better overall quality than the fastest answers. At the same time, the fastest answers generally arrive faster than the best quality answers. This suggests that prompt answers tend to lack quality.
earlier, the quality of answers submitted later only improve marginally compared to the initial ones. The cognitively demanding nature of complex interactive questions seems to make them difficult to be effectively mitigated with time (Dang, Lin & Kelly, 2007).
Third, though the trend in answer quality has been mostly random across all question types, quality of answers appear to improve gradually when given time. Apart from the random trend, the steady and the increasing quality trends cumulatively exceed the decreasing trend for every question type. The initial answers to a given question may set the quality benchmark in such a way that future answers would generally be of the same quality or even better. This might be vestige of the collaborative learning pattern among CQA users through iterative rounds of answering (Berlanga et al., 2008). CQAs thus act as collaborative learning environments where the communities tend to establish norms, thereby fostering a sense of co-accomplishment (Lee, 2004).
remains limited scope of improvement in the subsequent answers. This may nullify or even hinder collaborative learning among users in CQAs.
Fourth, while cross-lingual analysis is not the main focus of this paper, it is interesting to note that the English CQAs tend to attract fewer answers compared to the Chinese CQAs. Of all questions posted into the English CQAs, 894 were answered, which yielded a total of 2,231 answers. However, for the Chinese CQAs, 1,171 were answered, resulting in a total of 3,125 answers. This is suggestive of the collectivist social orientations among Chinese users, who are greatly motivated by the expectation of social reciprocity (Varnum et al., 2010). To augment prior research, the findings highlight that such social pressures may be less prevalent among English users.
The quality of answers in the English CQAs (3.84 ± 0.75) is similar to that of the Chinese CQAs (3.81 ± 0.79). However, answer speed in minutes is much better for the English CQAs (423.79 ± 1109.21) compared to the Chinese CQAs (610.19 ± 1021.25). Perhaps, English users are independent and value promptness more than their Chinese counterparts. Chinese users, on the other hand, appear more reliant on cues from initial answers to contribute (Nisbett et al., 2001; Varnum et al., 2010). Consistent with prior research, the findings suggest that cultural differences significantly influence users’ asking and answering patterns in CQAs (Yang et al., 2011).
Conclusion
suggests that quality and speed of answers in CQAs are dependent on question types. Second, there were generally no significant correlations between answer quality and answer speed across all question types. Such lack of correlation could point to the dynamic nature of CQAs, where neither all good quality answers arrive late, nor all fast answers lack in quality. Third, both answer quality and answer speed are affected by answer groups and question types. The best quality answers have better overall answer quality than the fastest answers but generally take longer to arrive. However, the fastest answers to complex interactive questions turn out almost as good as the best quality answers. Fourth, though the trend in answer quality has been mostly random across all question types, quality of answers appears to improve gradually when given time. Apart from the random trend, the steady and the increasing quality trends cumulatively exceed the decreasing trend for every question type. This might be vestige of the collaborative learning pattern among CQA users.
This paper represents an attempt to enrich CQA research with the twin-focus on answer quality and answer speed. Having investigated whether good quality answers are fast, and if fast answers are rich in quality across five question types, it highlights subtle nuances among answers which have thus far been largely obscured. It also sheds light on how different question types tend to elicit answers of varying quality and speed. The findings offer useful insights into the ways questions could be framed to draw better and faster responses. Though it appears that quality and speed do not generally go hand in hand in CQAs, the complex interactive question type appears most likely to draw fast answers of good quality.
singularly. Answers marginally lower in quality than the best quality answers or those received within seconds or minutes after the fastest answers were not accorded more importance vis-à-vis other answers in terms of quality and speed respectively.
Going forward, a number of future research directions can be identified. One possible area of investigation would be to analyze whether use of a CQA site is influenced by the usability of its GUI, and how GUI affects users’ behavior across cultures, both as askers and answerers. A second direction would be to analyze whether quality and speed of answers vary with question category such as entertainment, sports, computer/internet and science/mathematics. A third suggestion for future research would be to evaluate how the scope and comprehensiveness of CQA corpora vary with question category and type.
For designers, one direction would be to explore how CQA interfaces can facilitate easy access to good and fast answers. Another area could be to improve the systems in ways that can encourage users to post good quality answers promptly. For example, the points system in CQAs could be tweaked to recognize quality and speed. Additionally, CQAs could be gamified (Deterding, Dixon, Khaled & Nacke, 2011) to make participation more compelling and fun. Hopefully, this paper serves as a springboard to generate more ideas on how good quality answers can come in faster, and fast answers can have better quality.
Acknowledgements
This work is supported by Nanyang Technological University Research Grant AcRF Tier 1 (RG58/09).
Agichtein, E., Castillo, C., Donato, D., Gionis, A., & Mishne, G. (2008). Finding high-quality content in social media. Proceedings of the International Conference on Web Search and Web Data Mining (pp. 183 - 194). New York: ACM.
Barry, C.L. (1994). User-defined relevance criteria: An exploratory study. Journal of the American Society for Information Science, 45(3), 149-159.
Berlanga, A.J., Sloep, P.B., Kester, L., Brouns, F., van Rosmalen, P. & Koper, R. (2008). Ad hoc transient communities: towards fostering knowledge sharing in learning networks. International Journal of Learning Technology, 3(4), 443-458.
Blooma, M.J., Chua, A.Y.K. & Goh, D.H.L. (2010, April). Selection of the best answer in CQA services. Proceedings of the 7th International Conference on Information
Technology: New Generations (ITNG '10), Las Vegas, NV, USA, 534-539.
Blooma, M.J., Chua, A.Y.K. & Goh, D.H.L. (2011). What makes a high-quality user-generated answer? IEEE Internet Computing, 15(1), 66-71.
Christensen, L.B., Johnson, R.B. & Turner, L.A. (2010). Research methods, design, and analysis. Pearson Education.
Cohen, J. (1960). A coefficient of agreement for nominal scales. Educational and Psychological Measurement, 20(1), 37-46.
Cool, C., Belkin, N.J., Frieder, O. & Kantor, P. (1993). Characteristics of texts affecting relevance judgments. In M.E. Williams (Ed.), Proceedings of the 14thNational Online
Meeting (pp. 77-84). Medford, NJ: Learned Information.
Dang, H.T., Lin, J. & Kelly, D. (2007). Overview of the TREC 2006 question answering track. Proceedings of the 15thText REtrieval Conference (TREC '07), 99-116.
Deterding, S., Dixon, D., Khaled, R. & Nacke, L.E. (2011). Gamification: Toward a Definition. In D. Tan & B. Begole (Eds.). Design, 12-15. Retrieved June 20, 2012 from http://gamification-research.org/wp-content/uploads/2011/04/02-Deterding-Khaled-Nacke-Dixon.pdf
Fichman, P. (2011). A comparative assessment of answer quality on four question answering sites. Journal of Information Science, 37(5), 476-486.
Fu, J. & Chen, J.H.F. (2011). The impact of seller expertise and a refund guarantee on auction outcome: Evidence from an online field experiment of camera lens market. International Journal of Electronic Business Management, 9(3), 187-195.
Fung, T.K.F. (2008). Banking with a personalized touch: examining the impact of website customization on commitment. Journal of Electronic Commerce Research, 9(4), 296-309.
Gazan, R. (2006). Specialists and synthesists in a question answering community. Proceedings of the American Society for Information Science and Technology, 43, 1-10.
Goffman, E. (1959). The presentation of self in everyday life. Doubleday, New York: Anchor Books.
Harper, F. M., Raban, D., Rafaeli, S. & Konstan, J. A. (2008). Predictors of answer quality in online Q&A sites. Proceedings of the ACM Conference on Human Factors in Computing Systems (pp. 865-874). New York: ACM.
Internet World Stats (2012). Internet world users by language. Retrieved June 20, 2012 from http://www.internetworldstats.com/stats7.htm
Jansen, B.J., Zhang, M. & Schultz, C.D. (2009). Brand and its effect on user perception of search engine performance. Journal of the American Society for Information Science and Technology, 60(8), 1572-1595.
Kahn, B.K., Strong, D.M. & Wang, R.Y. (2002). Information quality benchmarks: product and service performance. Communications of the ACM, 45(4), 184−192.
Kelly, D., Wacholder, N., Rittman, R., Sun, Y., Kantor, P., Small, S. & Strzalkowski, T. (2007). Using interview data to identify evaluation criteria for interactive, analytical question-answering systems. Journal of the American Society for Information Science and Technology, 58(7), 1032-1043.
Kim, S., Oh, J. & Oh, S. (2007). Best–answer selection criteria in a social Q&A site from the user–oriented relevance perspective. Proceedings of the American Society for Information Science and Technology, 44, 1–15.
Kim, S. & Oh, S. (2009). Users' relevance criteria for evaluating answers in a social questions and answers site. Journal of the American Society for Information Science and Technology, 60(4), 716-727.
Kitzie, V. & Shah, C. (2011). Faster, better, or both? Looking at both sides of online question answering coin. Proceedings of the American Society for Information Science and Technology, 48, 1-4.
Krippendorf, K. (2004). Content analysis: An introduction to its methodology. Beverly Hills, CA: Sage Publications.
Lee, D. (2004). Sense of co-accomplishment in collaborative work as threshold in establishing a sense of community in an online course. Unpublished doctoral dissertation, University of Texas at Austin.
Lin, J. & Katz, B. (2006). Building a reusable test collection for question answering. Journal of the American Society for Information Science and Technology, 57(7), 851-861. Mamykina, L., Manoim, B., Mittal, M., Hripcsak, G. & Hartmann, B. (2011). Design lessons
from the fastest Q&A site in the west. Proceedings of the ACM Conference on Human Factors in Computing Systems (pp. 2857-2866). New York: ACM.
Nam, K.K., Ackerman, M.S. & Adamic, L.A. (2009). Questions in, Knowledge-iN?: A study of Naver’s question answering community. Proceedings of the ACM Conference on Human Factors in Computing Systems (pp. 779-788). New York: ACM.
Neuendorf, K.A. (2002). The content analysis guidebook. Beverly Hills, CA: Sage Publications.
Nisbett, R.E., Peng, K., Choi, I., & Norenzayan, A. (2001). Culture and systems of thought: Holistic versus analytic cognition. Psychological Review, 108(2), 291–310.
Park, T. (1993). The nature of relevance in information retrieval: empirical study. Library Quarterly, 63(3), 318-351.
Potter, W.J. & Levine-Donnerstein, D. (1999). Rethinking validity and reliability in content analysis. Journal of Applied Communication Research, 27(3), 258–284.
Raban, D.R. & Harper, F.M. (2008). Motivations for Answering Questions Online. In Caspi, D., & Azran, T. (Eds.), New Media and Innovative Technologies. Be’er Shiva, Israel: Burda Research Center and Ben Gurion University.
Roussinov, D., Fan, W. & Robles-Flores, J. (2008). Beyond keywords: Automated question answering on the web. Communications of the ACM, 51(9), 60-65.
Saracevic, T. (2007), Relevance: A review of the literature and a framework for thinking on the notion in information science. Part III: Behavior and effects of relevance. Journal of the American Society for Information Science and Technology, 58(13), 2126–2144. Schamber, L. (1994). Relevance and information behavior. Annual Review of Information
Science and Technology, 29, 3-48.
Schau, H.J. & Gilly, M.C. (2003). We are what we post? Self-presentation in personal web space. Journal of Consumer Research, 30(3), 385-404.
Shachaf, P. (2009). The paradox of expertise: Is the Wikipedia Reference Desk as good as your library? Journal of Documentation, 65(6), 977–996.
Shah, C. (2011, February 7). Effectiveness and user satisfaction in Yahoo! Answers. First Monday, 16(2). Retrieved June 16, 2012 from http://firstmonday.org/htbin/cgiwrap/ bin/ojs/index.php/fm/article/view/3092/2769
Shah, C., Oh, J. S. & Oh, S. (2008, September 1). Exploring characteristics and effects of user participation in online social Q&A sites. First Monday, 13(9). Retrieved June 10, 2012 from http://firstmonday.org/htbin/cgiwrap/bin/ojs/index.php/fm/article/view/21 82/2028
Spink, A. & Ozmutlu, H. C. (2001). What do people ask on the web and how do they ask it: Ask Jeeves query analysis. Proceedings of the American Society for Information Science and Technology, 38, 545-554.
Suryanto, M.A., Sun, A., Lim, E. & Chiang, R.H.L. (2009, February). Quality-aware collaborative question answering: Methods and evaluation. Proceedings of the Second ACM International Conference on Web Search and Data Mining, Barcelona, Spain. Tractinsky, N. & Meyer, J. (1999). Chartjunk or goldgraph? Effects of presentation
objectives and content desirability on information presentation. MIS Quarterly, 23(3), 397-420.
Varnum, M.E.W., Grossmann, I., Kitayama, S., & Nisbett, R.E. (2010). The origin of cultural differences in cognition: The social orientation hypothesis. Current Directions in Psychological Science, 10(1), 9-13.
Voorhees, E.M. (2004). Overview of the TREC 2003 question answering track. Proceedings of the 12thText REtrieval Conference (TREC '04), 54-68.
Voorhees, E.M. (2005). Overview of the TREC 2004 question answering track. Proceedings of the 13thText REtrieval Conference (TREC '05), 52-62.
Weber, T.A. (2003). An exact relation between willingness to pay and willingness to accept. Economics Letters, 80(3), 311–315.
Wu, Y.Z., Zhao, J., Duan, X. & Xu, B. (2005). Research on question answering and evaluation: a survey. Journal of Chinese Information Processing, 19(3), 1-13.
Yang, J., Morris, M.R., Teevan, J., Adamic, L. & Ackerman, M. (2011). Culture matters: A survey study of social Q&A behavior. Proceedings of the International Conference on Weblogs and Social Media, Barcelona, Spain.
Tables:
Table 1: Descriptive statistics across the six CQAs.
Table 2: Descriptive statistics across the five question types. Table 3: Descriptive statistics of the dataset for RQ 3 and RQ 4.
Table 4: Mean quality and speed for the best quality answers and the fastest answers. Table 5: Results of Tukey’s Honestly Significant Difference Post-hoc test.
Table 6: Summary of the trends in answer quality for RQ 4.
Figures:
Figure 1: Frequency distribution of questions against answers attracted. Figure 2: Interaction plot for answer quality.
Tables:
Table 1: Descriptive statistics across the six CQAs.
CQA (# of questions)
# (%) of questions answered # of answers received # answers/ question* Mean answer quality Mean answer speed (minutes) Yahoo!
Answers (500) 442 (88.4) 1,357 3.07 3.81 ± 0.69 371.11 ± 1013.58 WikiAnswers
(500) 137 (27.4) 140 1.02 4.02 ± 0.92 721.90 ± 1200.57 Answerbag
(500) 315 (63.0) 734 2.33 3.83 ± 0.66 464.33 ± 850.57 Baidu Knows
(500) 408 (81.6) 1,227 3.01 3.78 ± 1.04 550.88 ± 1009.75 Tencent Soso
Wenwen (500) 383 (76.6) 1,132 2.96 3.76 ± 0.72 551.00 ± 1044.69 Sina iAsk (500) 380 (76.0) 766 2.02 3.97 ± 0.59 792.79 ± 1303.18
Overall (3,000) 2,065 (68.8) 5,356 2.59 3.82 ± 0.73 532.50 ± 1068.93
* Questions include only those that received at least one answer
Table 2: Descriptive statistics across the five question types.
Question type (#)
# (%) of questions answered # of answers received # answers/ question* Mean answer quality Mean answer speed (minutes)
List (600) 426 (71.0) 1,074 2.52 3.90 ± 0.70 610.01 ± 1131.74 Definition (600) 409 (68.2) 966 2.36 3.86 ± 0.74 489.98 ± 1019.52 Complex
interactive (600) 378 (63.0) 1,027 2.72 3.87 ± 0.73 485.77 ± 995.28 Target (600) 423 (70.5) 1,132 2.68 3.79 ± 0.72 558.83 ± 1087.04
Overall (3,000) 2,065(68.8) 5,356 2.59 3.82 ± 0.73 532.50 ± 1068.93
* Questions include only those that received at least one answer
Table 3: Descriptive statistics of the dataset for RQ 3 and RQ 4.
Question type (#)
# (%) of questions > 2 answers # of answers received # answers/ question* Mean answer quality Mean answer speed (minutes)
Factoid (600) 160 (26.7) 794 4.96 3.78 ± 0.73 498.25 ± 1081.81 List (600) 135 (22.5) 691 5.12 3.92 ± 0.66 551.24 ± 1043.61 Definition (600) 135 (22.5) 604 4.47 3.82 ± 0.78 452.71 ± 977.50 Complex
interactive (600) 127 (21.2) 684 5.39
3.89 ± 0.66 436.40 ± 921.10
Target (600) 171 (28.5) 771 4.51 3.80 ± 0.70 568.47 ± 1108.85
Overall (3,000) 728 (24.3) 3,544 4.87 3.84 ± 0.71 501.41 ± 1026.57
* Questions include only those that received more than two answers
Table 4: Mean quality and speed for the best quality answers and the fastest answers.
Question type (#)
F (160) 4.24 ± 0.65 3.75 ± 0.71 4.00 ± 0.68 694.99 ± 1045.45 364.81 ± 900.76 529.90 ± 973.10 L (135) 4.09 ±
0.66 3.89 ± 0.75 3.99 ± 0.71 712.39 ± 1009.78 438.39 ± 995.36 575.39 ± 1002.57 D (135) 4.18 ±
0.70 3.92 ± 0.70 4.05 ± 0.70 643.90 ± 971.17 343.07 ± 987.78 493.48 ± 979.48 C (127) 3.96 ±
0.67 3.90 ± 0.74 3.93 ± 0.71 703.54 ± 1002.23 401.30 ± 1010.81 552.42 ± 1006.52 T (171) 3.99 ±
0.61 3.79 ± 0.77 3.89 ± 0.69 711.53 ± 1030.55 393.05 ± 1087.45 552.29 ± 1059.01 Overall (728) 4.09 ± 0.66 3.85 ± 0.73 3.97 ± 0.70 693.27 ± 1011.84 388.12 ± 996.43 540.70 ± 1005.13
F=Factoid, L=List, D=Definition, C=Complex interactive, T=Target
Table 5: Results of Tukey’s Honestly Significant Difference Post-hoc test.
Question Type (I)
Question Type (J)
Mean differences (I – J)
Answer quality Answer speed (minutes)
Factoid List - 0.09* - 99.33
Factoid Definition - 0.05 20.70
Factoid Complex interactive
- 0.06 24.91
Factoid Target 0.02 - 48.15
List Definition 0.04 120.03*
interactive
List Target 0.11* 51.18
Definition Complex interactive
- 0.01 4.21
Definition Target 0.07 - 68.85
Complex interactive
Target 0.08* - 73.06
* p < 0.05
Table 6: Summary of the trends in answer quality for RQ 4.
Question type (#)
# (%) increasing quality
# (%) decreasing quality
# (%) steady quality
# (%) random quality
F (160) 36 (22.5) 14 (8.8) 40 (25.0) 70 (43.7) L (135) 26 (19.2) 11 (8.2) 38 (28.2) 60 (44.4) D(135) 22 (16.3) 12 (8.9) 27 (20.0) 74 (54.8) C (127) 18 (14.2) 12 (9.5) 39 (30.7) 58 (45.6) T (171) 22 (12.8) 27 (15.8) 56 (32.8) 66 (38.6)
Overall
(728) 124 (17.0) 76 (10.4) 200 (27.5) 328 (45.1)
Figure 1