promoting access to White Rose research papers
Universities of Leeds, Sheffield and York
http://eprints.whiterose.ac.uk/
This is an author produced version of a paper published in Building and Environment.
White Rose Research Online URL for this paper:
http://eprints.whiterose.ac.uk/77744/
Paper:
Hathway, EA, Noakes, CJ, Sleigh, PA and Fletcher, LA (2011) CFD simulation of airborne pathogen transport due to human activities. Building and Environment, 46 (12). 2500 – 2511.
CFD simulation of airborne pathogen transport due to human activities
Hathway, E.A.a,b* Noakes, C.J.aSleigh, P.A.aFletcher, L.A.a
aPathogen Control Engineering Institute, Department of Civil Engineering, University of Leeds,
UK
bPermanent address: Department of Civil and Structural Engineering, University of Sheffield,
Mappin Street, Sheffield, S1 3JD, UK
*Corresponding author. Tel.: +44 (0) 114 2225702; Fax: +44 (0) 114 2225700 Email address: a.hathway@sheffield.ac.uk
Abstract
Computational Fluid Dynamics (CFD) is an increasingly popular tool for studying the impact of design interventions on the transport of infectious microorganisms. While much of the focus is on respiratory infections, there is substantial evidence that certain pathogens, such as those which colonise the skin, can be released into, and transported through the air through routine activities. In these situations the bacteria is released over a volume of space, with different intensities and locations varying in time rather than being released at a single point.
This paper considers the application of CFD modelling to the evaluation of risk from this type of bioaerosol generation. An experimental validation study provides a direct comparison between CFD simulations and bioaerosol distribution, showing that passive scalar and particle tracking approaches are both appropriate for small particle bioaerosols. The study introduces a zonal source, which aims to represent the time averaged release of bacteria from an activity within a zone around the entire location the release takes place. This approach is shown to perform well when validated numerically though comparison with the time averaged dispersion patterns from a transient source. However, the ability of a point source to represent such dispersion is dependent on airflow regime. The applicability of the model is demonstrated using a simulation of an isolation room representing the release of bacteria from bedmaking.
1. Introduction
Transmission of infection by airborne routes is widely recognised as key factor in the spread of many diseases including Tuberculosis, Severe Acute Respiratory Syndrome (SARS) and
Influenza, and control strategies involving ventilation design and face masks for patients and staff are widely advocated [1]. However, despite a growing body of evidence that aerial transmission may be important, there is little research on strategies to control airborne
transport and environmental contamination arising from pathogens that colonise the skin, such as Methicillin ResistantStaphylococcus aureus(MRSA). Although MRSA is primarily transferred via contact spread it may also colonise the nasal passages as a result of airborne contamination [2], spreading to the skin and potentially resulting in further transfer to wounds or ingestion [3]. Since MRSA has the ability to survive for several months on hospital surfaces [4,5] any airborne particles depositing on surfaces have the potential to create long term reservoirs of infectious material that can be transferred by touch to new patients. Boswell and Fox [6] showed surface contamination reduced when portable air cleaning devices were deployed, clearly indicating that airborne transport plays a role in the dispersion of MRSA in the environment. The release of particles contaminated with MRSA into the air may occur from the skin which is shed during routine activities such as walking [7,8], bedmaking [9-11] and undressing and washing [7,12,13]. In such cases dispersion does not occur from a single point in space, as a respiratory release. Instead the dispersal of bacteria will vary in spatial location and intensity depending on the activity. Understanding this release, and the likely environmental contamination that results, is key to developing appropriate interventions for reducing the aerial transmission of such pathogens.
In this paper we consider the development, validation and application of appropriate Computational Fluid Dynamics (CFD) models for evaluating the airborne dispersion of pathogens in hospital environments due to activity. The study has three main objectives to assess the transport model assumptions, source definition and applicability of CFD models in a typical ward environment:
1. Experimental validation of modelling techniques for bioaerosol transport: bioaerosol experiments are conducted in a climatically controlled chamber in order to validate the transport simulations within the CFD model using both passive scalar and Lagrangian particle tracking for comparison. Two different bioaerosol sources are used, a single point source and a linear source which releases bioaerosols across its length.
moves within the zone. The methodology is numerically validated by comparing the dispersion patterns from a steady state release of bioaerosols over a zonal source with the dispersion from a source that traverses the space with time.
3. Sensitivity analysis in a realistic application:The geometry of the zonal source is designed to encompass the region the bioaerosol release takes place. For certain activities the exact dimensions of the zonal source will be difficult to define. Therefore the sensitivity of the zonal source to the definition of size and shape was studied based on the simulation of an isolation room. This was also compared to the sensitivity of the point source release to the injection location to draw conclusions about the appropriateness of both source representations in modelling pathogen dispersion
1.1 CFD modelling of pathogen dispersion
CFD modelling is an increasingly popular approach that has the potential to give some insight into the airborne dispersion of infectious microorganisms and the effectiveness of control strategies. Many studies focus on ventilation design and range from single and multibed ward spaces [14-17] to high risk areas such as operating theatres [18], treatment rooms and isolation rooms [19,20]. Other related applications include outdoor pathogen dispersion in the SARS outbreak [21] and assessing air disinfection device performance [22]. However the validity of such simulations relies on appropriate definition of a pathogen source and an appropriate model for the transport of the pathogen through the air.
Pathogen transport is typically approached in one of two ways. A passive scalar model treats airborne pathogens as a concentration that is transported with the air. Particle properties are approximated through a diffusion coefficient, but the actual particle dynamics are not
incorporated. As such the model tends to be used for demonstrating ventilation efficacy [23] and in the context of pathogens is regarded as acceptable for simulating respiratory diseases where the particle size is below 2m [14,15]. The airborne pathogen concentration can easily be presented and is ideal for showing steady state behaviour where there is a continuous source. Alternatively the movement of individual particles can be tracked using a Lagrangian particle tracking model. This considers the forces on particles due to their mass and
momentum, producing path lines that are dependent on particle size and density as well as the local airflow. In theory the technique can be applied to any particle size and can also be used to evaluate deposition patterns. The main limitation of the approach is that tracking is time
dependant and it is therefore difficult to determine steady state airborne contaminant distributions.
distribution in a space [24,25] except very close to the source [26]. Particle tracking models have been compared against experiments conducted over a wide range of particle sizes. Particle mass concentration is well represented provided a large enough number of particles are injected in the model [27,28], while good correlation with particle distribution has been demonstrated up to 10m [29,30] except in areas of high gradients such as close to the source or at air inlets. Recent studies have indicated that including the effects of turbulent diffusion through a Discrete Random Walk (DRW) model improves the predictions, with Wanet al[31] showing good vertical and horizontal distribution of particles using a DRW approach, although Lai and Chen [32] indicate that the model is highly sensitive to grid size particularly when modelling particle deposition.
While these studies demonstrate the ability of both approaches to represent general
contaminant behaviour, they are not compared directly to bioaerosol dispersion, most probably due to the difficulty in conducting such experiments. A number of studies provide indirect evidence by showing that bioaerosols compare well to experimental particle tracers [33,34]. Some authors have also attempted to validate by comparison with microorganism deposition in real environments such as operating theatres [35] but found that the lack of control in the experiment and inability to incorporate the movement of people into the CFD model resulted in discrepancies between the two. Apart from some limited data in Noakeset al[33], there is a notable absence in the literature of clear comparisions between airborne microorganism behaviour and CFD models conducted under controlled conditions.
The source definition is also an important consideration in a CFD model. As much of the current literature focuses on respiratory infections, models tend to define the contaminant injection as a point source located at the patient’s head. While this approach is appropriate in many cases it is clearly not valid where pathogens are released over a significant spatial zone, such as the dispersion of MRSA through activity. Some studies of operating theatres have recognised this [18,36] and represented dispersal from the skin by a plane rather than a point source, but offered no validation of the method.
2. Methodology
2.1 Experimental chamber and methods
Experiments were carried out in a 32.25m3(3.35 x4.26 x 2.26m) mechanically ventilated
the bioaerosol source and sample tubes, there were no heat sources in the space and the room air was maintained at 21(±1.1) °C and 50(±20)%RH.
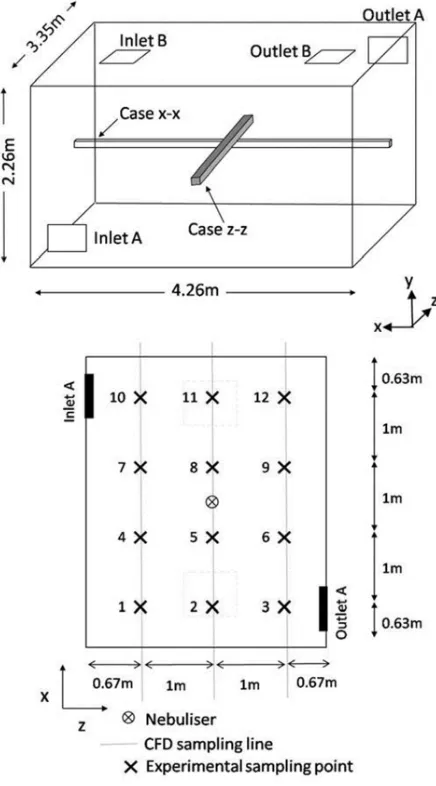
Figure 1: Schematic of the controlled experimental chamber (top). Plan of the experimental chamber showing sample points and equivalent CFD sample lines for comparison (bottom).
Bioaerosols were generated using a six jet collison nebulizer (CN 25, BGI Inc, USA) operated at 12l/min with a maintained pressure of 20psi. These were injected into the space via a 34mm diameter plastic pipe that terminated with 3 parallel sets of 4 holes, spaced equally apart around the pipe and located in the centre of the room to simulate apoint source. Alinear sourcewas also created using 8 repeats of the point source spread equally over a distance of 750mm. A pure culture ofSerratia marcescens(ATC274) was used to create the bioaerosols. This is a non fastidious organism that grows on general purpose media and performs
[38]. The nebulised liquid was created out of a 2ml aliquot with concentration of approximately 1x10⁹per ml suspended in 100ml of sterile distilled water.
For passive scalar validation the chamber was ventilated at a constant rate of either 6 or 12 ac/h for 4 hours during which time the nebulizer was operated continuously. Forty five minutes were allowed for the ventilation air and bioaerosol concentration to stabilise, then air samples were taken sequentially from each of the 12 sampling locations (Figure 1) every 10 minutes. Air was sampled through 5mm plastic tubes using an Andersen sampler (Anderson Instruments, USA) and impacted onto 90mm diameter plastic agar plates filled with Nutrient Agar. These were incubated for 24 hours at 37°C and the resulting colony forming units (cfus) were counted and subjected to positive hole correction [39] before quantifying the concentration ofSerratia marcesensin cfu/m3.Twelve sample repeats were carried out at each 12 locations spread over
three distinct experiments.
Deposition of bioaerosol particles on the chamber floor was measured for comparison with the Langrangian particle tracking model. In these experiments 21 nutrient agar plates were spaced out across the floor. The room was ventilated at a constant rate of 3 ac/h for 3 hours with bacteria injected as above for the first 1.5 hours. Air samples were taken every 20 minutes (equivalent to 1 air change rate). The air samples followed the same procedure as above but used only one sampling point close to outlet A. Following the experiment all the plates were incubated for 24 hours at 37°C and the colonies counted.
2.2 Numerical Airflow Simulation
temperature and humidity was controlled. The ventilation was regime A only, and simulations were carried out at three air exchange rates; 3, 6 and 12ac/h.
Model 2:The second model was used to carry out the numerical validation of the zonal source concept. The geometry was as model 1, and the simulations were again isothermal. In this case ventilation regimes A and B were both considered with all simulations at an air change rate of 6 ac/h.
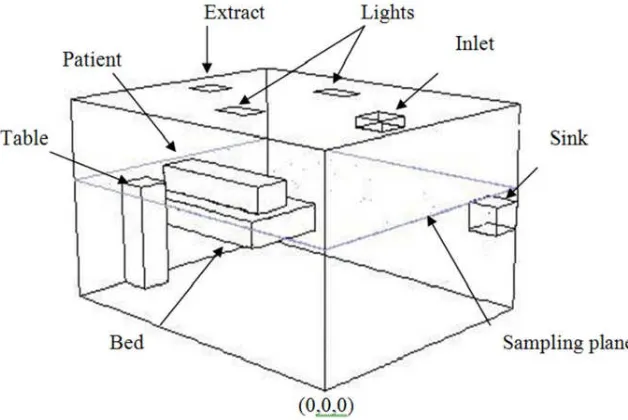
[image:8.595.138.452.321.531.2]Model 3:The final study applied the concept to a realistic room scenario. The model was refined to include a table, bed including reposed patient and sink in order to represent an isolation room (Figure 2). Heat sources were applied to the lights (50W/m2) and the patients (60W/m2). The air change rate was 10ac/h with an extract of -10pa in line with UK design guidance for isolation rooms [40].
Figure 2: Isolation room geometry (model 3)
For all models second order discretisation of the governing equations was used and solutions found using a segregated implicit solver. Convergence was defined when residuals were less than 5 x 10⁻⁴and the net imbalance of mass flow was less than 0.1%. The airflow is solved in
steady state, although for the numerical validation there is a need to solve the time dependent release and transport of bioaerosols this is based on a steady state solution to the air flow.
2.3 Bioaerosol Transport
required in the modelling studies. Model 1 validates bioaerosol transport against experimental studies using a nebulizer designed to produce aerosols with a mass median diameter of 2.5µm and a geometric standard deviation of 1.8 [42]. In model 2, for the numerical validation and application, the simulations considered particles sized 5µm and 10µm to represent skin squame.
Passive Scalar Model
Since the injected mass median diameter in the experiments is 2.5µm and aerosols are likely to evaporate further it is reasonable to assume the particles will follow the behaviour of a passive scalar and can therefore be represented using the scalar transport equation:
0 grad div divt u , (1)
Here is the concentration of microorganisms per unit volume (quantity.m-3);uis the velocity vector (u,v,w) of the air (m.s-1); and is the diffusivity (kg.m-1.s-1). Natural decay of viable
microorganisms in the space is not considered in this case. The diffusivity of the bio-aerosols is set to 1x10⁻⁷kg.m-1.s-1to represent the low diffusion of particles.
Langrangian Particle Tracking Model
In order to study the transport and deposition of larger particles a Lagrangian model is adopted where the trajectory of a particle is found by considering the change in particle velocity (up) due
to the particles inertia, gravity, and drag forces
x p p x p D p F g u u F t u ) ( ) ( (2)
The first term on the right hand side FD(uup) is the drag force per unit particle mass.
u
is the velocity and FD is defined using the spherical drag law (equation (3)). The second term represents the gravitational force where g is the gravitational acceleration and is the density.Fxis used to incorporate additional forces and equals zero in this study. The subscripttermprefers to the particle and unsubscripted terms refer to the air.
Where is themolecular viscosity of the fluid, dpis the diameter of the particle, Re the Reynolds number and CDthe drag coefficient for spherical particles. A Discrete Random Walk
(DRW) model is used to account for the effect of turbulent dispersion on the particle trajectories. This includes the fluctuating component of the velocity due to turbulenceu’to provide the instantaneous fluid velocityuas shown in equation 5. The fluctuating component is assumed to be isotropic and to follow a Gaussian distribution. It can therefore be expressed based on the turbulent kinetic energy, k, and a random number,ζ as given in equation 6
' u u
u (5)
3 / 2 ' ' '
' u2 v2 w2 k
u (6)
2.4 Injection Definition
[image:10.595.67.515.457.739.2]For each of the three objectives outlined above it was necessary to consider different types of injection. These are summarised in Table 1 for scalar sources. For numerical validation two cases are considered. Case x-x spans the room in the x direction, and z-z in the z direction as detailed in the table. The transient source in these cases is defined as a small cube that moves through the space, and the zonal source encompasses the entire volume the transient source moves through.
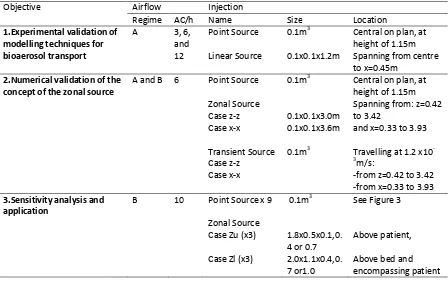
Table 1: Definition of airflow and geometry of bioaerosol sources for all models. In all cases a small momentum source is applied to expel the bioaerosols into the air
Objective Airflow Injection
Regime AC/h Name Size Location
1.Experimental validation of modelling techniques for bioaerosol transport
A 3, 6,
and 12 Point Source Linear Source 0.1m3 0.1x0.1x1.2m
Central on plan, at height of 1.15m Spanning from centre to x=0.45m
2.Numerical validation of the
concept of the zonal source A and B 6 Point Source
Zonal Source Case z-z Case x-x Transient Source Case z-z Case x-x 0.1m3 0.1x0.1x3.0m 0.1x0.1x3.6m 0.1m3
Central on plan, at height of 1.15m Spanning from: z=0.42 to 3.42
and x=0.33 to 3.93
Travelling at 1.2 x10 -3m/s:
-from z=0.42 to 3.42 -from x=0.33 to 3.93
3.Sensitivity analysis and
application B 10 Point Source x 9
Zonal Source Case Zu (x3)
Case Zl (x3)
0.1m3
1.8x0.5x0.1,0. 4 or 0.7 2.0x1.1x0.4,0. 7 or1.0
See Figure 3
Above patient,
Passive scalar models all assumed a constant release of 500cfu/s with a momentum source of 0.1N.m-3, over the source zone throughout the simulation. Transient simulations were run for
the entire time it took the source to traverse the space, 3600 and 2600 seconds for the x-x and z-z source respectively. The bioaerosol concentrations in the room were exported every 100 seconds to calculate the time averaged results at each cell for comparison to the steady state models.
The particle tracking used the same source definitions as given in Table 1 except sources are points, or lines, passing through the centre of the volumes for model 1 and 2. All sources released at least 6700 spherical particles for each size range, as a sensitivity study indicated this was adequate. An uncoupled solution for particle tracking was used. For the transient source 100 particles were injected per time step (1s during injection) and the total number injected then used for the equivalent zonal and point source. Tracking was run for a further 18000 seconds to ensure the majority of particles were removed from the air either by extraction or deposition. With the zonal and point source the solutions were run for 1.5x10⁵steps after
injection to ensure less than 10% particles remained suspended in the air.
For the experimental validation the particle sizes used were based on the manufacturers’ literature [42] for the Collison nebulizer as discussed in 2.3, with sizes between 0.78 and 9 µm, injected with a mass flow rate of 10-9kg/s and a density of 1000kg/s. For the later numerical
validation and application particles of 5 and 20 µm in diameter were defined.
Figure 3: Plan view of model 3 (isolation room), showing point source (A-I)and sampling locations (S1, S2, S3)
3. Results
3.1 Experimental Validation of CFD methodology
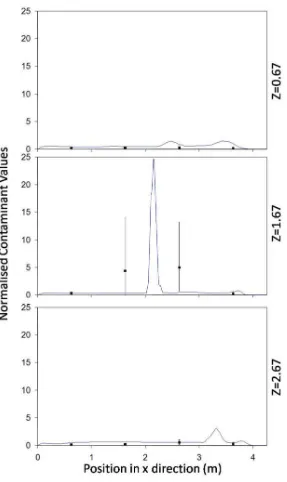
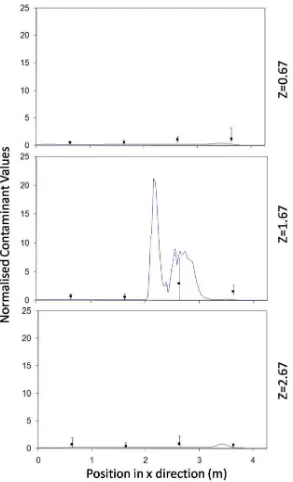
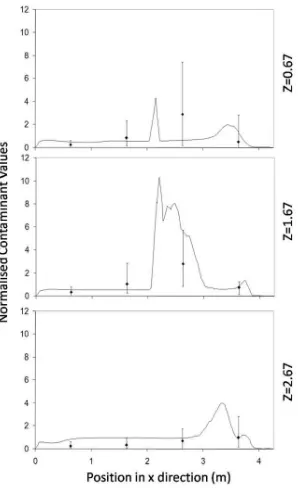
Figure 4: Normalised concentrations from the CFD simulations (lines) compared to experimental samples (points with error bars) along 3 separate lines passing through the test
Figure 5: Normalised concentrations from the CFD simulations (lines) compared to experimental samples (points with error bars) along 3 separate lines passing through the test
Figure 6: Normalised concentrations from the CFD simulations (lines) compared to experimental samples (points with error bars) along 3 separate lines passing through the test
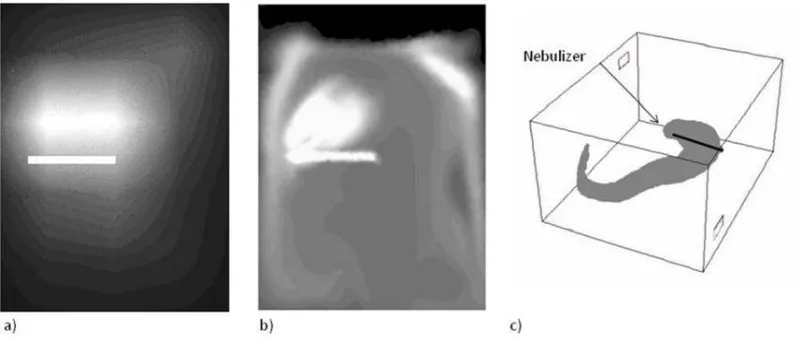
Figure 7: Contours of bioaerosols from the linear source. Values on plane y = 1.15m a) experimental results, b) CFD results. c) Plume showing 3D dispersal pattern from CFD results.
Orientation as plan view in Figure 1
The experimental deposition of microorganisms on the floor was calculated as a percentage of the total airborne count. This was quantified by extrapolating from the summation of all air samples. The airborne count was not calculated from the nebulizer concentration as the nebulising process can cause a significant loss of viability [41]. The deposited fraction was then found by averaging the number of colonies formed on each of the 24 plates, and multiplying up to assume the same deposition over the whole floor. In the CFD simulations the total number of particles depositing on the floor was found as a fraction of the injected quantity. Deposition values were found by a exporting data for the time and co-ordinates of particles “trapped” on the floor zone. Comparison between experimental and CFD depositions are shown in Table 2. Once the DRW model was incorporated the values of deposition were of the same order of magnitude as the experimental values.
Table 2: Deposited particle fractions found experimentally and using LPT based on bulk flow or incorporating the DRW model.
Experimental Bulk Flow DRW
3.2 Numerical Validation of the Zonal Source
As discussed in section 1 the zonal source seeks to represent the transient release of bacteria over the time and space in which the activity occurs, creating a zone with a consistent average bioaerosol release spread across it. The purpose of this source is to represent the average behaviour of a complex release from a source that moves through the space and hence is a replacement for a time dependant simulation of a transient source that moves through the zone. The numerical validation therefore compares the dispersion of bioaerosol from a zonal source in a steady state model with that from an injection of bacteria which moves through a zone. A point source simulation is also used for comparison
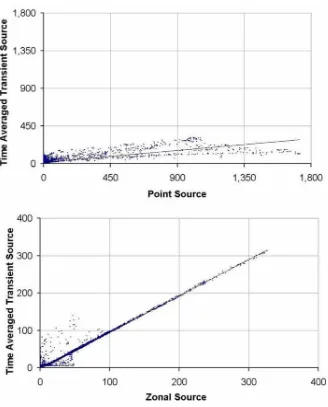
The transient source is compared to both the point and zonal source for the two airflow regimes at 6ac/h across two planes in Figures 8-11 with relevant correlation coefficients given in Table 3. Spearmanns Rho correlation was used as the data did not follow a Gaussian
[image:17.595.89.503.529.732.2]distribution. The results from the transient source were averaged over 2600 seconds based on results exported every 100 seconds. Correlations were then carried out using the values in comparable cells, based on over 10,000 cells. It is clear from the figure that the zonal source more accurately represents the transient source than a single point source. The point source heavily over estimates the concentrations in certain locations. More importantly on the sample plane at 1.60m the spread of values is much greater using the point source, whereas the zonal source much more accurately follows the time averaged results from the transient source (Figures 9 and 11).
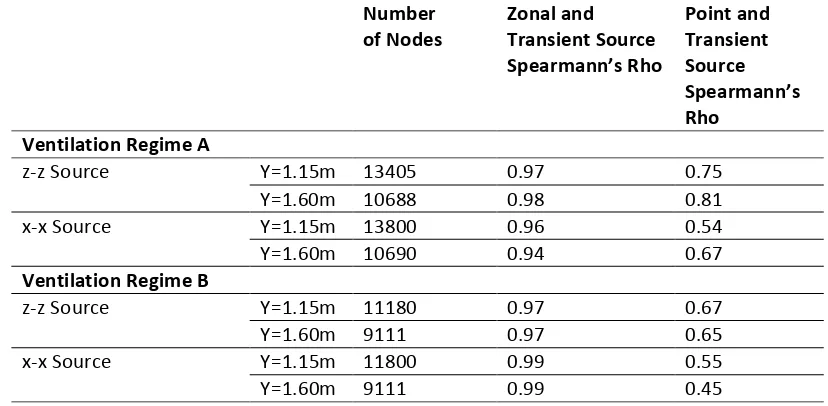
Table 3: Comparison of concentration contours between Transient source and Zonal or Point source models using Spearmann’s Rho correlation coefficients. The number of nodes used in the calculation is shown in the table, and all values are significant to < 0.05 level.
Number
of Nodes Zonal andTransient Source Spearmann’s Rho Point and Transient Source Spearmann’s Rho
Ventilation Regime A
z-z Source Y=1.15m 13405 0.97 0.75
Y=1.60m 10688 0.98 0.81
x-x Source Y=1.15m 13800 0.96 0.54
Y=1.60m 10690 0.94 0.67
Ventilation Regime B
Figure 9: Scatterplots showing comparisons between the time averaged dispersion from a transient source and a zonal or point source on the plane y=1.60m with source
Figure 11: Scatterplots showing comparisons between the time averaged dispersion from a transient source and a zonal or point source on the plane y=1.60m with source case z-z
Table 4: Particle Deposition as a percentage of injected for each source definition
Zonal Transient Point Regime A
Source x-x 54 54 56
Source z-z 70 69 71
Regime B
Source x-x 67 94 55
Source z-z 59 68 56
Figure 12 Deposition patterns across the chamber floor for (a) 5μm and (b) 10µm particles for (i) transient, (ii) Zonal and (iii) Point source respectively. Results shown for ventilation regime B
[image:22.595.114.467.254.603.2]3.3 Application and sensitivity of the zonal source
[image:23.595.153.447.262.431.2]In order to assess the sensitivity of the zonal source geometry and the point source location the scalar concentration at three points around the bed (Figure 3) was determined for each of the 15 sources. Figure 13 shows the concentrations at the three sample points and the variation between the point sources, and the zonal sources separately. It is clear that the risk at position S2 varied greatly depending on the source position, moving the source only 0.5m gives a very different concentration pattern as can be seen in Figure 14 with concentration changing from 96 to 24 cfu.m-3.
[image:23.595.103.487.532.684.2]For the particle tracking model Figure 15 shows the wide variation in the quantity of particles extracted from the space using a point source in comparison to the zonal source. The influence of source location appears to increase with particle size, with the 20m particles results
[image:24.595.134.440.244.422.2]showing a difference of nearly 80% depending on the location of the point source. However, the variation caused by changing the size of the zonal source is also over 20% for these larger particles which although less is still significant.
Figure 15: Average and range of particles extracted in three size ranges from the room using different point source locations, or zonal source dimensions.
4. Discussion
It is common practice to represent the source of bioaerosols in hospital ward models by a central point source at the head of the bed, however it should be recognised that significant hospital pathogens such as MRSA can colonise the skin and become dispersed into the air during regular nursing activities These releases of bacteria occur across large spatial areas and are subject to a significant amount of variation. Asingle transient simulation of such a release would only represent one possible scenario, whereas in reality there are infinite variations in the transient release due to the nature of the human behaviour. Therefore it is useful to be able to represent the average dispersion pattern of such releases and the above study has demonstrated how this type of dispersal may be approximated in a steady state CFD model The results presented suggest that a zonal source is likely to yield more realistic results than a point source for such releases, however it should be acknowledged that the findings are not based on an axhaustive study and the zonal source should be used with care. Some of theey
4.1 Experimental Validation of the CFD methodology
The experimental validations shown here are important as they present controlled
experimental conditions designed to directly mimic the CFD model incorporating bioaerosol transport, as opposed to validating simulated bioaerosol transport to tracer gases which is more common. They also consider the pattern of dispersal across the space, indicating areas of higher or lower risk, rather than a total or representative biological count in the room. Since the experiments were carried out using microorganisms there was a large amount of variation in sampled counts between locations. However despite this the simulations gave a reasonable representation of the results. The contour plots (Figure 7) show clearly the similarities between the model and the experimental results and in particular the tendency for the bioaerosols to be entrained towards the inlet air stream in both cases. The CFD simulation shows a ‘safe’ zone down the side of the room, with a much lower level of contamination than is shown in the experimental results. This is mainly due to the lower resolution in the experimental data where concentrations were not measured close to the wall.
Although the k-ε turbulence model is well validated for use to simulate bulk air flow, this is not the case for particle tracking simulation, and particularly deposition. In fact the assumption of isotropic turbulence has been found to overestimate the deposition of small particles <1µm in diameter [32], with results becoming more realistic as inertial forces dominate with large particles. There is a lack of literature presenting experimental data on the deposition of bioaerosols however there have been some attempts to validate the deposition of particles. Leduc and Fredriksson [43] replicated the deposition within a particle sampler and found the RNG turbulence model gave improved results for the deposition of particles <1µm. However in this study of a full scale room no significant difference was found for the deposition with the two different turbulence models for particles this size. Ruiet al[35] attempted to correlate the simulated deposition of bioaerosols to the transport of bacteria that occurred during a knee surgery. However the level of movement present in the real situation is attributed to lack of correlation between the two scenarios.
and particle tracking approaches within steady state CFD models may be used to understand the behaviour of bioaerosols. However to understand the effect of turbulence on smaller particles further work is required. The validation also does not consider the pattern of
deposition across the space which is important to understand where pathogenic particles may land and cause reservoirs of infection within a ward. However this study provides an important step in validating CFD models to the airborne dispersion and the total deposition of bioaerosols within a room.
4.2 Numerical validation of the zonal source
Although the increase in computing power has meant the impact of occupant movement on airflow is beginning to be incorporated within CFD models, it would be impossible to model all the variations in nurse, or patient movement and the resulting bacteria release. The zonal source is an attempt to respond to this situation by providing a way of representing an important source of bacteria in a hospital in a manner which represents the inherent
assumptions required when simulating such a scenario. It is clear from the numerical simulation described above that the average behaviour of the steady state zonal source correlates very well to the average behaviour of a transient source. Therefore this simple representation of the dispersal could provide valuable results to improve understanding of bioaerosol transport within hospitals. As well as taking significantly less time and effort to generate the simulation, the simple results from a steady state simulation convey the average behaviour of the scenario rather than presenting misleadingly complex results from a transient model of an uncertain situation. Although the point source showed a reasonable representation of the moving source in one of the air flow regimes the results exhibited more case dependence than the zonal source. Since it is not possible to know whether it would be representative without carrying out transient simulations for comparison it should be assumed that the point source will not be suitable for simulating the release of bacteria during activity that has a significant spatial component, as in certain air flow regimes it can give highly erroneous results. However, despite the clear improvement in correlation to the time averaged dispersal with the zonal source this validation only represents an initial test with a continuous release from a single point source traversing the space with a constant speed. The zonal source has not been compared to a point source with different velocities , directional changes, or one whose injection concentration varies in time. Equally, although the point source shows much greater case dependency this is based on only two airflow regimes. With other ventilation configurations such as local extract or displacement ventilation the results may differ.
4.3 Application and sensitivity of bioaerosol sources
particularly when there is less mixing, the location of the source can have a significant effect on the evaluated risk reduction. This is important because patients themselves move, as do
hospital beds. It is therefore quite feasible that the location of the bioaerosol source will move. Small movements of source location, particularly with strong directional airflows can have large effects on the risk to HCWs as shown in the sensitivity study. As such it is imperative to carry out sensitivity studies to understand how the risk evaluation changes with source location.
The geometry of the zone in which bacteria is released during activity will vary each time the activity is performed. For instance every time a bed is made the movements will vary to some extent. Therefore an exact zone can never be defined, and it is important to understand the implications that the assumption of zone size and shape will make. Considering Figure 13 and 15, the zonal source gives reasonably similar results for changes in volume over the top of the bed. However when the source is very thin there are very high concentration values near the bed and with the particle tracking model there is much greater deposition onto the bed. Since the turbulence model is known to overestimate the velocities perpendicular to the wall [32] it is not surprising that when all the particles are injected 2 or less cells away the rates of deposition are high. Care should therefore be taken to ensure the zonal source is thicker than the width of two cells.
The zonal source in the sensitivity study only considered activities occurring over the bed such as bedmaking which has long been recognised as dispersing large amounts of bacteria into the air [10]. Through observations on a four bed hospital bay the authors found that the highest levels of airborne bioaerosols corresponded to dealing physically with the patients which occurred behind curtains and either on, or next to the bed [45]. By using the zonal source in such situations it is possible to improve understanding of the risk of infectious particles
travelling to other patients’ areas and being deposited on other beds or side tables where they may be responsible for indirect contact transmission. This study has only assessed the
sensitivity of such a source for bedmaking, and hence use for other activities should be carried out with due consideration for the realism of the geometry and the sensitivity of the solution to variation in geometry.
attempted to replicate both the average and worse case scenario of HCWs movement within a steady state model of an operating theatre. He created zones with sources of momentum for the person moving through the space. Following this initial validation of time averaging to represent the dispersal of bacteria due to movement it would be beneficial to link this with the ideas laid out in Brohuset al.[49] to incorporate both the effects on bacterial dispersal and the resulting changes to the air flow from the nursing activities within a ward.
5. Conclusion
Both passive scalar transport and particle tracking models within a steady state CFD simulation have been shown to compare well to the overall pattern of airborne spatial distribution and total deposition of bioaerosols in a ventilated space. The experimental comparison is limited to the behaviour of small diameter (~2.5m) bioaerosols and loss of viability generates large variability in the experimental data. However, the results give increased confidence that both approaches are appropriate for representing the dispersion of airborne pathogens in indoor environments.
The zonal source has been shown to provide a good representation of the time averaged dispersion of a transient source using passive scalar transport and to be representative of total deposition and extraction of particles when using a particle tracking approach with a DRW model for the cases presented here. A point source was not a good representation of a transient source, except in specific flow patterns.
It is recommended that when using CFD to understand the effect of hospital ward design and ventilation methods the pathogen source should be carefully considered. If the space is not only for respiratory patients, it is necessary to consider the dispersal of bacteria from other sources including nursing activities. For this situation a zonal source encompassing the area of activity may give a better representation of the average risk. Even in situations where the space is being specifically designed for respiratory diseases, such as TB, it is necessary to consider the sensitivity of the source location especially when using directional ventilation systems.
Acknowledgements
References
[1] Centers for Disease Control and Prevention. Guidelines forPreventing the Transmission of Mycobacterium tuberculosis in Health-Care Settings, 2005. MMWR 2005;54(No. RR-17, 1-141)
[2] Williams REO. Epidemiology of Airborne Staphylococcal Infection. Bacteriol Rev 1966;30(3): 660-74.
[3] White A. Relation between Quantitative Nasal Cultures and Dissemination of Staphylococci. J Lab Clin Med 1961; 58(2): 273-7.
[4] Dietzer B, Rath A, Wendt C, Martiny H. Survival of MRSA on sterile goods packaging. J Hosp Infect 2001; 49(4): 225-61.
[5] Neely N, Maley MP. Survival of Enterococci and Staphylococci on Hospital Fabrics and Plastics. J Clin Microbiol 2000; 38(4): 724-6.
[6] Boswell TC, Fox PC. Reduction in MRSA environmental contamination with a portable HEPA-filtration unit. J Hosp Infect 2006; 63(1): 47-54
[7] Duguid JP, Wallace AT. Air Infection with Dust Liberated from Clothing. Lancet 1948; 252(6535): 845-49.
[8] Mackintosh CA, Lidwell OM, Towers AG, Marples RR. The dimensions of skin fragments dispersed into the air during activity. J Hyg-Cambridge 1978; 81: 471-9.
[9] Davies RR, Noble WC. Dispersal of Bacteria on Desquaminated Skin. Lancet 1962; 2(7269): 1295-7.
[10] Walter CW, Kundsin RB, Sholkret MA, Day MM. The Spread of Staphylococci to the Environment. Antibiot Annu 1958; 6: 952-7.
[11] Shiomori T, Miyamoto H, Makishima K, Yoshida M, Fujiyoshi T, Udaka T, et al.. Evaluation of bedmaking-related airborne and surface methicillin- resistant Staphylcoccus aureus
contamination. Journal Hosp Infect 2002; 50(1): 30-5.
[12] Noble WC, Davies RR. Studies on Dispersal of Staphylcocci. J ClinPathol 1965; 18(1): 16-9.
[13] Hambraeus A. Transfer of Staphylococcus aureus via nurses uniforms. J Hyg–Cambridge 1973; 71(4): 799-814.
[15] Li Y, Huang X, Yu ITS, Wong TW, Qian H. Role of air distribution in SARS transmission during the largest nosocomial outbreak in Hong Kong. Indoor Air 2005; 15(2): 83-95.
[16] Beggs CB, Kerr KG, Noakes CJ, Hathway EA, Sleigh PA. The ventilation of multiple-bed hospital wards: Review and analysis. Am J Infect Control 2008; 36(4) 250-9
[17] Chao CYH, Wan MP. A study of the dispersion of expiratory aerosols in unidirectional downward and ceiling-return type airflows using a multiphase approach. Indoor Air 2006; 16: 296-312
[18] Chow TT, Yang XY. Performance of ventilation system in non-standard operating room. Build Environ 2003; 38(12): 1401-11.
[19] Richmond Bryant Transport of exhaled particulate matter in airborne infection isolation rooms. Build Environ 2009; 44: 1 44-55
[20] Kao PH, Yang RJ. Virus diffusion in isolation rooms. J Hosp Infect 2006; 62(3): 338-45.
[21] Yu ITS, Li YG, Wong TW, Tam W, Chan AT, Lee JHWet al.Evidence of airborne transmission of the severe acute respiratory syndrome virus. New Engl J Med 2004; 350(17): 1731-9
[22] Noakes CJ, Sleigh PA, Fletcher LA, Beggs CB. Use of CFD modelling to optimise the design of upper-room UVGI disinfection systems for ventilated rooms. Indoor Built Environ 2006; 15(4), 347-56
[23] Chung K, Hsu S. Effect of ventilation pattern on room air and contaminant distribution. Building and Environment 2001; 36(9): 989-98.
[24] Huang JM, Chen QY, Robit B, Rivoalen H. Modelling contaminant exposure in a single-family house. Indoor Built Environ 2004; 13(1): 5-19.
[25] Khan JA, Feigley CE, Lee E, Ahmed MR, Tamanna S. Effects of inlet and exhaust locations and emitted gas density on indoor air contaminant concentrations. Build Environ 2006; 41(7): 851-63.
[26] Zhang Z, Chen X, Sagnik M, Zhang T, Chen O. Experimental and numerical investigation of airflow and contaminant transport in an airliner cabin mock-up. In. Proceedings of Roomvent, Helsinki, Finland; June 13-15 2007.
[28] Lu W, Howarth AT. Numerical analysis of indoor aerosol particle deposition and distribution in two-zone ventilation system. Build environ 1996; 31(1): 41-50.
[29] Zhang Z, Chen Q. Experimental measurements and numerical simulations of particle transport and distribution in ventilation rooms. Atmos Environ 2006; 40: 3396-408
[30] Zhao B, Yang C, Yang X, Liu S. Particle dispersion and deposition in ventilated rooms: testing and evaluation of different Eulerian and Lagrangian models. Build Environ2008; 43: 388-97
[31] Wan MP, Chao CYH, Ng YD, Sze To GN, Yu WC. Dispersion of expiratory droplets in a general hospital ward with ceiling mixing type mechanical ventilation system. Aerosol Sci Tech 2007; 41(3): 244-58.
[32]Lai ACK, Chen FZ. Modelling particle deposition and distribution in a chamber with a two-equation Reynolds-averaged Navier-Stokes model. J Aerosol Sci 2006; 37(12): 1770-80.
[33] Noakes CJ, Fletcher LA, Sleigh P, Booth W, Beato-Arribas B, Tomlinson N, Comparison of tracer techniques for evaluating the behaviour of bioaerosols in hospital isolation rooms in: Healthy Buildings 2009. Syracuse, New York, USA. September 13 to 17, 2009.
[34] Grinshpun SA, Adhikari A, Honda T, Kim KI, ToivolaM, Rao R, et al. Control of aerosol contaminants in indoor air: combining the particle concentration reduction with microbial inactivation. Environmental Science and Technology 2007; 41(2): 606-12
[35] Rui Z, Guangbei T, Jihong L. Study on biological contamination control strategies under different ventilation models in a hospital operating room. Build Environ 2008; 43(5): 793-803.
[36]Liu J, Wang H, Wen W. Numerical simulation on a horizontal airflow for airborne particles control in hospital operating room. Build Environ 2009; 44(11): 2284-9
[37] Shih YC, Chiu CC, Wang O. Dynamic airflow simulation within an isolation room. Build Environ 2007; 42(9): 3194-209.
[38] Rosebury T. Experimental Airborne Infection. Baltimore: Williams and Wilkins Company; 1947: 3033
[39] Macher JM. Positive-hole correction of multiple-jet impactors for collecting viable microorganisms. Am Ind Hyg Assoc J 1989; 50(11): 561-8.
[41] Noble WC, Lidwell OM, Kingston D. The size distribution of airborne particles carrying micro-organisms. J Hyg-Cambridge 1963; 61(4): 385-91
[42] BGI Collinson Nebulizer. Output Distribution of the Collison Nebulizer 2006. http://www.bgiusa.com/agc/output_distribution.htm (Accessed March 2011).
[43] Leduc S, Fredriksson C, Hermansson R. Particle tracking option in Fluent validated by simulation of a low pressure impactor. Adv Powder Technol 2006; 17(1): 99-111.
[44] Chau OKY, Liu CH, Leung MKH. CFD analysis of the performance of a local exhaust ventilation system in a hospital ward. Indoor Built Environ 2006; 15(3): 257-71.
[45] Hathway EA, Fletcher LA, Noakes CJ, Sleigh PA. Bioaerosol production from routine
activities within a hospital ward. Proceedings of the 11thInternational Conference on Indoor Air Quality and Climate: Indoor Air 2008. August 17-22; Copenhagen, Denmark.
[46] Tang JW, Eames I, Chan P, Ridgeway GL. Factors involved in the aerosol transmission of infection and control of ventilation in healthcare premises. J Hosp Infect 2006; 64(2): 100-14.
[47] Matsumoto H. Ohba Y. The influence of moving object on air distribution in displacement ventilated rooms. J Asian Archit Build Eng 2004; 3(1): 71-5.
[48] Bjorn E, Nielsen PV. Dispersal of exhaled air and personal exposure in displacement ventilated rooms. Indoor Air 2002; 12(3): 147-64.