Active travel intervention and physical activity behaviour: An
evaluation
Patricia Norwood
a,*, Barbara Eberth
a, Shelley Farrar
a, Jillian Anable
b, Anne Ludbrook
a aHealth Economics Research Unit, University of Aberdeen, Polwarth Building, Foresterhill, Aberdeen AB25 2ZD, United KingdombThe Centre for Transport Research, School of Geosciences, University of Aberdeen, St Mary’s, Elphinstone Road, Aberdeen AB24 3UF, United Kingdom
a r t i c l e i n f o
Article history:
Received 30 April 2013 Received in revised form 29 April 2014
Accepted 2 May 2014 Available online 4 May 2014
Keywords:
Scotland Physical activity Active travel Sample selection Difference-in-differences
a b s t r a c t
A physically active lifestyle is an important contributor to individual health and well-being. The evidence linking higher physical activity levels with better levels of morbidity and mortality is well understood. Despite this, physical inactivity remains a major global risk factor for mortality and, consequently, encouraging individuals to pursue physically active lifestyles has been an integral part of public health policy in many countries. Physical activity promotion and interventions are nowfirmly on national health policy agendas, including policies that promote active travel such as walking and cycling. This study evaluates one such active travel initiative, the Smarter Choices, Smarter Places programme in Scotland, intended to encourage uptake of walking, cycling and the use of public transport as more active forms of travel. House to house surveys were conducted before and after the programme intervention, in May/June 2009 and 2012 (12,411 surveys in 2009 and 9542 in 2012), for the evaluation of the pro-gramme. This paper analyses the physical activity data collected, focussing on what can be inferred from the initiative with regards to adult uptake of physical activity participation and whether, for those who participated in physical activity, the initiative impacted on meeting recommended physical activity guidelines. The results suggest that the initiative impacted positively on the likelihood of physical activity participation and meeting the recommended physical activity guidelines. Individuals in the intervention areas were on average 6% more likely to meet the physical activity guidelines compared to individuals in the non intervention areas. However, the absolute prevalence of physical activity participation declined in both intervention and control areas over time.
Our evaluation of this active transport initiative indicates that similar programmes may aid in contributing to achieving physical activity targets and adds to the international evidence base on the benefits of active travel interventions.
Ó2014 The Authors. Published by Elsevier Ltd. This is an open access article under the CC BY-NC-SA license (http://creativecommons.org/licenses/by-nc-sa/3.0/).
1. Introduction
Interventions to encourage reduced car use and substitute active travel alternatives are motivated by concerns to improve health, primarily through increased physical activity in the form of walking and cycling, and to improve the environment, both locally and globally (de Nazelle et al., 2011). There have been a number of evaluations which attempt to analyse the link between such in-terventions and levels of physical activity associated with walking and cycling. Greenberg et al. (2005)investigated the impact of a new transit train station on American commuters walking behav-iours, with one-third of those surveyed reporting additional
physical activity mainly due to an overall increase in walking ac-tivity. In a related studyBesser and Dannenberg (2005)investigated daily time spent walking to and from public transport in relation to recommended physical activity guidelines and found that about 30% of their sample population met the daily recommended physical activity guideline purely from transit related walking.Yang et al. (2012) analysed the association between active travel and physical activity in the Commuting and Health in Cambridge study and concluded that active travel was associated with increased physical activity in women but there was no association for men. In an international cross-sectional comparison study,Pucher et al. (2010) investigated the relationship between active travel and physical activity, obesity, and diabetes prevalence and found
sig-nificant population health gains associated with active travel
behaviour. The correlation between active travel and physical ac-tivity was significantly positive whilst significantly negative *Corresponding author.
E-mail address:[email protected](P. Norwood).
Contents lists available atScienceDirect
Social Science & Medicine
j o u r n a l h o m e p a g e : w w w . e l s e v i e r . c o m / l o c a t e / s o c s c i m e d
http://dx.doi.org/10.1016/j.socscimed.2014.05.003
correlations were found between active travel and obesity, and active travel and diabetes. In a systematic review assessing the ef-fects of interventions to promote walking, Ogilvie et al. (2007) found that the most successful interventions could increase walking among targeted participants by up to 30e60 min a week, on average. In a similar systematic review focused on interventions to promote cycling,Yang et al. (2010)found only two studies which assessed the effects of interventions on physical activity and it was thus unclear whether this type of intervention resulted in an in-crease in overall physical activity. A recent systematic review by Wanner et al. (2012)found some evidence that active transport is associated with greater self-reported total physical activity.
For overall physical activity health gains to be fully realised, it is not sufficient for there to be an increase in active travel; it must also be accompanied by an increase in physical activity by individuals who do not currently meet physical activity guidelines, as it is possible that an increase in active travel might be compensated for by a decrease in activity in other domains. Although most evalua-tions in the literature have tended to isolate the increases in walking or cycling activity associated with an intervention and have largely failed to measure whether this leads to a compen-sating reduction in other physical activities,Sahlqvist et al. (2013), in a longitudinal study, found that increases in active travel were associated with a commensurate increase in total physical activity and not a decrease in recreational physical activity.
It should be noted that there is some evidence of health gain associated with active travel independent of overall physical ac-tivity.Hamer and Chida’s (2008) meta-analysis demonstrated an association between active travel and reduced cardiovascular risk, suggesting independent effects of commuting activity, with different types of activity potentially providing additive benefits.
Physical activity does not need to be strenuous to have signifi -cant effects on people’s health, general wellbeing and productivity. Evidence shows that active people have longer lives, lower risk of developing diseases, greater wellbeing, fewer symptoms of depression, lower rates of smoking and substance misuse and the
ability to function better at work and home (World Health
Organisation e WHO, 2010; Wen and Wu, 2012). Physical inac-tivity remains one of the major global risk factors for mortality (WHO, 2007, 2009) even though the evidence linking higher physical activity levels with better levels of morbidity and mortality is well-documented (Andersen et al., 2000; WHO, 2005). The World Health Organisation (WHO) recommends adults to accumulate at least 30 min of moderate activity (the equivalent of brisk walking) on most days of the week for health gains to be realised and that physical activity promotion and interventions should be an integral part of national health policy emphasising, amongst others, policies
that promote active travel such as walking and cycling (WHO,
2004).
The Scottish Government in line with other European countries has adopted the WHO recommendation on physical activity (Physical Activity Task Force, 2003; The Scottish Government, 2008,
2010), supporting policies making physical environments more
amenable to physical activity in everyday activities as part of the Scottish physical activity strategy with the objective“to develop and maintain long lasting, high-quality physical environments to
support inactive people to become more active”. Ring-fenced
funding in the Public Transport Fund supports initiatives encour-aging individuals to walk and cycle (Physical Activity Task Force, 2003, p. 23).
One such initiative is the Scottish Government Smarter Choices, Smarter Places programme (SCSP), a pilot initiative across Scotland between 2009 and 2012 to encourage uptake of walking, cycling and the use of public transport as a more active form of travel alternative to car use. Funds were directed at seven pilot areas
across Scotland which were selected for funding on the basis of their individual plans to encourage local individuals to adopt travel patterns aiming to save them money, help to make them healthier, reduce transport emissions and develop more cohesive commu-nities. To achieve these goals, local authorities covering the participating towns delivered complex programmes to organise, enable, promote and provide sustainable transport solutions. A more detailed table describing the intervention package can be found in anAnnex online.
The latest results from the Scottish Health Survey show that
between 2008 and 2011 there was no significant change in the
proportion of adults meeting the recommendations (The Scottish
Government, 2011). In 2008, 39% of Scottish adults aged 16 and over met the physical activity guidelines, 30% did not meet the guidelines but engaged in some physical activity (30 min or more on 1e4 days a week) and 31% had been inactive (fewer than 30 min of moderate activity a week); by 2011 those percentages were, respectively, 39%, 29% and 32%. Scotland therefore has some way to go to meet its long term target for 50% of the adult population to meet the recommended guidelines by 2022.
This paper analyses the physical activity data collected for the evaluation of the SCSP programme. In particular, we focus on what can be inferred with regards to (i) adult uptake of physical activity participation and (ii) conditional on participation, the effect on adults meeting the physical activity guidelines. From a policy perspective, the results are important since they will indicate whether this type of intervention was successful in achieving one of its intended aims. Evaluation of this initiative will therefore indi-cate whether similar programmes will aid in contributing to achieving physical activity targets and will contribute to the
in-ternational evidence base on the benefits of active travel
interventions.
2. Methods and data
2.1. The SCSP programme
As is often the case with public policy changes, the SCSP was not implemented as a controlled experiment (Blundell and Costa Dias, 2000). The challenge for the evaluation was to measure the impact on changes in individual behaviour without being able to observe what would have happened without the programme.
together acted as a control for the 7 intervention areas taken together but were more problematic when attempting to produce synthetic controls for individual intervention areas. However, our analysis relies only on the combined data.
House to house surveys were conducted before and after the programme intervention, in May/June 2009 and 2012 (12,411 sur-veys in 2009 and 9542 in 2012). One adult per household (chosen from a random sample of households from a list of postcode areas) took part in the survey, selected using“next birthday”. The College of Physical Sciences (COPS) of the University of Aberdeen has an established ethic approvals procedure and in accordance with it the appropriate ethics approval form was completed. The COPS Com-mittee signed off the application, as it was considered that there was nothing sensitive in the proposed research.
The sample represented between 8 and 10% of the total
popu-lation aged 16þin the areas. The response rates, based on the
number of usable surveys (100% complete) were 14% for the SCSP areas in both years and 15% in 2009 and 14% in 2012 in the control areas.
In 2009, the surveys were administered using a questionnaire which was left at each household allowing for self-completion by respondents with additional assistance and support provided by surveyors on collection of completed forms. In 2012 a computer assisted survey approach (CAPI) was adopted, allowing surveyors greater control over the survey responses and delivering a better response rate than in 2009. However, as physical activity can be considered to be a socially desirable behaviour, it may have a ten-dency to be over-reported by respondents in surveys (Motl et al., 2005). Whilst physical activity is commonly measured using self-reported survey instruments, this change in methodology has the potential to exacerbate any social desirability bias due to the additional face to face contact between researcher and respondent in the after survey. However, we also note that a previous review of the effect of different types of physical activity survey measure-ments on social desirability concluded that the less structured the survey (i.e. the less detailed the questions on physical activity), the lower the social desirability effect (Adams et al., 2005). In the SCSP surveys, respondents were asked to simply record a number of days per week on which they undertook a certain level of exercise. It is also worth noting that the level of physical activity reported in the second survey was lower, which may suggest that any effect of the change in survey mode was small. In terms of the difference-in-difference analysis, the survey mode would only introduce bias into the results if the effect differed between the control and intervention samples and this seems unlikely.
The survey data provided the opportunity to construct a quasi
natural experiment using ‘difference-in-differences’ (DID)
methods. DID uses the before and after intervention differences in both intervention and control areas and the difference between these two differences, to assess the average effect of the interven-tion. This allows the time trend in both areas to be eliminated (Qin and Zhang, 2008). DID provides a robust test of whether the introduction of SCSP is associated with changes in physical activity levels and whether these are statistically significant.
The DID approach is useful in the context of this evaluation because the collection of the sample data could not control for all of the variables affecting physical activity decisions. We can account for some of the differences between the SCSP and control samples by controlling for demographic, socio-economic and health related factors. However, estimating the impact of the programme as the difference between these two differences (SCSP versus control areas) rests on the assumption that the areas are subject to the same changes over time apart from the programme introduction, that is, that“common time effects exist across groups”(Blundell and Costa Dias, 2000).
2.2. Data
In addition to providing details of their travel and social de-mographic data, respondents were asked to record how many days per week (outside of work) they typically undertook at least 30 min of moderate intensity exercise including walking and cycling. This definition was adopted because the amount of physical activity at work would be determined by job type rather than individual behaviour and is unlikely to be affected by the introduction of SCSP.
Wording from the Scottish Health Survey questionnaire (2008e
2011) was used to explain that this activity did not need to be undertaken all in one go. The specific question was:
“Thinking about what you do outside work, school or college,
how many days per week would you say that you typically do at least 30 min moderate exercise?This does not have to be all in one go but can be across more than one session in a day. Examples of moderate exercise include fairly brisk walking, cycling, heavy housework or DIY, swimming, use of a gym, aerobics/keepfit/gymnastics, active sports such as football, rugby, tennis, badminton, and squash”.
Respondents had four possible answers:“Every day”;“5e6 days per week”;“1e4 days per week”and“No days”. From the responses an indicator variable was derived,“meeting recommendations”, taking a value of one if respondents reported physical activity of at least moderate intensity for at least 30 min on 5 or more days per week; zero otherwise. Based on the same survey question, a second variable was derived,“decision to do any exercise”which distin-guishes those who are physically active (¼1) from those who are inactive (¼0). Similar single item questions have been used in other evaluation studies, for example,Van Stralen et al. (2009), based on the self-administered Dutch Short Questionnaire to Assess Health Enhancing Physical Activity (SQUASH): On how many days per week are you, in total, moderately physically active, by undertaking, for example, heavy walking, cycling, chores, gardening, sports, or other physical activities for at least 30 min? A recent paper has addressed the criterion validity of the single item question against accelerometry and concludes that it is valid for determining whether respondents are sufficiently active to benefit their health (Milton et al., 2013).
The surveys also included questions on household composition, access to car, respondent socio-demographic characteristics and health and disability.
2.3. Modelling the probability of meeting the physical activity recommendation
To assess the impact of the intervention on the likelihood of adults taking up physical activity and, conditional on participation, on adults meeting the Scottish physical activity guidelines, we estimate a probit regression model with sample selection (Van de Ven and Van Praag, 1981). Assume the existence of a latent binary variabley*1indicating whether an individual meets the physical activity guidelines which is expressed as a function of the determinants of meeting the physical activity guidelines and an error term accounting for unobserved factors that impact meeting the recommendation:
y*1 ¼ x1
b
01þu1In the data, however, we only observe the binary outcome, meeting the recommendation, ify1*>0:
y1 ¼ (
1 if y*1>0 0 if y*10
At the same time we also need to consider that y1 is only
there exists a latent variabley*2indicating participation in physical activity which is a function of the determinants of physical activity participation such that
y*2 ¼ x2
b
02þu2Again, we only observe the selection outcome ify2*>0;
y2 ¼
(
1 ify*2>0 0 if y*20
In this model the error terms in the two equations are jointly normally distributed with correlation coefficient
r
:
u1
u2
wN
0 0
;
1
r
r
1
Correlation of the error terms,
r
s0, means that the probability of meeting the physical activity guidelines will depend on the probability of physical activity participation. If not accounted for, this will result in biased estimates of the outcome of interest,y2. In this case,y1andy2should be estimated jointly. If on the other hand the two error terms are uncorrelated,r
¼0, the two equations can be estimated independently.To test the independence assumption we compute a Wald test, distributed
c
2 with one degree of freedom, testing the null hy-pothesis thatr
¼0. Rejection of the null hypothesis implies that the two variables need to be estimated jointly.For identification of the model parameters, we impose
exclusion restrictions in the ‘meeting the recommendation’
equation. Measures of individuals’ self-reported general health and disability status are included in the‘participation’equation
but excluded from the‘meeting the recommendation’equation.
Health reasons have been found to be a major barrier to physical activity participation and for individuals who do not suffer from ill health a motivator for physical activity participation to keep
physically fit and healthy (The Scottish Executive Education
Department, 2006). We expect physical activity participation to decline with worsening general health status and also to be lower for the disabled. Whilst there are reasons to believe that good general health may also impact on the amount and in-tensity with which physical activity is undertaken, the general
health measures are excluded from the ‘meeting
recommenda-tion’equation given that it focuses on a very specific definition of physical activity and that we judge health more important in determining participation.
To assess the impact of SCSP on the likelihood of participation and meeting the recommendation, an interaction term is included measuring the difference-in-difference effect of the intervention. This is a simple interaction term of the area and year and indicates the differential effect of the introduction of SCSP; it measures the change in the probability of participation and, conditional on participation, the probability of meeting the recommendation in the intervention areas relative to the areas not exposed to the intervention. Additionally the year and area indicator are also controlled for in the model. The‘area’variable shows the effect of living in an intervention area rather than a control area on the propensity to participate and meeting the physical activity recommendation. The‘year’variable shows the overall change in the response probabilities over time. To capture unobservable effects that are common within but not between
areas (e.g. different economic/social tendencies), we use
dummies to control for areafixed-effects in the analysis (Ahlfeldt and Kavetsos, 2014).
3. Results
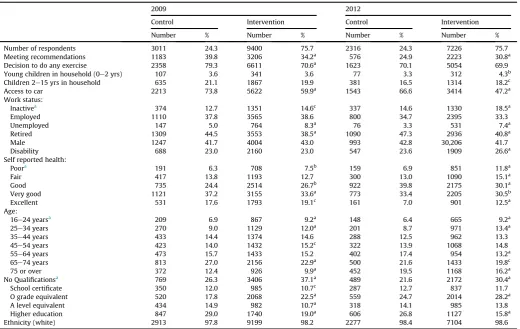
Table 1provides the descriptive statistics from the survey data for the control and intervention areas in the two years under consideration. For each yeart-tests were estimated on the equality of means between control and intervention areas.
The proportion of individuals meeting the physical activity recommendations was significantly different (p<0.01) between the control and intervention areas in both 2009 and 2012. Both areas experienced a decline. This was larger in the control (from 39.8% to 24.9%) relative to the intervention areas (34.2%e30.8%). A similar pattern emerges with respect to individuals who exercise regardless of physical activity frequency and intensity, although the difference in the proportion of individuals participating in physical activity between the control and intervention areas was only sta-tistically significant (p<0.01) in 2009.
In line with other studies that investigated the determinants of physical activity participation and time spent on physical activity (Farrell and Shields, 2002; Downward, 2007; Eberth and Smith, 2010; Brown and Roberts, 2011; Downward et al., 2001; Humphreys and Ruseski, 2011; Kokolakakis et al., 2011) the model controls for the covariates inTable 2. A priori, we expect the like-lihood of physical activity participation and meeting the recom-mendation conditional on participation to decline with increasing age. We also expect men to be more likely to participate relative to women and, conditional on participation, to be more likely to meet the recommendation. The presence of infants (children younger than two) is expected to impact negatively on the likelihood of participation and meeting the recommended guidelines due to the time commitments caring for infants whilst, a priori, the direction of the effect is unclear for older children.
The car indicator proxies accessibility constraints to physical activity, and as such is expected to increase the likelihood of physical activity participation (this might be most relevant in terms of sports participation). However, there is also evidence to support the hypothesis that individuals who do not own a car are more physically active as they have to participate in active travel (Lucas and Jones, 2009; Anable et al., 2010; Olabarria et al., 2012).
Education is thought to proxy an individual’s knowledge
the analysis resulting in a negative bias in the likelihood of participation. However, educational status is also highly correlated with an individual’s income position and we therefore expect ed-ucation to at least partially pick up the effect of income on the likelihood of participation in physical activity. Again, the main findings would only be affected if the trends in income over time differed between the intervention and control samples.
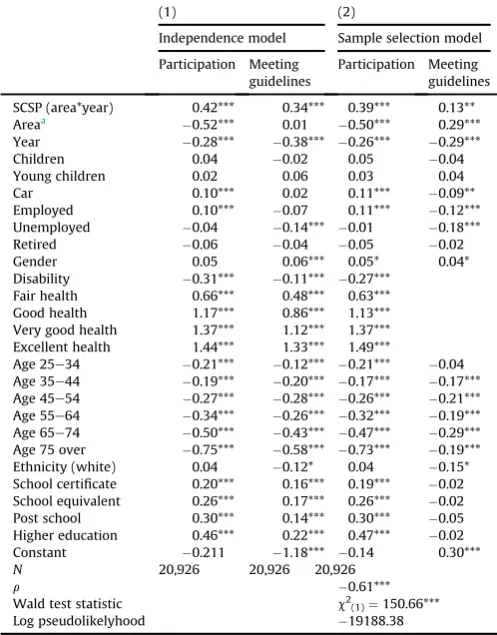
Table 2presents the regression coefficients estimated from the independent probit models and the probit model with sample selection.
The Wald test rejects the independence assumption and
con-firms that the two variables should be estimated jointly. The
negative correlation coefficient between the error terms for the two equations (
r
) indicates that those who participate in sports are not very likely to meet the recommended physical activity guidelines; most are participating at levels short of the 30 min of at least moderate intensity onfive days per week.Due to the rejection of the independence model, this section focuses on the sample selection model results. Positive coefficients are interpreted as increasing the likelihood of participating in physical activity and, conditional on participation, meeting the recommended physical activity guidelines whereas the reverse holds for negative coefficients.
The key variable of interest for the overall evaluation of the intervention is the‘SCSP’variable, an interaction term measuring the difference-in-difference effect of the intervention. The esti-mated coefficient reveals that the likelihood of physical activity participation is significantly higher in the intervention areas
relative to the control areas, and conditional on physical activity participation, significantly increases the likelihood of meeting the physical activity guidelines in the intervention areas relative to the control areas.
It is also useful to assess the biases generated in the results on the‘SCSP’variable across the independent and sample selection models. For the likelihood of meeting the recommended guide-lines, comparison of the estimated coefficients reveals a positive bias on the‘SCSP’variable; an overestimation of the intervention effect when not controlling for selection.
We can also look at the separate effects of the area and year indicators. Individuals in the intervention areas were significantly less likely to participate in physical activity relative to the control areas but, conditional on participation, significantly more likely to meet the recommended physical activity level. The coefficient on the year dummy indicates that, over time, individuals in both the intervention and control areas were less likely to participate in physical activity. Conditional on participation, individuals were also less likely to meet the recommendation in 2012 relative to those who participated in 2009.
The other covariates controlled for in the model reveal that men are more likely to participate in physical activity and, conditional on participation, more likely to meet the recommended guidelines. Children in the household had no significant effect.
[image:5.595.35.556.83.412.2]Individuals are significantly more likely to participate if they own a car and are in employment. The likelihood of participation is further significantly increased with increasing general health and educational attainment. As expected, individuals are significantly Table 1
Descriptive statistics: number and percentage of individuals in each area by year.
2009 2012
Control Intervention Control Intervention
Number % Number % Number % Number %
Number of respondents 3011 24.3 9400 75.7 2316 24.3 7226 75.7 Meeting recommendations 1183 39.8 3206 34.2a 576 24.9 2223 30.8a
Decision to do any exercise 2358 79.3 6611 70.6a 1623 70.1 5054 69.9
Young children in household (0e2 yrs) 107 3.6 341 3.6 77 3.3 312 4.3b
Children 2e15 yrs in household 635 21.1 1867 19.9 381 16.5 1314 18.2c
Access to car 2213 73.8 5622 59.9a 1543 66.6 3414 47.2a
Work status:
Inactivea 374 12.7 1351 14.6c 337 14.6 1330 18.5a
Employed 1110 37.8 3565 38.6 800 34.7 2395 33.3
Unemployed 147 5.0 764 8.3a 76 3.3 531 7.4a
Retired 1309 44.5 3553 38.5a 1090 47.3 2936 40.8a
Male 1247 41.7 4004 43.0 993 42.8 30,206 41.7
Disability 688 23.0 2160 23.0 547 23.6 1909 26.6a
Self reported health:
Poora 191 6.3 708 7.5b 159 6.9 851 11.8a
Fair 417 13.8 1193 12.7 300 13.0 1090 15.1a
Good 735 24.4 2514 26.7b 922 39.8 2175 30.1a
Very good 1121 37.2 3155 33.6a 773 33.4 2205 30.5b
Excellent 531 17.6 1793 19.1c 161 7.0 901 12.5a
Age:
16e24 yearsa 209 6.9 867 9.2a 148 6.4 665 9.2a
25e34 years 270 9.0 1129 12.0a 201 8.7 971 13.4a
35e44 years 433 14.4 1374 14.6 288 12.5 962 13.3
45e54 years 423 14.0 1432 15.2c 322 13.9 1068 14.8
55e64 years 473 15.7 1433 15.2 402 17.4 954 13.2a
65e74 years 813 27.0 2156 22.9a 500 21.6 1433 19.8c
75 or over 372 12.4 926 9.9a 452 19.5 1168 16.2a
No Qualificationsa 769 26.3 3406 37.1a 489 21.6 2172 30.4a
School certificate 350 12.0 985 10.7c 287 12.7 837 11.7
O grade equivalent 520 17.8 2068 22.5a 559 24.7 2014 28.2a
A level equivalent 434 14.9 982 10.7a 318 14.1 985 13.8
Higher education 847 29.0 1740 19.0a 606 26.8 1127 15.8a
Ethnicity (white) 2913 97.8 9199 98.2 2277 98.4 7104 98.6 Note:t-Student tests witha¼significant at 1%;b¼significant at 5% andc¼significant at 10%.
less likely to participate with increasing age and if they suffer from a disability.
Conditional on participation, individuals are significantly less likely to meet the recommended level of physical activity if they own a car and are in employment or are unemployed, compared to the economically inactive. Note that 66% of the inactive are either at home (44%) or in education (22%) and only 34% are inactive due to illness. Education level has no significant effect. Relative to those aged 16 to 24, all other age groups, with the exception of the 25e34 year olds, are significantly less likely to meet the recommendation. Note however, that this is most pronounced for those aged 45 to 54 and those age 65 to 74.
3.1. Predicted probabilities
To get a better idea of the overall magnitude of the intervention effect, we used the regression output to estimate the predicted probability for‘SCSP’of meeting the guidelines for an individual with average sample characteristics. This was not significantly different between intervention and control areas in 2009 but in 2012 the difference was significant. Individuals with average sam-ple characteristics in the intervention areas were 6% more likely to meet the recommended physical activity guidelines relative to those in the control areas.
Fig. 1shows predicted probabilities of meeting the recommen-dations by education status for the control and intervention areas in 2009 and 2012. For individuals with no qualifications or the equivalent of an O-level qualification, there was no significant
difference in terms of the probability of meeting the recommended levels of physical activity in 2009. In 2012, the difference was sig-nificant, with the predicted probabilities of meeting the recom-mendations higher within the intervention areas; a 16% higher probability for individuals with no qualifications and 12% for in-dividuals with O level equivalents. In 2009 inin-dividuals in the intervention areas with a school certificate were significantly less likely (9%) to meet the recommended levels of physical activity than those in the control areas. After the SCSP programme was introduced, the probability of meeting recommendation washigher
in the intervention area but the difference was not statistically significant. Such changes were not observed in the higher educa-tion categories. Together the changes suggest that the SCSP pro-gramme had more impact on the likelihood of meeting the recommendations for individuals with lower or no educational
qualifications relative to those with post school and higher
education.
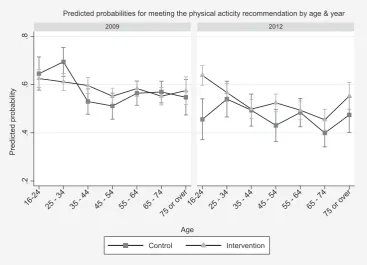
Similarly for age, estimated predicted probabilities (Fig. 2) in the intervention and control areas over time show that individuals in
the younger (16e34) and older (65 and over) age groups in the
intervention areas have seen their average probability of meeting the guidelines increase over time in comparison with the control
areas whilst those in the 35e44 and 55e64 age ranges in the
intervention areas are less likely or have no significantly different likelihood of meeting the recommended guidelines over time.
4. Discussion
Overall, the results show a positive association between the
SCSP programmes and individuals’ probability of meeting the
physical activity recommendations. Even though the probability of participating in physical activity and meeting the targets reduced over time in both the intervention and control areas, the reduction was less in the intervention relative to the control areas. The evaluation demonstrates the strengths of the DID methodology in controlling for multiple confounding factors when dealing with samples that are neither random nor completely representative. The use of predicted probabilities from the probit to identify im-pacts on particular subgroups is another useful feature of the evaluation for policy makers.
There are, of course, some limitations to our study. The associ-ation between meeting the physical activity recommendassoci-ation and the intervention cannot be interpreted as a causal relationship. In order to be confident in the results, it is important that the trends in the intervention and control areas would have been the same without the SCSP. The quasi natural experimental approach cannot entirely control for the multiple influences on physical activity behaviour, over a three year evaluation period, for towns spread across Scotland, facing potentially different economic and social change. There may be changes in the differences between the intervention and control areas which we are not able to observe and therefore could not control for in our models. If these changes coincide with SCSP funding we cannot differentiate between their impact and that of the SCSP intervention. For example, the building of sports/gym facilities or other physical activity-based initiatives outside of the SCSP programme or the relocation or closure of important trip generators such as employment sites or retail outlets.
[image:6.595.42.291.86.404.2]In addition, local authorities were selected for SCSP funding on a number of criteria, one of which was a track record of delivering on similar projects. Therefore it is possible that local authorities receiving SCSP funding were on a different trajectory. If so, the ef-fect could either be positive, in the sense that they were building on previous success, or negative, if the marginal gains to be made in active travel were small. A different issue with respect to isolating Table 2
Regression results.
(1) (2)
Independence model Sample selection model Participation Meeting
guidelines
Participation Meeting guidelines SCSP (area*year) 0.42*** 0.34*** 0.39*** 0.13** Areaa 0.52*** 0.01 0.50*** 0.29***
Year 0.28*** 0.38*** 0.26*** 0.29*** Children 0.04 0.02 0.05 0.04 Young children 0.02 0.06 0.03 0.04 Car 0.10*** 0.02 0.11*** 0.09** Employed 0.10*** 0.07 0.11*** 0.12*** Unemployed 0.04 0.14*** 0.01 0.18*** Retired 0.06 0.04 0.05 0.02 Gender 0.05 0.06*** 0.05* 0.04* Disability 0.31*** 0.11*** 0.27***
Fair health 0.66*** 0.48*** 0.63*** Good health 1.17*** 0.86*** 1.13*** Very good health 1.37*** 1.12*** 1.37*** Excellent health 1.44*** 1.33*** 1.49***
Age 25e34 0.21*** 0.12*** 0.21*** 0.04 Age 35e44 0.19*** 0.20*** 0.17*** 0.17*** Age 45e54 0.27*** 0.28*** 0.26*** 0.21*** Age 55e64 0.34*** 0.26*** 0.32*** 0.19*** Age 65e74 0.50*** 0.43*** 0.47*** 0.29*** Age 75 over 0.75*** 0.58*** 0.73*** 0.19*** Ethnicity (white) 0.04 0.12* 0.04 0.15* School certificate 0.20*** 0.16*** 0.19*** 0.02 School equivalent 0.26*** 0.17*** 0.26*** 0.02 Post school 0.30*** 0.14*** 0.30*** 0.05 Higher education 0.46*** 0.22*** 0.47*** 0.02 Constant 0.211 1.18*** 0.14 0.30***
N 20,926 20,926 20,926
r 0.61***
Wald test statistic c2
(1)¼150.66***
Log pseudolikelyhood 19188.38 *** significant at 1% ** significant at 5% * significant at 10%. Location dummies were included in the estimation of the models.
the effect of the programme is that areas which did not receive SCSP funding may have themselves introduced active travel ini-tiatives during the study period. This could potentially reduce the differences between the intervention and selected control areas, or national controls, thereby leading to an underestimation of the impact of the active travel initiatives.
[image:7.595.110.477.66.336.2]The controls were chosen from areas which had not applied for SCSP funding. Whereas local authorities that submitted unsuc-cessful bids for funding may have implemented initiatives developed through these proposals, even in the absence of dedi-cated support from Scottish Government, there is no information relating to the reasons why some local authorities did not bid for Fig. 1.Predicted probabilities for meeting the physical activity recommendation by education & year.
[image:7.595.109.477.460.725.2]funding. Whilst we cannot assume that the control areas selected would not implement any active travel initiatives, this group were considered to be the more suitable choice. If, however, the control areas were uninterested in active travel, then the effect of the SCSP programme could be overestimated. Ideally, two control groups might have been constructed, those that were unsuc-cessful and those that did not apply, but this was beyond the scope of the evaluation.
If other active travel initiatives are being implemented outside of the SCSP areas, then the evaluation becomes more focussed on the impact of the additional funding and the additional initiatives associated with the SCSP. However, it is also possible that the SCSP programme substituted for investment which might have other-wise been provided through other programmes funded by Scottish Government to support investment by local authorities in active travel and streetscape improvements.
On a short three year evaluation there is insufficient time to investigate how the impact of the policy might decay or build up over time. There are a variety of reasons why it may take time for the impacts of travel-behaviour interventions to materialise including: learning by policy makers; the development of better methods which increase the effectiveness of soft measures over time; the tendency for investment in infrastructure (such as pedestrian improvements) to be completed later in an intervention programme; and the time taken to change social and behavioural norms (Cairns et al., 2004). It is, therefore, possible that the total
programme benefit may be underestimated. On the other hand, it
cannot be assumed that the benefits we observe during the lifetime of the intervention will be extended into future years if the behaviour changes are not maintained and reinforced. There is a general concern that behavioural effects often decay over time so that there may be virtually no continuation of the behaviour change after a few years (Cobiac et al., 2009). The empirical evidence on the magnitude of these build up and decay effects is limited and there is no reported standard trajectory of behaviour change and associated impacts that can be applied to an evaluation of active travel or physical activity interventions. Nevertheless, the potential for the impacts to be over or underestimated highlights the importance of understanding context when evaluating such initiatives. The
ben-efits observed may depend upon whether other complementary
initiatives are being introduced, over what timescale and the level of latent physical activity which can be inspired at each point in the programme.
Finally, we were limited in the amount of physical activity data that could be collected in the survey, which covered all aspects of active travel, and in the quality of the data collected on income. The frequency of physical activity in days, conditional on being physically active for at least 30 min of at least moderate intensity,
was sufficient for evaluating whether the introduction of the
intervention brought about a change in the propensity to meet physical activity guidelines. However, future intervention studies of this type would be more informative if they collect physical activity data in terms of duration, frequency and intensity, pref-erably on a longitudinal basis. This would allow an assessment of physical activity gains in the group of individuals who are physi-cally active but do not meet the recommended guidelines. Lon-gitudinal data would allow an assessment of whether those meeting the physical activity guideline ex post had been close to meeting it ex ante or had made larger changes in their physical activity behaviour. The income question included in the survey was not answered at all by the majority of the respondents, and answers which were collected were not always clear, resulting in usable data on only 10% of the sample. The inclusion of education
and employment status provides some insight into the influence
of economic factors, however. Collecting reliable income data with
a single question in a multi-component survey is challenging and consideration needs to be given to whether other variables pro-vide an adequate proxy.
Despite the limitations, our results provide a valuable contri-bution to the rather small literature on the effects of active travel interventions on general physical activity, as opposed to travel related activity such as walking and cycling. We have found evi-dence that the intervention is associated with a statistically sig-nificant effect on physical activity participation in SCSP areas and on the probability of those who are active meeting recommend activity levels. This demonstrates that active travel interventions do have the potential to improve health through promoting higher levels of physical activity. Our study also demonstrates the useful-ness of the difference-in-difference approach in overcoming some of the difficulties inherent in evaluating interventions in a quasi-experimental framework.
Additional policy messages can be identified from the cova-riates in the analysis. The likelihood of participation in physical activity was increased with car ownership, our proxy for acces-sibility. This suggests that meeting both the health and other aims of active travel initiatives might be improved in the future by specific consideration of accessibility to sports and leisure
op-portunities for non car owners. The coefficients in the probit
analysis for education support the view that those with higher qualifications are more aware of the benefits of physical activity (increased participation) but, for those who are active, there is no effect on the likelihood of meeting the recommended level of activity, possibly due to the offsetting effect of time costs. The individual coefficients can only indicate direction of effect, but the results for the predicted probabilities indicate that the SCSP pro-gramme was more likely to improve physical activity for those with lower educational qualifications. This may give some indi-cation that active travel interventions could contribute to nar-rowing health inequalities.
Further support for the effect of time constraints on the level of activity is suggested by the results for those in employment, who are more likely to participate in physical activity but less likely to meet the recommended level, when compared with those who are economically inactive. Strategies which incorporate physical ac-tivity into daily routines, including but not limited to active travel, may be more successful for those facing time constraints. Given the limitations discussed above this might be an underestimation of the evaluation of the SCSP impact on physical activity.
Acknowledgements
We gratefully acknowledge funding from Transport Scotland in association with the Convention of Scottish Local Authorities (COSLA) grant to the University of Aberdeen, Scottish Government Contract for the Provision of Monitoring and Evaluation of the Smarter Choices, Smarter Places Programme: Reference 122591. The authors are grateful to collaborators on this project who un-dertook data collection and management and to the residents who gave up their time to complete questionnaires. We would also like to acknowledge the anonymous referees whose comments have improved the paper. The Health Economics Research Unit receives core funding from the Chief Scientist Office, Scottish Government Health and Social Care Directorates and the University of Aberdeen. The views expressed are those of the authors and should not be attributed to any funding body.
Appendix A. Supplementary data
References
Adams, S.A., Matthews, C.E., Ebbeling, C.B., Moore, C.G., Cunningham, J.E., Fulton, J., Herbert, J.R., 2005. The effect of social desirability and social approval on self-reports of physical activity. Am. J. Epidemiol. 13, 389e398.
Anable, J., Schuitema, G., Susilo, Y., Aditjandra, P., Beecroft, M., Nelson, J., 2010. Walking, Cycling and Socio-economic Status in Scotland: Analysis of Statistical Data and Rapid Review of the Literature. Report for NHS Health Scotland. NHS Health Scotland, Edinburgh.
Ahlfeldt, G.M., Kavetsos, G., 2014. Form or function?: the effect of new sports stadia on property prices in London. J. R. Stat. Soc. Ser. A 177 (1), 169e190.
Andersen, L., Schnohr, P., Schroll, M., Hein, H., 2000. All-cause mortality associated with physical activity during leisure time, work, sports, and cycling to work. Arch. Intern. Med. 160, 1621e1628.
Besser, L.M., Dannenberg, A.L., 2005. Walking to public transit: steps to help meet physical activity recommendations. Am. J. Prev. Med. 29, 273e280.
Blundell, R., Costa Dias, M., 2000. Evaluation methods for non-experimental data. Fiscal Stud. 21, 427e468.
Brown, H., Roberts, J., 2011. Exercising choice: the economic determinants of physical activity behaviour of an employed population. Soc. Sci. Med. 73, 383e390.
Cairns, S., Sloman, L., Newson, C., Anable, J., Kirkbride, A., Goodwin, P., 2004. Smarter ChoiceseChanging the Way We Travel. Report for the UK Department for Transport. Department for Transport, London.
Cobiac, L.J., Vos, T., Barendregt, J.J., 2009. Cost-effectiveness of interventions to promote physical activity: a modelling study. PLoS Med. 6, e1000110http:// dx.doi.org/10.1371/journal.pmed.1000110.
de Nazelle, A., Nieuwenhuijsen, M.J., Antó, J.M., Brauer, M., Briggs, D., Braun-Fahrlander, C., et al., 2011. Improving health through policies that promote active travel: a review of evidence to support integrated health impact assessment. Environ. Int. 37, 766e777.
Downward, P., 2007. Exploring the economic choice to participate in sport: results from the 2002 general household survey. Int. Rev. Appl. Econ. 21, 633e653.
Downward, P., Lera-Lopez, F., Rasciute, S., 2011. The zero-inflated ordered probit approach to modelling sports participation. Econ. Model. 28, 2469e2477.
Eberth, B., Smith, M.D., 2010. Modelling the participation decision and duration of sporting activity in Scotland. Econ. Model. 27, 822e834.
Farrell, L., Shields, M.A., 2002. Investigating the economic and demographic de-terminants of sporting participation in England. J. R. Stat. Soc. Ser. A (Stat. Soc.) 165, 335e348.
Gidlow, C., Johnston, L., Crone, D., Ellis, N., James, D., 2006. A systematic review of the relationship between socio-economic position and physical activity. Health Educ. J. 65, 338e367.
Greenberg, M., Renne, J., Lane, R., Zupan, J., 2005. Physical activity and use of suburban train stations: an exploratory analysis. J. Public Transp. 8, 89e116.
Grossman, M., 1972. On the concept of health capital and the demand for health. J. Polit. Econ. 80, 223e255.
Hamer, M., Chida, Y., 2008. Active commuting and cardiovascular risk: a meta-analytic review. Prev. Med. 46, 9e13.
Humphreys, B.R., Ruseski, J.E., 2011. An economic analysis of participation and time spent in physical activity. B.E. J. Econ. Anal. Policy 11, 47.
Kokolakakis, T., Lera-López, F., Panagouleas, T., 2011. Analysis of the determinants of sports participation in Spain and England. Appl. Econ. 44, 2785e2798.
Lucas, K., Jones, P., 2009. The Car in British Society. RAC Foundation, London.
Milton, K., Clemes, S., Bull, F., 2013. Can a single question provide an accurate measure of physical activity? Br. J. Sports Med. 47, 44e48.
Motl, R.W., McAuley, E., DiStefano, C., 2005. Is social desirability associated with self-reported physical activity? Prev. Med. 40, 735e739.
Ogilvie, D., Foster, C.E., Rothnie, H., Cavill, N., Hamilton, V., Fitzsimons, C.F., et al., 2007. Interventions to promote walking: systematic review. Br. Med. J. 334, 1204.
Olabarria, M., Pérez, K., Santamariña-Rubio, E., Novoa, A.M., Racioppi, F., 2012. Health impact of motorised trips that could be replaced by walking. Eur. J. Public Health 23 (2), 217e222.
Physical Activity Task Force, 2003. Let’s Make Scotland More Active: a Strategy for Physical Activity. The Stationary Office, Edinburgh.
Pucher, J., Buehler, R., Bassett, D.R., Dannenberg, A.L., 2010. Walking and cycling to health: a comparative analysis of city, state, and international data. Am. J. Public Health 100, 1986e1992.
Qin, J., Zhang, B., 2008. Empirical-likelihood-based difference-in-differences esti-mators. J. R. Stat. Soc. Ser. B (Stat. Method.) 70, 329e349.
Sahlqvist, S., Goodman, A., Cooper, A.R., Ogilvie, D., 2013. Change in active travel and changes in recreational and total physical activity in adults: longitudinal find-ings from the iConnect study. Int. J. Behav. Nutr. Phys. Act. 10, 28.
The Scottish Executive Education Department, 2006. Sport, Exercise and Physical Activity: Public Participation, Barriers and Attitudes.
The Scottish Government, 2008. Healthy Eating, Active Living: an Action Plan to Improve Diet, Increase Physical Activity and Tackle Obesity (2008-2011). St Andrew’s House, Edinburgh.
The Scottish Government, 2010. Preventing Overweight and Obesity in Scotland: a Route Map Towards Healthy Weight. St Andrew’s House, Edinburgh.
The Scottish Government, 2011. The Scottish Health Survey 2010. In: Main Report, vol. 1. St Andrews House, Edinburgh.
Van de Ven, W.P.M.M., Van Praag, B.M.S., 1981. The demand for deductibles in private health insurance: a probit model with sample selection. J. Econom. 17, 229e252.
Van Stralen, M.M., de Vries, H., Mudde, A.N., Bolman, C., Lechner, 2009. Efficacy of two tailored interventions promoting physical activity in older adults. Am. J. Prev. Med. 37, 405e417.
Wanner, M., Götschi, T., Martin-Diener, E., Kahlmeier, S., Martin, B.W., 2012. Active transport, physical activity, and body weight in adults: a systematic review. Am. J. Prev. Med. 42, 493e502.
Wen, C.P., Wu, X., 2012. Stressing harms of physical inactivity to promote exercise. Lancet 380, 192e193.
World Health Organisation, 2004. Global Strategy on Diet, Physical Activity and Health. Geneva: Switzerland.
World Health Organisation, 2005. Preventing Chronic Diseases: a Vital Investment. Geneva: Switzerland.
World Health Organisation, 2007. The Challenge of Obesity in the WHO European Region and the Strategies for Response. Copenhagen: Denmark.
World Health Organisation, 2009. Global Health Risks. Mortality and Burden of Disease Attributable to Selected Major Risks. Geneva, Switzerland.
World Health Organisation, 2010. Global Recommendations on Physical Activity for Health. Geneva, Switzerland.
Yang, L., Sahlqvist, S., McMinn, A., Griffin, S.J., Ogilvie, D., 2010. Interventions to promote cycling: systematic review. Br. Med. J. 341.