0022-538X/96/$04.0010
Copyrightq1996, American Society for Microbiology
A Simple Reverse Transcriptase PCR Assay To Distinguish
EBNA1 Gene Transcripts Associated with Type I and II
Latency from Those Arising during Induction of the
Viral Lytic Cycle
BRIAN C. SCHAEFER,1† JACK L. STROMINGER,1ANDSAMUEL H. SPECK2*
Division of Tumor Virology, Dana-Farber Cancer Institute, Boston, Massachusetts 02115,1
and Departments of Pathology and Molecular Microbiology and Division of Molecular Oncology, Washington University School of Medicine, St. Louis, Missouri 631102
Received 20 June 1996/Accepted 6 August 1996
In Epstein-Barr virus (EBV)-associated tumors that arise in immunocompetent individuals, the pattern of viral gene expression is very restricted compared with that of latently infected B cells in tissue culture. A hallmark of viral gene expression in these tumors is the exclusive expression of only one EBV-encoded nuclear
antigen, EBNA1, which is driven from a promoter (Qp) that lies near the junction of the viralBamHI F and
Q fragments. During induction of the lytic cycle, a viral promoter, Fp, which lies ca. 200 bp upstream of Qp, gives rise to transcripts which overlap with Qp-initiated EBNA1 gene transcripts. Distinguishing between latency-associated EBNA1 gene transcripts and those associated with the early phase of the viral lytic cycle is critical for correct identification of restricted viral latency. Here we describe a reverse transcriptase PCR
protocol which employs a nested set of upstream primers from theBamHI Q region of the viral genome and
readily distinguishes Fp-initiated transcripts from Qp-initiated transcripts. A single set of amplification conditions was used for the various PCR primer combinations, which allowed all reactions to be run simul-taneously. An in vitro-generated transcript, diluted in RNA from an EBV-negative cell line, was used to demonstrate that the efficiencies of amplification with the different primer combinations were very similar. This protocol was used to demonstrate that EBNA1 gene transcription in two previously uncharacterized EBV-positive epithelial cell lines initiates from Qp. In addition, we assessed the site(s) of initiation of EBNA1 gene transcripts in cell lines exhibiting restricted viral latency. Contrary to the results of Nonkwelo et al. (J. Virol. 70:623–627, 1996), which indicated that EBNA1 gene transcription during restricted viral latency initiates at multiple sites downstream of Fp, we show here that nearly all EBNA1 transcripts start at the previously identified Qp transcription initiation site.
Epstein-Barr virus (EBV) is a lymphotropic herpesvirus that is closely associated with the development of a number of human cancers in immunocompetent individuals, including Burkitt’s lymphoma (BL), nasopharyngeal carcinoma, Hodgkin’s disease, and peripheral T-cell lymphoma. The pat-tern of viral gene expression (type I or type II latency) in these tumors is very restricted compared with that of peripheral B cells immortalized by EBV (type III latency). Most notably, the only viral nuclear antigen which has been detected in these tumors is EBNA1 (1, 3, 4, 6, 14, 16–18, 24, 29). The distinction between type I and type II latency is the expression, in addition to that of EBNA1, of the latency-associated membrane pro-teins LMP1 and LMP2 during type II latency (1, 3, 4, 6, 8, 14, 24, 29). It has recently been demonstrated that EBNA1 fails to be processed and presented in conjunction with major histo-compatibility complex class I on the surface of tumor cells (11), consistent with the inability of virus-specific cytotoxic T lym-phocytes to recognize BL tumor cells (15).
Exclusive expression of EBNA1 during type I and II latency is driven from a viral promoter, Qp, that maps near the
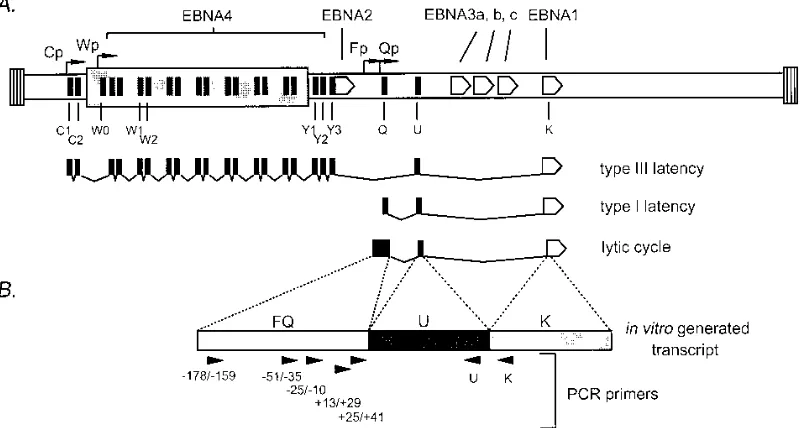
junc-tion of the viral BamHI F and Q fragments (22) and is com-pletely distinct from the viral promoters employed to drive expression of all six nuclear antigens during type III latency (reviewed in reference 25). In addition, a low level of EBNA1 transcripts is produced during the induction of the lytic cycle from a promoter, Fp, which maps ca. 200 bp upstream of Qp (10, 20, 21, 23). Although the bulk of Fp-initiated transcripts do not splice to the EBNA1 coding exon (K exon) (see Fig. 1), a small portion of Fp-initiated transcripts do splice to the EBNA1 coding exon (21). As shown in Fig. 1A, Fp-initiated EBNA1 transcripts completely overlap EBNA1 transcripts arising from Qp. To date, the identification of EBNA1 tran-scripts associated with type I or type II viral latency in tumor samples has not taken into account the possible ambiguity introduced by the presence of lytic cycle-associated EBNA1 transcripts arising from Fp. In addition, a recent report has suggested that in BL cell lines exhibiting the type I latency pattern of viral gene expression, EBNA1 gene transcription initiates at multiple sites downstream of Fp (12). To address these issues, we developed a reverse transcriptase (RT)-PCR assay, employing nested upstream primers, to distinguish be-tween EBNA1 gene transcripts initiating at Fp, Qp, or sites between Fp and Qp. The primers employed in these studies are illustrated in Fig. 1B, and their sequences are given in Table 1.
In vitro generation of an FQ-U-K spliced RNA transcript.
To compare the sensitivities of the various primers used in this RT-PCR assay, we generated a plasmid construct which allows * Corresponding author. Mailing address: Department of Pathology,
Box 8118, Washington University School of Medicine, 660 S. Euclid Ave., St. Louis, MO 63110. Phone: (314) 0367. Fax: (314) 362-4096. Electronic mail address: [email protected].
† Present address: Department of Medicine, Howard Hughes Medi-cal Institute, National Jewish Center, Denver, CO 80206.
8204
on November 9, 2019 by guest
http://jvi.asm.org/
the in vitro transcription of an FQ-U-K cDNA containing the entire FQ exon, the entire U exon, and the first 208 nucleotides of the K exon (Fig. 1B). This cDNA was derived by PCR amplification of the spliced FQ and U exons (Fp-initiated lytic transcripts) and the spliced U and K exons (Qp-initiated latent transcripts) from the Mutu I cell line. These two PCR products were joined at the U exon PstI site to generate the FQ-U-K cDNA. This cDNA was cloned into the XhoI and XbaI sites downstream of the bacteriophage SP6 promoter in the pSP72 vector (Promega). In vitro transcription of BglII-linearized pSP72FQ/U/K generates an FQ-U-K RNA which differs from a bona fide FQ-U-K spliced EBNA1 transcript only in that it lacks K exon sequences following the first 208 nucleotides and contains nine extra bases (59-GAACTCGAG-39) at the 59end of the transcript.
An FQ-U-K exon containing RNA was generated by in vitro transcription with SP6 polymerase (New England Biolabs) and then treated with DNase (RQ1 DNase; Promega) under stan-dard reaction conditions (19). Tenfold serial dilutions of the in
vitro transcription product were made into 2mg of total RNA prepared from the EBV-negative BL cell line DG75, and these mixtures were reverse transcribed and PCR amplified (see below for specific conditions) to determine the range of dilu-tions in which cDNA synthesis and amplification by PCR were in the linear range (data not shown). The dilution most closely approximating signals obtained by RT-PCR of total RNA from EBV-positive cell lines (2ml of a 1023dilution) was chosen to
test the relative efficiencies of the various primer sets in the RT-PCR assay. The same amount of RNA was used for re-verse transcription with the U and K cDNA primers.
RT-PCR conditions.RT-PCR was performed according to
[image:2.612.108.510.75.289.2]the method of Kawasaki (7). Two micrograms of total RNA from the indicated cell line (or the FQ-U-K artificial transcript in DG75 total RNA; see above) was reverse transcribed at 428C with Superscript-II RT (Gibco-BRL) and 50 pmol of the indicated reverse transcription primer. Following phenol-chlo-roform extraction, chlophenol-chlo-roform extraction, and ethanol precip-itation, the RNA template was removed via hydrolysis with FIG. 1. (A) Schematic illustration of the exon structures of EBNA1 gene transcripts present during restricted viral latency (type I and II latency), growth-transforming latency (type III), and the early stages of the viral lytic cycle. The organization of the viral genome is shown at the top of the panel, and the positions of the coding exons for the six EBNA genes expressed during type III latency are indicated. The regions encoding exons present at the 59end of type III (C1, C2, W0, W1, W2, Y1, Y2, and Y3) and type I (Q and U) latency-associated EBNA gene transcripts are indicated. (B) Schematic illustration of the in vitro-generated FQ-U-K transcript employed to assess the relative efficiencies of various PCR primer pairs (see the discussion of structure in the text). Arrowheads indicate the positions and orientations of PCR primers used in this study. The upstream primers are named according to their position relative to the major Qp transcription initiation site. The U and K downstream PCR primers hybridize either near the 39end of the U exon or near the 59end of the K exon, as indicated. The sequences of the PCR primers are given in Table 1.
TABLE 1. Oligonucleotides used for cDNA synthesis and PCR amplification
Primer Sequence EBV genome coordinates
Reverse transcription primers
K cDNA 59-CATTTCCAGGTCCTGTACCT-39 107,986–107,967
U cDNA 59-CTTAAAGGAGACGGCCGCGG-39 67,649–67,630
PCR primers
Q(125/141) 59-AGCGTGCGCTACCGGAT-39 62,437–62,453
Q(113/129) 59-AAGGCGCGGGATAGCGT-39 62,425–62,441
Q(225/210) 59-ATATGAGCTCGGTGAGGCCACGCTT-39 62,425–62,441
Q(251/235) 59-ATATGAGCTCATGTTGTCTGGTCGCTA-39 62,362–62,378
Q(2178/2159) 59-ATATGGATCCGGAGGGGACCACTA-39 62,249–62,268
K 59-CCCCTCGTCAGACATGAT-39 107,964–107,947
U 59-CGGTGAATCTCGTCCCAGGT-39 67,629–67,610
on November 9, 2019 by guest
http://jvi.asm.org/
[image:2.612.66.557.604.727.2]sodium hydroxide (22). The cDNA was then ethanol precipi-tated and resuspended in 50 ml of water. Two microliters of this reverse transcription product was then PCR amplified in a 25-ml volume with 20 pmol of each of the indicated primers, recombinant Pfu DNA polymerase (Stratagene), and the man-ufacturer’s supplied buffer. For the experiment in which effi-ciencies of the different primer sets were compared, 1:5 and 1:25 dilutions of the cDNA were also amplified. PCR mixtures were assembled on ice to minimize primer extension prior to the start of PCR cycling. The thermocycling parameters used for all primer pairs were as follows: 1 cycle of 988C for 3 min, 558C for 1 min, and 728C for 2 min followed by 24 cycles of 978C for 1 min, 558C for 1 min, and 728C for 1 min. An extension reaction at 728C for 10 min followed the final cycle. All amplifications were performed in thin-walled PCR tubes (Perkin-Elmer) in a Perkin-Elmer DNA thermal cycler, model 480.
Following amplification, one-fifth of the PCR product was separated by electrophoresis on a 1.5% agarose gel, trans-ferred to Hybond-N (Amersham), and subjected to Southern blotting by established protocols (19). Blots were probed with a random-primed 32P-labeled BamHI U exon probe derived
from bases 1250 to 1731 (XhoI to ClaI) of the EBV BamHI U fragment, which includes the entire U exon.
In the experiment testing primer efficiency, all PCRs were performed simultaneously and the reactions were separated on a single gel, transferred to a single membrane, hybridized in a single container, and exposed on the same piece of film. For the amplification of cell lines with a given 59 PCR primer, K-primed and U-primed cDNAs were amplified simulta-neously, run on the same gel, and transferred to the same membrane. All hybridizations were performed with the same quantity of a single preparation of labeled probe under iden-tical conditions. All film exposures were of equal duration [except where noted in the legend to Fig. 3 for the amplifica-tion with the Q(225/210) upstream primer].
Efficiency of amplification with different PCR primer
com-binations.As discussed above, to assess the relative efficiencies
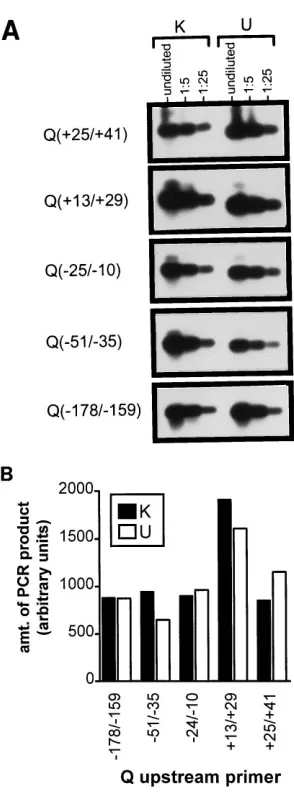
of amplification with the different primer combinations, an in vitro-synthesized transcript was generated with SP6 polymer-ase. This transcript was diluted into 2 mg of total RNA pre-pared from an EBV-negative BL cell line (DG75) and subse-quently subjected to RT-PCR analysis (Fig. 2). Undiluted cDNA, as well as 1:5 and 1:25 dilutions of the cDNA reaction mixture were analyzed with the different primer combinations. cDNA generated with an EBNA1-coding-exon-specific primer (K-primed cDNA) was analyzed with the downstream K PCR primer, while cDNA generated with a U-exon-specific primer (U-primed cDNA) was analyzed with the downstream U PCR primer. As shown in Fig. 2A, all primer combinations exhibited similar efficiencies in amplifying the K- or U-primed cDNA with the in vitro-generated transcript. Notably, the efficiencies in generating cDNA with the K or U cDNA primers, as as-sessed by the efficiencies of amplification with a particular upstream primer and either the K or the U downstream primer, were not significantly different (Fig. 2A). In addition, while the various upstream primers were not identical in their efficiency of amplification of the K- or U-primed cDNAs, the results were strikingly similar. The differences in the amplifi-cation efficiencies were quantitated by densitometry (Molecu-lar Dynamics), and the results with the 1:25-diluted cDNA (of which the amplifications were clearly in the linear range) are shown in Fig. 2B. On the basis of this analysis, there appears to be a twofold or less difference in the efficiency of amplification of the in vitro-generated transcript with the PCR primer pairs employed. Thus, these results demonstrate that the PCR
prim-ers used and the assay conditions described are suitable for distinguishing transcripts initiating from Fp, Qp, or the region between these promoters.
Analysis of EBNA1 transcripts in cell lines exhibiting
re-stricted viral latency.To critically assess the site(s) of initiation
of EBNA1 gene transcripts in cell lines exhibiting restricted viral latency, RNAs were prepared from a panel of cell lines and subjected to the RT-PCR assay described above. In addi-tion, we wished to assess the level of Fp-initiated EBNA1 gene FIG. 2. (A) Relative efficiencies of amplification of cDNA, synthesized with RNA prepared from the DG75 EBV-negative BL cell line spiked with the in vitro-generated FQ-U-K transcript, with various PCR primer combinations. The K-primed cDNAs in the left-hand sides of the gels were amplified with the indicated Q primers (labeled to the left of each set of gels) and with the K downstream PCR primer (Table 1). The U-primed cDNAs in the right-hand sides of the gels were amplified with the indicated Q primers and the U down-stream PCR primer (Table 1). Undiluted (1:5) or diluted (1:25) cDNA was added to the amplification reaction mixtures as indicated. All PCRs were run simultaneously with the same reaction conditions, and then the mixtures were separated on an agarose gel, transferred to a nylon membrane, and hybridized with a U-exon-specific probe (see the description in the text). The blot was exposed to film, and the same exposure is shown for all amplification reactions. (B) Quantitation by densitometry (Molecular Dynamics) of RT-PCR results with diluted (1:25) cDNAs. A single film exposure was scanned, and the relative levels of PCR product obtained upon amplification of diluted (1:25) K-primed and U-primed cDNAs with the K or the U downstream PCR primer, respectively, are indicated.
on November 9, 2019 by guest
http://jvi.asm.org/
[image:3.612.362.509.62.459.2]transcripts in cell lines exhibiting spontaneous lytic cycle activ-ity relative to the abundance of Qp-initiated EBNA1 tran-scripts. The EBV-immortalized lymphoblastoid cell lines X50-7 and JY, which exhibit a type III latency pattern of viral gene expression, have been described and characterized pre-viously (27, 28). DG75 is an EBV-negative BL cell line and served as a negative control. Rael (9) and Mutu group I (5) are BL cell lines that exhibit a type I latency pattern of viral gene expression. NPC-KT and D98HR1 are EBV-positive adherent cell lines which also exhibit a restricted pattern of viral gene expression. NPC-KT was derived by fusion of freshly explanted nasopharyngeal carcinoma tumor cells with the EBV-negative epithelial line AdAH (26), and D98/HR1 was the product of a fusion between the BL cell line P3HR1 and the epithelial cell line D98 (13). All lymphoid cell lines were propagated in RPMI 1640 supplemented with 10% fetal bovine serum, and adherent cells were cultured in Dulbecco’s modified Eagle’s
medium containing 10% fetal bovine serum. Total RNA was isolated from cells via the single-step method (2). RNA was then treated with RQ1 DNase (Promega) according to the manufacturer’s instructions.
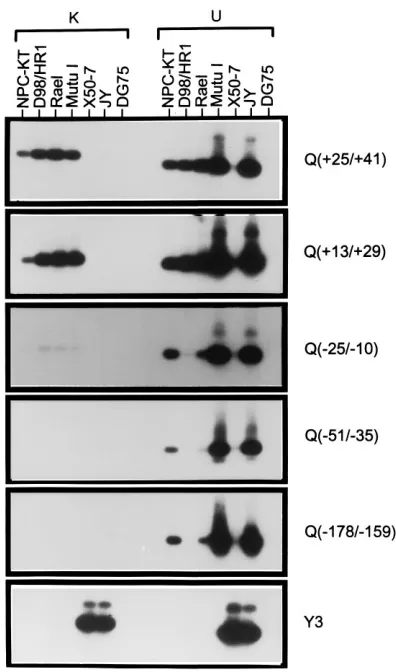
As shown in Fig. 3, the Q PCR primers which lie down-stream of the Qp transcription initiation site [Q(125/141) and Q(113/129)], with K-primed cDNA in conjunction with the K downstream PCR primer, amplified product that could readily be detected with cDNA from the two type I BL cell lines, as well as from the two EBV-positive adherent cell lines (NPC-KT and D98/HR1). When U-primed cDNA was assessed with these primers, in conjunction with the U PCR primer, ampli-fied product could easily be detected from the JY cell line, as well as from the other cell lines detected with the K down-stream primer. The signal detected with cDNA prepared from JY RNA reflects Fp-initiated lytic transcripts, since this am-plified product was detected with all the upstream Q primers (Fig. 3). However, cDNA prepared from the X50-7 cell line, which exhibits extremely low levels of spontaneous lytic cycle activity, consistently failed to yield amplified product with any of the Q PCR primers. From these results it is apparent that the abundance of Fp-initiated transcripts that splice to the EBNA1 coding exon is very low, since no PCR product was detected under these assay conditions with JY cDNA when the K downstream primer was employed (Fig. 3). It should also be noted that comparison of the PCR amplifications with the K and U downstream PCR primers revealed a strong increase in the signal with Mutu I cDNA with the U PCR primer. Mutu I cells are known to exhibit significant levels of spontaneous lytic activity (21), and this is underscored by the ability to detect these transcripts with all the upstream Q PCR primers in conjunction with the U downstream primer (Fig. 3).
Employing Q PCR primers which lie upstream of the Qp transcription initiation site [Q(225/210), Q(251/235), and Q(2178/2159)] in combination with the downstream K PCR primer resulted in little or no amplified product (Fig. 3). Over-exposure of the autoradiogram with the Q(225/210) and K PCR primer pair, which is shown in the third panel of Fig. 3, demonstrated weak amplification of the cDNAs generated from D98/HR1, Rael, and Mutu I RNAs. No detectable prod-uct could be detected with the further upstream Q PCR prim-ers. However, in each case lytic Fp-initiated transcripts were readily detected with the Q primers in conjunction with the U PCR primer. Notably, the D98/HR1 cell line was shown to exhibit a very low level of spontaneous lytic cycle activity since no amplified products could be detected with the far upstream Q primers in conjunction with the U PCR primer (Fig. 3). The bottom panel in Fig. 3 demonstrates amplification of K- and U-primed cDNA with an upstream primer specific for the Y3 exon (present in EBNA transcripts in type III latently infected cells) and either the K or U downstream PCR primer. As expected, amplified product could be detected only with cDNA prepared from the type III latently infected cell lines JY and X50-7.
Conclusions.In this paper we have described an RT-PCR
assay which readily allows type I and II latency-associated EBNA1 transcripts to be distinguished from lytic transcripts which arise from Fp and splice to the EBNA1 coding exon. Under the assay conditions employed, the latter transcripts were not detected while the Qp-initiated EBNA1 transcripts were easily detected. Use of the downstream U PCR primer in conjunction with the far upstream Q PCR primers afforded a direct assessment of the level of spontaneous lytic cycle activity in a cell population. As previously described (10, 21, 22), em-ploying the Y3 exon upstream primer with either the U or the K downstream primer controlled for the level of type-III-la-FIG. 3. RT-PCR amplification of EBNA1-coding-exon- and
U-exon-contain-ing transcripts. cDNAs were prepared as described in the text from total RNAs harvested from the cell lines indicated above the gels. The left-hand side of each gel shows the amplification of K-primed cDNA with the indicated Q upstream primer in conjunction with the K downstream PCR primer. The right-hand side of each gel shows the amplification of U-primed cDNA with the indicated Q upstream primer in conjunction with the U downstream PCR primer. The se-quences of the cDNA and PCR primers employed are given in Table 1. A single preparation of K-primed or U-primed cDNA was used for all PCRs, and all amplifications were carried out under the same reaction conditions. The result-ing amplified samples were processed as described in the text and the legend to Fig. 2. The same film exposure is shown for all panels, with the exception of the amplification with the Q(225/210) upstream primer, for which a longer expo-sure is shown to demonstrate the very weak amplification observed when the Q(225/210) upstream primer was used in conjunction with the K downstream PCR primer.
on November 9, 2019 by guest
http://jvi.asm.org/
[image:4.612.78.276.67.403.2]tency-associated transcription. Previous attempts to detect Qp-or Fp-initiated transcripts have either relied on only a single primer pair (10, 20) or failed to generate standard reaction conditions and to assess the efficiencies of amplification (12). The data presented also convincingly demonstrate that in the four cell lines examined which exhibit restricted viral la-tency (NPC-KT, D98/HR1, Rael, and Mutu I), there was little evidence of latency-associated EBNA1 gene transcription ini-tiating upstream of the previously identified Qp transcription initiation site (22). As we have previously described (22), Qp is a TATA-less promoter with characteristics of the promoters of housekeeping genes. TATA-less promoters often exhibit a somewhat broad region of transcription initiation, and thus the detection of a very low level of transcripts with the Q(225/
210) PCR primer may simply reflect this imprecision in the site of transcription initiation. It seems likely that the previous report of transcription initiation in the region between Qp and Fp (12) did not accurately reflect the relative abundance of these various populations. Indeed, in the report by Nonkwelo et al. (12), the data obtained by RNase protection did not agree with that obtained by RT-PCR. The source of this vari-ability is unclear at this time. However, neither assay was designed to compare the relative levels of abundance of tran-scripts initiating at a particular start site. Given the diverse origins of the cell lines examined in this report, the consistency of the results argues strongly that EBNA1 gene transcription during type I and II latency initiates nearly exclusively at the previously described Qp transcription initiation site.
This work was supported by NIH grants CA58524 (to S.H.S.) and CA47554 (to J.L.S.). S.H.S. is a Scholar of the Leukemia Society of America. B.C.S. was supported by an Office of Naval Research grad-uate research fellowship.
REFERENCES
1. Chen, C. L., R. H. Sadler, D. M. Walling, I. J. Su, H. C. Hsieh, and N. Raab-Traub.1993. Epstein-Barr virus gene expression in EBV-positive pe-ripheral T-cell lymphomas. J. Virol. 67:6303–6308.
2. Chomczynski, P., and N. Sacchi. 1987. Single-step method of RNA isolation by acid guanidium thiocyanate-phenol-chloroform extraction. Anal. Bio-chem. 162:156–159.
3. Deacon, E. M., G. Pallesen, G. Niedobitek, J. Crocker, L. Brooks, A. B. Rickinson, and L. S. Young.1993. Epstein-Barr virus and Hodgkin’s disease: transcriptional analysis of virus latency in the malignant cells. J. Exp. Med. 177:339–349.
4. Fahraeus, R., H. Li-Fu, I. Ernberg, J. Finke, M. Rowe, G. Klein, K. Falk, E. Nilsson, M. Yadaf, P. Busson, T. Tursz, and B. Kallin.1988. Expression of the Epstein-Barr virus genome in nasopharyngeal carcinoma. Int. J. Cancer 42:329–338.
5. Gregory, C. D., M. Rowe, and A. B. Rickinson. 1990. Different Epstein-Barr virus-B cell interactions in phenotypically distinct clones of a Burkitt’s lym-phoma cell line. J. Gen. Virol. 71:1481–1495.
6. Hitt, M., M. Allday, T. Hara, L. Karran, M. Jones, P. Busson, T. Tursz, I. Ernberg, and B. Griffin.1989. EBV gene expression in an NPC-related tumour. EMBO J. 8:2639–2651.
7. Kawasaki, E. S. 1990. Amplification of RNA, p. 21–27. In M. A. Innis, D. H. Gelfand, J. J. Sninsky, and T. J. White (ed.), PCR protocols: a guide to methods and applications. Academic Press, Inc., San Diego, Calif. 8. Kerr, B. M., A. L. Lear, M. Rowe, D. Croom-Carter, L. S. Young, S. M.
Rookes, P. H. Gallimore, and A. B. Rickinson.1992. Three transcriptionally distinct forms of Epstein-Barr virus latency in somatic cell hybrids: cell phenotype dependence of virus promoter usage. Virology 187:189–201. 9. Klein, G., L. Dombos, and B. Gothosokar. 1972. Sensitivity of Epstein-Barr
virus (EBV) producer and non-producer human lymphoblastoid cell lines to superinfection with EB-virus. Int. J. Cancer 10:44–57.
10. Lear, A. L., M. Rowe, M. G. Kurilla, S. Lee, S. Henderson, E. Kieff, and A. B. Rickinson.1992. The Epstein-Barr virus (EBV) nuclear antigen 1 BamHI F promoter is activated on entry of EBV-transformed B cells into the lytic cycle. J. Virol. 66:7461–7468.
11. Levitskaya, J., M. Coram, V. Levitsky, S. Imreh, P. M. Steigerwald-Mullen, G. Klein, M. G. Kurilla, and M. G. Masucci.1995. Inhibition of antigen processing by the internal repeat region of the Epstein-Barr virus nuclear antigen-1. Nature (London) 375:685–688.
12. Nonkwelo, C., J. Skinner, A. Bell, A. Rickinson, and J. Sample. 1996. Tran-scription start sites downstream of the Epstein-Barr virus (EBV) Fp pro-moter in early-passage Burkitt lymphoma cells define a fourth propro-moter for expression of the EBV EBNA-1 protein. J. Virol. 70:623–627.
13. Nonoyama, M., A. Tanaka, S. Silver, and R. Glaser. 1978. Transcription of EBV genomes in human lymphoblastoid cells and in somatic-cell hybrids of Burkitt’s lymphoma. IARC (Int. Agency Res. Cancer) Sci. Publ. 24:559–563. 14. Pallesen, G., S. J. Hamilton-Dutoit, M. Rowe, and L. Young. 1991. Expres-sion of the Epstein-Barr virus latent gene products in tumor cells of Hodgkin’s disease. Lancet 337:320–322.
15. Rooney, C., M. Rowe, L. Wallace, and A. B. Rickinson. 1985. Epstein-Barr virus-positive Burkitt’s lymphoma cells are not recognized by virus-specific T-cell surveillance. Nature (London) 317:629–631.
16. Rowe, D. T., M. Rowe, G. I. Evan, L. Wallace, P. J. Farrell, and A. B. Rickinson.1986. Restricted expression of EBV latent genes and T-lympho-cyte-detected membrane antigen in Burkitt’s lymphoma cells. EMBO J. 5:2599–2607.
17. Rowe, M., and C. Gregory. 1989. Epstein-Barr virus and Burkitt’s lymphoma. Adv. Viral Oncol. 8:237–259.
18. Rowe, M., D. Rowe, C. Gregory, L. S. Young, P. Farrell, H. Rupani, and A. B. Rickinson.1987. Differences in B cell growth phenotype reflect novel pat-terns of Epstein-Barr virus latent gene expression in Burkitt’s lymphoma cells. EMBO J. 6:2743–2751.
19. Sambrook, J., E. F. Fritsch, and T. Maniatis. 1989. Molecular cloning: a laboratory manual, 2nd ed. Cold Spring Harbor Laboratory Press, Cold Spring Harbor, N.Y.
20. Sample, J., L. Brooks, C. Sample, L. Young, M. Rowe, C. Gregory, A. Rickinson, and E. Kieff.1991. Restricted Epstein-Barr virus protein expres-sion in Burkitt lymphoma is due to a different Epstein-Barr nuclear antigen 1 transcriptional initiation site. Proc. Natl. Acad. Sci. USA 88:6343–6347. 21. Schaefer, B. C., J. L. Strominger, and S. H. Speck. 1995. The Epstein-Barr
virus BamHI F promoter is an early lytic promoter: lack of correlation with EBNA1 gene transcription in group I Burkitt’s lymphoma cell lines. J. Virol. 69:5039–5047.
22. Schaefer, B. C., J. L. Strominger, and S. H. Speck. 1995. Redefining the Epstein-Barr virus-encoded nuclear antigen EBNA-1 gene promoter and transcription initiation site in group I Burkitt lymphoma cell lines. Proc. Natl. Acad. Sci. USA 92:10565–10569.
23. Schaefer, B. C., M. Woisetschlaeger, J. L. Strominger, and S. H. Speck. 1991. Exclusive expression of Epstein-Barr virus nuclear antigen 1 in Burkitt lym-phoma arises from a third promoter, distinct from the promoters used in latently infected lymphocytes. Proc. Natl. Acad. Sci. USA 88:6550–6554. 24. Smith, P. R., and B. E. Griffin. 1992. Transcription of the Epstein-Barr virus
gene EBNA-1 from different promoters in nasopharyngeal carcinoma and B-lymphoblastoid cells. J. Virol. 66:706–714.
25. Speck, S. H., and J. L. Strominger. 1989. Transcription of Epstein-Barr virus in latently infected, growth transformed lymphocytes. Adv. Viral Oncol. 8:133–150.
26. Takimoto, T., M. Kamide, and R. Umdea. 1984. Establishment of Epstein-Barr virus (EBV)-associated nuclear antigen (EBNA)-positive nasopharyn-geal carcinoma hybrid cell line (NPC-KT). Arch. Oto-Rhino-Laryngol. 239: 87–92.
27. Woisetschlaeger, M., J. L. Strominger, and S. H. Speck. 1989. Mutually exclusive use of viral promoters in Epstein-Barr virus latently infected lym-phocytes. Proc. Natl. Acad. Sci. USA 86:6498–6502.
28. Woisetschlaeger, M., C. N. Yandava, L. A. Furmanski, J. L. Strominger, and S. H. Speck.1990. Promoter switching in Epstein-Barr virus during the initial stages of infection. Proc. Natl. Acad. Sci. USA 87:1725–1729.
29. Young, L., C. Dawson, D. Clark, H. Rupani, P. Busson, T. Tursz, A. Johnson, and A. B. Rickinson.1988. Epstein-Barr virus gene expression in nasopha-ryngeal carcinoma. J. Gen. Virol. 69:1051–1065.