THE TAMILNADU Dr. M.G.R. MEDICAL
UNIVERSITY
CHENNAI – TAMILNADU.
DISSERTATION ON
A STUDY ON HIGH SENSITIVITY CRP
AS A SHORT TERM PROGNOSTIC FACTOR
IN ACUTE ISCHEMIC STROKE
SUBMITTED FOR M.D. DEGREE EXAMINATION
BRANCH I
(GENERAL MEDICINE)
EXAMINATION
IN
MARCH – 2008
CERTIFICATE
This is to certify that this dissertation entitled “A STUDY ON HIGH
SENSITIVITY CRP AS A SHORT TERM PROGNOSTIC FACTOR IN
ACUTE ISCHEMIC STROKE” is the bonafide record work done by Dr.
S. APPANDRAJ, submitted as partial fulfillment for the requirements of
M.D. Degree Examinations, General Medicine (Branch I) to be held in
March 2008.
Prof. Dr. S.MUTHUKUMARAN, M.D., Prof. Dr. N. JEEVA, M.D.,
Professor and H.O.D, Professor of Therapeutics, Department of Medicine, Department of Medicine
Thanjavur Medical College Hospital, Thanjavur Medical College Hospital,
Thanjavur. Thanjavur.
THE DEAN,
ACKNOWLEDGEMENT
It is with deepest appreciation and gratitude that I thank my unit
chief, Dr. N. JEEVA M.D., Prof of Therapeutics, my guide and
mentor for maneuvering this study at every meander and without whose
able guidance, constant encouragement, philosophical views and ever
available help, this work could not have been possible.
I consider it a privilege to have been this study under the
supervision of my beloved professor and HOD,
Dr. S. MUTHUKUMARAN M.D., who was a source of constant
inspiration and encouragement to me.
My grateful thanks to Dr. P.S.GANESAN M.D., D.M., professor
of Neurology, Dr. M.ANGURAJ M.D., D.M., and Dr. M.THANGARAJ
M.D., D.M., assistant professor of Neurology for their valuable
I take this opportunity to thank all unit chiefs, Dept of Internal
Medicine for their constant encouragement.
I thank Dr. D. SEKAR M.D., and Dr. G. GOWTHAMAN M.D.,
assistant professors for their valuable opinion and moral support for
doing this dissertation.
I thank Dr. MOHAMMAD ALI M.D., assistant professor of S.P.M.
Dept., for his extreme help in statistical analysis.
I am extremely thankful to Dr. R.M.NATARJAN M.S.,
Dean , TMCH, for granting me permission to under take and complete
the dissertation in Thanjavur medical college, Thanjavur.
BRIEF CONTENTS
Page.No
Chapter-1 INTRODUCTION 1
Chapter-2 AIM OF THE STUDY 3
Chapter-3 REVIEW OF LITERATURE 4
Chapter-4 MATERIALS AND
METHODS
27
Chapter-5 RESULTS AND
OBSERVATION 32
Chapter-6 DISCUSSION 50
Chapter-7 SUMMARY AND
CONCLUSION 63
TABLE OF CONTENTS
List of abbreviations
List of Tables
List of Figures
Abstract
Chapter 1 Introduction 1
Chapter 2 Aim of the study 3
Chapter 3 Review of literature 4
3.1 Definition of stroke 4
3.2 Epidemiology 4
3.2.1 World 4
3.2.2 India 4
3.3 Pathophysiology of stroke 5
3.4 Pathophysiology of ischemic stroke 6
3.5 Risk factors 7
3.6 Inflammation, Endothelial dysfunction and Atherogenesis 8
3.7 Risk factors and mechanism of injury 13
3.7.1 Hypertension 13
3.7.2 LDL 14
3.7.3 Diabetes Mellitus 16
3.7.4 Smoking 17
3.7.5 Infection 17
3.7.6 Chlamydia 18
3.8 Inflammatory biomarker as predictor of 19
stroke risk 3.8.1 CRP 19
Chapter 4 Materials and methods 27
4.1 Setting 27
4.2 Study design 27
4.2.1 Inclusion criteria 27
4.2.2 Exclusion criteria 28
4.3 Study method 28
4.3.1 Clinical examination 28
4.3.2 Investigations 29
4.4 Hs CRP test 29
4.4.1 Principle of nephelometry 30
4.4.2 Instrument 30
4.5 Assessing functional outcome 31
Chapter 5 Results and observation 32
5.1 Age 32
5.2 Frequency tables 32
5.3 Risk factor comparison with Glasgow outcome scale 38
5.3.1 Hs CRP level and functional outcome 38
5.3.2 TC and functional outcome 39
5.3.3 HDL and functional outcome 41
5.3.4 TC/HDL and functional outcome 42
5.3.5 Smoking and functional outcome 43
5.3.6 Alcohol and functional outcome 44
5.3.7 Hypertension and functional outcome 45
5.3.8 CAHD and functional outcome 45
5.3.9 Obesity and functional outcome 46
5.4 Comparison of Hs CRP with other known risk factors 48
5.4.1 Hs CRP with age 48
5.4.2 Hs CRP with gender 48
5.4.3 Hs CRP with smoking 48
5.4.4 Hs CRP with Diabetes mellitus 49
5.4.5 Hs CRP with Hypertension 49
5.4.6 Hs CRP with CAHD 49
5.4.7 Hs CRP with Obesity 49
5.4.8 Hs CRP with Alcohol 49
Chapter 6 Discussion 50
6.1 Age 50
6.2 Gender 51
6.3 Smoking 52
6.4 Alcohol 53
6.5 Hypertension 53
6.6 Diabetes 55
6.7 CAHD 56
6.8 Obesity 57
6.9 TC and functional outcome 58
6.10 HDL and functional outcome 58
6.11 TC/HDL ratio and functional outcome 59
6.12 Hs CRP level and functional outcome 60
Chapter 7 Summary and Conclusion 63
Bibliography
Appendix A Proforma
List of abbreviations
1. 4S – Scandinavian Simvastatin Survival Study 2. ACE – Angiotensin Converting Enzyme
3. AF – Atrial Fibrillation 4. BMI – Body Mass Index 5. BP – Blood Pressure
6. CAHD – Coronary Artery Heart Disease 7. CARE – Cholesterol And Recurrent Events 8. CBF – Cerebral Blood Flow
9. CNS – Central Nervous System 10. CRP – C Reactive Protein 11. CT – Computed Tomography 12. CVD – Cardiovascular Disease 13. dl – Deciliter
14. DM – Diabetes Mellitus
15. ELISA – Enzyme Linked Immuno abSorbent Assay 16. FGF – Fibroblast Growth Factor
17. GM-CSF – Granulocyte Macrophage Colony Stimulating Factor 18. HDL – High Density Lipoprotein
19. hs CRP – High Sensitivity CReactive Protein 20. HT – Hypertension
21. ICAM – Inter Cellular Addition Molecule 22. Ig – Immunoglobulin
List of abbreviations
24. IHD – Ischemic Heart Disease 25. IL – Interleukin
26. l – Litre
27. LDL – Low Density Lipoprotein
28. LIPID – Longterm Intervention with Provastatin in Ischemic Dis. 29. LP(a) – LipoProtein (a)
30. MCP-1 – Monocytic Chemoattractant Protein – 1 31. mg – Milligram
32. MI – Myocardial Infarction
33. MONICA – MONitoring trends and determinants In CArdiovascular disease 34. MRFIT – Multiple Risk Factor Intervention Trial
35. MRI – Magnetic Resonance Imaging
36. NIHSS – National Institute Of Health Stroke Scale 37. PAF – Platelet Activating Factor
38. PAI – Plasminogen Activator Inhibitor 39. PDGF – Platelet Derived Growth Factor 40. PVD – Peripheral Vascular Disease 41. REC – Recoding
42. RHPP – Rural Health Promotion Project 43. SLE – Systemic Lupus Erythematoses 44. TC – Total Cholesterol
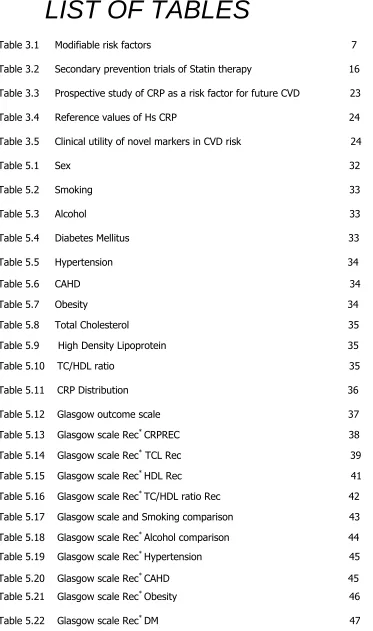
LIST OF TABLES
Table 3.1 Modifiable risk factors 7
Table 3.2 Secondary prevention trials of Statin therapy 16
Table 3.3 Prospective study of CRP as a risk factor for future CVD 23
Table 3.4 Reference values of Hs CRP 24
[image:11.612.92.465.78.709.2]Table 3.5 Clinical utility of novel markers in CVD risk 24
Table 5.1 Sex 32
Table 5.2 Smoking 33
Table 5.3 Alcohol 33
Table 5.4 Diabetes Mellitus 33
Table 5.5 Hypertension 34
Table 5.6 CAHD 34
Table 5.7 Obesity 34
Table 5.8 Total Cholesterol 35
Table 5.9 High Density Lipoprotein 35
Table 5.10 TC/HDL ratio 35
Table 5.11 CRP Distribution 36
Table 5.12 Glasgow outcome scale 37
Table 5.13 Glasgow scale Rec* CRPREC 38
Table 5.14 Glasgow scale Rec* TCL Rec 39
Table 5.15 Glasgow scale Rec* HDL Rec 41
Table 5.16 Glasgow scale Rec* TC/HDL ratio Rec 42
Table 5.17 Glasgow scale and Smoking comparison 43
Table 5.18 Glasgow scale Rec* Alcohol comparison 44
Table 5.19 Glasgow scale Rec* Hypertension 45
Table 5.20 Glasgow scale Rec* CAHD 45
Table 5.21 Glasgow scale Rec* Obesity 46
Table 5.22 Glasgow scale Rec* DM 47
LIST OF FIGURES
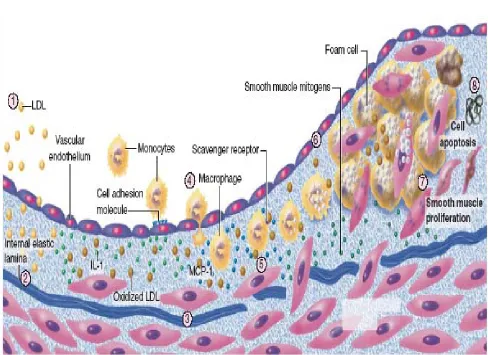
Fig 3.1 Inflammation and Atherosclerosis 10
Fig 3.2 Relative risk of future cardiovascular events 25
Fig 3.3 CRP Level and relative risk of CVD 25
Fig 5.1 CRP distribution 36
Fig 5.2 Glasgow outcome scale 37
Fig 5.3 Glasgow scale Rec* CRPRECOD 39
Fig 5.4 Glasgow scale Rec* TC 40
Fig 5.5 Glasgow scale Rec* TC ( Graph ) 40
Fig 5.6 Glasgow scale Rec* HDL Rec 41
Fig 5.7 Glasgow scale Rec* TC/HDL Rec 42
Fig 5.8 Glasgow scale Rec* TC/HDL Rec ( Graph ) 43
Fig 5.9 Glasgow scale Rec* Alcohol comparison 44
Fig 5.10 Glasgow scale Rec* CAHD 46
ABSTRACT
STUDY OBJECTIVE: To study the hs CRP level in acute ischemic stroke and its
association with short term prognosis.
DESIGN AND STUDY: Single centered, Prospective study, Thanjavur Medical
College.
PATIENTS: 52 patients admitted within 48 hours of onset of first ischemic
stroke were studied
.
STUDY PERIOD: Between February 2006 and August 2007.
RESULTS: Following results were obtained,
1. The hs CRP level is increased in all patients after acute ischemic stroke. (Mean hs CRP – 5.94 ± 1.97).
2. The hs CRP level strongly correlates with short term outcome in patients after first ever ischemic stroke. (p < 0.0005)
3. The hs CRP level is high in patients with massive infarct in CT brain.
4. The hs CRP level is increased in smokers, obesity, diabetes, hypertension and in post menopausal women.
5. The hs CRP level increases as age advances.
6. TC/HDL ratio, HDL level (<45mg/dl) strongly correlate with short term outcome after acute ischemic stroke. (p < 0.0005)
7. TC level (>200mg/dl),diabetic status(FBS>125mg/dl), strongly correlate with short term out come after acute ischemic stroke.(p=0.022)
CONCLUSION: Patients with stroke had high circulating levels of hs CRP. Short
term unfavorable prognosis seems to be associated with elevated hs CRP levels in stroke.
C
C
H
H
A
A
P
P
T
T
E
E
R
R
-
-
1
1
I
I
N
N
T
T
R
R
O
O
D
D
U
U
C
C
T
T
I
I
O
O
N
N
INTRODUCTION
Acute ischemic stroke develops as a result of sudden interruption
in the focal cerebral blood flow31,88.
The cause of the stroke is an embolic or thrombotic occlusion in
70-80% of patients with severe symptoms23,87.
Recent research has shown that an inflammatory reaction is
triggered within the hour in the brain tissue injured by an ischemic
stroke and continues in the days following the appearance of symptoms
and that this reaction contributes to neuronal damage13.
Increased CRP levels are accepted as a sensitive but non specific
marker of the acute inflammatory conditions50.
Laboratory and experimental findings have shown that
atherosclerosis is a reflection of a chronic inflammatory process in
addition to lipid deposition56,70. Inflammatory mechanisms have been
known to play a role in all stages of atherosclerosis, from initiation to
development7,52,74,75.
It has been reported that it is possible to use the increase in the
concentration of acute phase reactants and especially the high
sensitivity C- Reactive proteins (hs CRP) to help predict future
cardiovascular mortality37,52,70,73. Various prospective studies have found
initial CRP levels to be higher in persons who develop stroke, IHD,
peripheral artery disease54,60.
Among all neurological disorder of adult life, CVA clearly rank first
in frequency and importance posing a major socio economic challenge in
occupational neuro rehabilitational programmes of stroke survivors.
Identification of risk factors and its interactions with other
precursors may yield important clues concerning pathogenesis and
thereby led to stroke prevention.
Our study was done in Thanjavur Medical College that caters
C
C
H
H
A
A
P
P
T
T
E
E
R
R
-
-
2
2
A
A
I
I
M
M
O
O
F
F
T
T
H
H
E
E
S
S
T
T
U
U
D
D
Y
Y
Aim of the study
1. To determine the hs CRP level following acute ischemic
stroke and its association with short term prognosis.
2. To correlate the level of hs CRP with severity of acute
ischemic stroke.
3. To study the relationship of hs CRP level with various known
C
C
H
H
A
A
P
P
T
T
E
E
R
R
-
-
3
3
R
R
E
E
V
V
I
I
E
E
W
W
O
O
F
F
L
L
I
I
T
T
E
E
R
R
A
A
T
T
U
U
R
R
E
E
DDeeffiinniittiioonnooffSSttrrookkee
EEppiiddeemmiioollooggyy
PPaatthhoopphhyyssiioollooggyyooffSSttrrookkee
PPaatthhoopphhyyssiioollooggyyooffIIsscchheemmiiccSSttrrookkee
RRiisskkFFaaccttoorrss
IInnffllaammmmaattiioonnEEnnddootthheelliiaallddyyssffuunnccttiioonnaanndd
A
Atthheerrooggeenneessiiss
RRiisskkffaaccttoorrssaannddmmeecchhaanniissmmooffiinnjjuurryy
CCRRPPaassaapprreeddiiccttoorrooffssttrrookkeerriisskk
Review Of Literature
3.1 DEFINITION OF STROKE:
Stroke by definition is a syndrome of rapidly developing clinical
signs of focal disturbance of cerebral function with symptoms lasting 24 hours
or longer or leading to death with no apparent cause other than vascular
origin.
3.2 EPIDEMIOLOGY:
3.2.1 WORLD:
Each year stroke affects 15,000,000 people worldwide, two thirds
of whom die or are left permanently disabled [40]. In 1990 more than
38,000,000 disability adjusted life years were lost worldwide due to stroke;
this disease burden is projected to increase to 61,000,000 disability adjusted
life years by 2020.
3.2.2 INDIA:
Based on retrospective analyses of subjects admitted in urban
hospitals in India it was found that stroke constitutes nearly 2% of all hospital
cases and 20% of neurological admissions.
3.3 PATHOPHYSIOLOGY OF STROKE:
One of the three mechanisms is usual.
(1) Arterial embolism from distant site usually the carotid, vertebral or
basilar arteries and subsequent brain infarction.
(2) Arterial thrombosis causing occlusion in atheromatous carotid, vertebral
artery with subsequent brain infarction.
(3) Hemorrhage into the brain (intracerebral or subarachnoid).
Less commonly,
• Venous infarction
• Carotid or vertebral artery dissection
• Polycythemia
• Fat and air embolism
• Multiple sclerosis
• Mass lesions
• Very rarely arteritis, neurosyphilis, SLE, and mitochondrial
3.4 PATHOPHYSIOLOGY OF ISCHEMIC STROKE:
A fall in cerebral blood flow to zero causes death of brain tissue within
4-10 min.
CBF <16 to 18 ml/100gm tissue per min cause infarction within an
hour. Values <20 ml/100gm tissue per min cause ischemia without infarction
unless prolonged for several hours or days. There is a loss of neuronal
electrical function which is reversible stage.
When blood flow decreases to 10 ml/100gm/min then aerobic
mitochondrial metabolism fails and anaerobic metabolism leads to lactic
acidosis. As a sequel to this, sodium and water reenter the cell and potassium
leaks out of the cell due to failure of energy dependant intracellular
homeostasis leading to irreversible cell death.
Based on these facts, concept of ischemic penumbra was formulated.
It is an area of brain that has reached the reversible stage of electrical failure,
but has not yet passed into irreversible stage. Thrombolytic agents are used
in this time window to salvage the ischemic penumbra zone.
3.5 RISK FACTORS
:
NON MODIFIABLE:
• Age (increases with age)
• Gender ( males > females )
• Hereditary / familial factor
• Race/ ethnicity.
MODIFIABLE RISK FACTORS:
(Table 3.1)RISK FACTOR INTERVENTION
REDUCTION IN ISCHEMIC STROKE RISK • Hypertension • Smoking • Lifestyle • Alcohol • Hypercholesterolemia • Raised haematocrit • Atrial fibrillation • Sleep apnoea • Obesity
• Diabetes
• Carotid artery stenosis
• Treat • Stop
• More active • Moderate intake • Statin therapy • Reduce
• Anticoagulate • Treat
• Wt reduction • Good control • Surgery • + + • + + • + • + • + • + • + • + • Probable • Probable • + +
3.6 INFLAMMATION, ENDOTHELIAL DYSFUNCTION
ATHEROGENESIS:
Atherogenesis is itself an inflammatory process. When endothelium
is physically challenged or becomes dysfunction , a cascade of events
precipitated initiating a cycle of injury , immunological induction and
amplification.
Causes of endothelial dysfunction include sheer stress related to
hypertension, oxidized LDL , homocysteine, and smoking . Dysfunctional
endothelium leads to increased permeability to lipoprotein and
upregulation of leucocyte and endothelial adhesion molecules.
In response to the presence of certain activating substances
including oxidized LDL , monocytic chemoattractant protein (mcp-1) ,
interleukin IL-8 and PDGF leukocytes migrate into the wall of the artery.
Induced by oxidized LDL , mcp-1 promotes diapedesis of
monocytes across the endothelium . Granulocytic macrophage
colony-stimulating factor transforms monocytes into macrophages, which
including matrix metalloproteinases and growth factors including PDGF ,
insulin like growth factor (IGF) .
These macrophages in addition to smooth muscle , activate T cells
by presenting antigens including oxidized LDL . Other trophic factors such
as IL-2 , TNF-ά, and GM-CSF cause activated Tcells to produce INF-ά,
TNF-ά, and TNF-β leading to stimulation of macrophages and further
upregulation of leukocyte adhesion molecules . This feedback amplifies
cycle of inflammation.
Regulation of adhesion molecules also is influenced by mechanical
forces. Low sheer stress upregulates expression of vascular cell adhesion
molecule (VCAM-1) , why increased sheer stress can lead to increased
gene expression of intercellular adhesion molecule (ICAM-1), VCAM-1, and
PDGF-β. ICAM-1, VCAM-1, are members of an immunoglobulin super
family whose members have both a transmembrane region and a
cytoplasmic tail. They are expressed on endothelial cells and bind to
integrins CD11a/CD18 and VLA-4 respectively. CD11a/CD18 are found in
neutrophils monocytes macrophages and lymphocytes while VLA-4 is
Platelets attach to dysfunctional endothelium, macrophages, and
expose collagen. The activated platelets release granules containing
cytokines and growth factor, causing conversion of arachidonic acid to
both thromboxane A2 leading to further platelet aggregation and leukocyte
, there by amplifying the inflammatory process. Platelets also can be
activated by PAF ( platelet activating factor ) produced by monocytes,
endothelial cells and neutrophils. PAF causes platelet aggregation and
degranulation and also promote leukocyte activation.
To summarize the process of plaque formation initiate with one or
more injurious factors. The resultant inflammatory cascade leads to
incorporation of oxidized LDL into macrophages forming foam cells,
which together with T cells, make fatty streaks. Next PDGF, TGF-β , FGF-2
act to cause smooth muscle migration to the site . Next increased activity
of specific chemokines and cytokines leads to the formation of fibrous
cap on top of necrotic core of lipid , leukocytes and debris. The continued
presence of macrophages producing metaloproteinases and other
proteolytic enzymes cause thinning of fibrous cap and priming it for
ulceration and rupture.
Importantly, the recognition of the importance of the inflammatory
rupture leading to events has redirected attention away from the focus
solely on the degree of stenosis in the arterial tree. Most acute myocardial
infarctions, for example, occur in patients with substenotic lesions.
According to the current model of atherosclerosis, initial plaque formation
is abluminal, or external to the lumen, and is angiographically silent.
Newer techniques such as intravascular ultrasound (Raggi, 2005) or
contrast-enhanced carotid MRI86 can detect abnormal and active plaque
even in the absence of stenosis.
Although established as the cause of coronary artery occlusion, and
as a possible final mechanism of extracranial carotid artery occlusion, this
ulceration/rupture is not typical of intracranial arterial occlusion38. Although
atherosclerotic lesions in different vascular beds share many
characteristics, mechanisms related to symptomatic conversion are likely
site-specific. Most stroke risk are associated with carotid stenosis.
Recent evidence implies that the risk of clinical events is related not
only to local factors within the atherosclerotic plaque, such as the state of
the necrotic core or the fibrous cap, but also to blood-borne, or systemic
factors39. Thus, circulating levels of cytokines, prothrombotic factors or
acute-phase reactants may play a role in precipitating acute stroke in the
that markers such as CD40 ligand and CRP predict progression of
atherosclerosis and risk of stroke49.
3.7 Risk factors and mechanism of injury:
3.7.1 Hypertension:
Hypertension confers a relative risk for stroke of 3- to 5-fold6. It
continues to represent a significant public health risk. Recently, even
high-normal blood pressures, 130-139/85-89 mm Hg, have been shown to be
associated with elevated cardiovascular risk84. Hypertension can result in
mechanical injury to endothelium through increased sheer stress, thereby
increasing the number of endothelial adhesion molecules, which attract
monocytes and lymphocytes.
Overactivity of the renin-angiotensin system has been implicated in
the progression of atherosclerosis. Angiotensin II, in addition to being a
potent vasoconstrictor, can lead to smooth muscle hypertrophy,
extracellular matrix production, and induction of cytokines. Expression of
angiotensin-converting enzyme (ACE) has been demonstrated in
macrophages, lymphocytes, and microvessels neighboring carotid
This suggests a role for ACE inhibitors as part of a prophylactic
regimen for stroke. One study showed that patients with vascular disease
who were treated with the ACE inhibitor ramipril had a lower stroke rate
than patients treated with placebo82 (Heart Outcomes Prevention
Evaluation Study investigators). Additionally, a substudy evaluating plaque
progression using ultrasound suggested that ramipril also may retard
atherosclerotic progression (Lonn et al, 2001).
Independent of the effects of angiotensin II, hypertension has been
shown in animals to increase formation of hydrogen peroxide and free
radicals, which in turn can increase leukocyte adhesion74,79. Thus,
additional pathophysiologic studies are needed.
3.7.2 Low-density lipoprotein:
Oxidized LDL is a relatively active form of LDL, which attracts
monocytes, increases adherence of monocytes, induces conversion of
monocytes to macrophages, and decreases the motility of macrophages.
While native LDL cannot be incorporated into a macrophage or smooth
muscle cell, oxidized LDL can be taken up by scavenger receptor A (SRA),
the entry rate of LDL into the intima. Serum high-density lipoprotein (HDL)
exerts a protective effect by deterring LDL peroxidation.
Macrophages, smooth muscle cells, and endothelial cells can oxidize
LDL. This leads to a spectrum of variably oxidized LDLs with a
heterogeneity of deleterious effects. In culture, oxidized LDL is toxic to
endothelial cells. Studies have shown the presence of oxidized LDL at sites
of inflammation, raising a potential mechanism by which areas of
inflammation may promote atherogenesis at remote sites.
Several studies support a role for beta-hydroxy beta-methylglutaryl
coenzyme A (HMG-CoA) reductase inhibitors (ie, statins) in slowing the
progression of intima media thickness, a frequently used surrogate for
carotid atherosclerosis22 (Crouse, 1995). Lowering of LDL has also been
associated with reduction in plaque progression in studies using
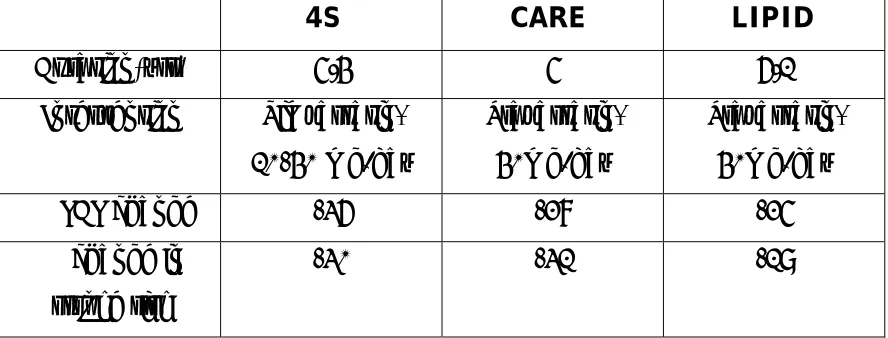
Table 3.2 – Secondary Prevention Trials of Statin Therapy
4S CARE LIPID
Duration(yrs) 5.4 5 6.1
Intervention Simvastatin, 10-40 mg/day
Pravastatin, 40mg/day
Pravastatin, 40mg/day
% LDL change -36 -28 -25
% change in stroke risk
-30 -31 -19
3.7.3 Diabetes mellitus :
Diabetes mellitus (DM) increases stroke risk by 1.5- to 3-fold. Not
only does DM increase the risk of stroke, it also increases the rate of
mortality from stroke. DM accelerates atherosclerosis and induces both
microangiopathic changes and large-vessel atherosclerosis. Long-standing
DM is associated with endothelial dysfunction, including reduction in
endothelium-mediated vasodilator production. Additionally, acute
hyperglycemia has been demonstrated to impair cerebrovascular reactivity
mediated, at least in part, by endothelial production of nitric oxide and
3.7.4 Smoking :
Smoking represents a significant and modifiable risk factor. It
almost doubles the risk of stroke. This is thought to occur by multiple
mechanisms. Smoking leads to decreased arterial wall compliance,
increased platelet aggregation, increased fibrinogen levels, and decreased
HDL cholesterol levels.
A small study recently showed that smokers had lower production
of endogenous tissue plasminogen activator (tPA) antigen induced by
substance P infusion, suggesting an impairment of endogenous fibrinolysis
in smokers (46).Endogenous tPA can be released by endothelial cells to
lyse subclinical clots, which may exist on denuded areas on the surface of
atherosclerotic plaques.
3.7.5 INFECTION :
In light of the increasing acceptance of atherosclerosis as a chronic
inflammatory disease, it has been hypothesized that acute and chronic
infections may play a role in vascular disease. Increased leukocyte counts
are associated in observational studies with carotid thickness17 and aortic
arch plaque thickness19 in some populations as well as with clinical
repeatedly over time, evidence suggested that those patients who had
recurrent clinical events were more likely to have had recent elevations in
their leukocyte counts26. These findings indirectly implicate infection in the
pathogenesis of plaque formation and stroke risk.
Several studies provide evidence that patients with stroke are more
likely than control subjects to have had an upper respiratory infection
within the previous 2 weeks25 (Bova, 1996). This suggests a plausible role
for infection in the conversion of an asymptomatic to a symptomatic
plaque.
3.7.6 Chlamydia :
C pneumoniae is the infectious pathogen that has been most
extensively studied in relation to atherosclerosis and stroke. The presence
of C pneumoniae in the intima, media, macrophages, and smooth muscle
of some carotid endarterectomy specimens is evident. Detection of C
pneumoniae in serum, however, correlates poorly with its detection in
carotid plaques (LaBiche, 2001).
Evidence also exists that patients with coronary disease33 and
stroke18 are significantly more likely than control subjects to have elevated
pneumoniae. However, prospective studies have not always confirmed
these findings33.
In an animal study, inoculation with C pneumoniae increases
atherosclerosis, and azithromycin attenuates this effect43.
Facilitates conversion of macrophages to foam cells; increases the
oxidation of LDL. Hypersensitivity to heat stroke proteins also play a role.
3.8 Inflammatory Biomarkers As Predictors of Stroke Risk:
♣ Of all inflammatory biomarkers C reactive protein is most
extensively studied.
3.8.1 CRP:
CRP is an acute phase reactant and a component of innate
immunity, increases in response to inflammatory stimuli and is a known
mediator of complement activity, adhesion molecule production, and
chemokine and thrombogenic factor release.
The physiological function of CRP is to induce non specific defense
In the past CRP was used only as acute phase protein with cut off
values between 0.5 and 1.0 mg / dl.
Conventional nephelometric and turbidimetric tests allow the
measurement of concentrations of 0.2 to 0.4 mg/ dl with sufficient
precision. ELISAs developed for research purposes gave the first indication
that most healthy persons have a CRP concentration far below these cut
off values and that higher values are associated with an elevated
cardiovascular risk59.
Later very sensitive commercial tests were developed using mostly
particle enhanced nephelometry or turbidiometry, where the sensitivity is
0.02 mg/ dl. These new tests are called high sensitivity C reactive protein
(hs CRP ).
CRP is produced by liver, vascular smooth muscle cells and
adipocytes. It is a stable protein not affected by freezing and thawing
cycles in large epidemiological studies. It has little diurnal variation and
The hs CRP, therefore qualifies as a good reproducible assay and
currently widely available.
But CRP is non specific. Increase in levels occur in acute infections
and inflammation such as lymphoma, lupus, giant cell arteritis, rheumatoid
arthritis, inflammatory bowel disease, osteomyelitis.
3.8.2 CRP – As a Predictor of CVD:
Increase in hs CRP levels are independent predictor of risk of
recurrent myocardial infarction, stroke, peripheral arterial disease and
sudden cardiac death3,20,66.
Studies reveal that highest quartile for CRP compared with the
lowest quartile was associated with age adjusted relative risk of first
ischemic stroke and transient ischemic stroke of 2.0 for men and 2.7 for
women75.
CRP adds to the predictive value of Framingham risk score3 and to
the vascular risk associated with the metabolic syndrome66.
CRP levels showed statistically significant positive correlations with
other established risk factors including age, number of cigarettes smoked
triglycerides, homocysteine, fibrinogen and d-dimers. CRP levels correlated
inversely with HDL – C71.
When multi variate analysis was performed to control for these
associations CRP emerged as a independent risk factor in its own right.
Hs CRP was the only inflammatory risk factor that independently
predicted risk and the inclusion of hs CRP improved the predictive ability of
the models over those containing lipid values alone ( p < 0.001 ) in several
studies. (Ridker).
The addition of CRP to other CVD risk factors increased the over all
predictive value. When CRP and TC : HDL ratio were used together, there
is improvement in risk assessment64.
The role of hs CRP and other inflammatory markers has prognostic
indicators after first stroke has been investigated in many studies15.
Hs CRP predicts mortality after stroke14,45. Elevated hs CRP levels in
patients with stroke is associated with short term unfavorable prognosis80.
Patients with the highest CRP quartile experienced reduction in MI
compared to lowest quartile on aspirin therapy. Helps to identify persons
CRP levels were reduced by lipid lowering drug PRAVASTATIN
showing that CRP is a modifiable risk factor and suggesting that an anti
[image:39.612.83.551.304.553.2]inflammatory activity may contribute to the drugs therapeutic efficacy51.
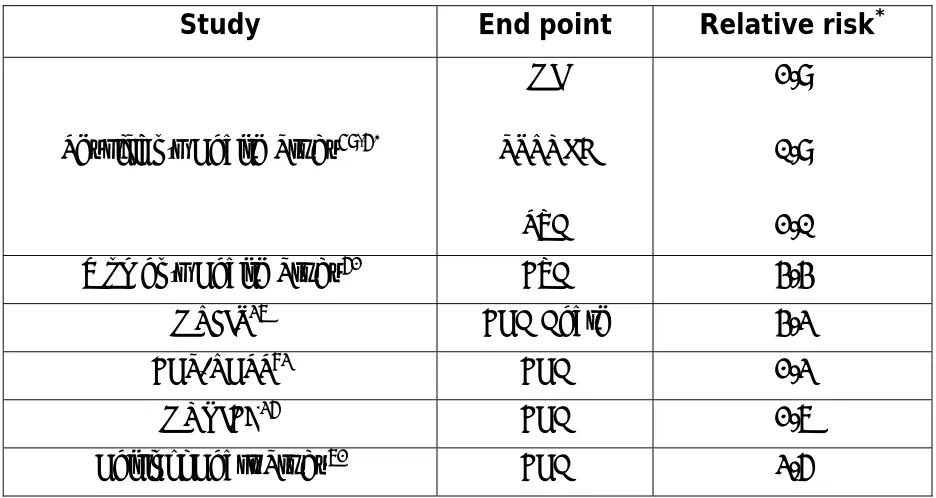
Table 3.3 Prospective studies of CRP as a Risk Factor for Future Cardiovascular
Disease:
Study End point Relative risk*
Physician’s Health Study59,60
MI
STROKE
PVD
2.9
1.9
2.1 Women’s Health Study62 CVD 4.4
MRFIT37 CHD Death 4.3
CHS/RHPP83 CHD 2.3
MONICA36 CHD 2.7
Helsinki Heart Study72 CHD 3.6
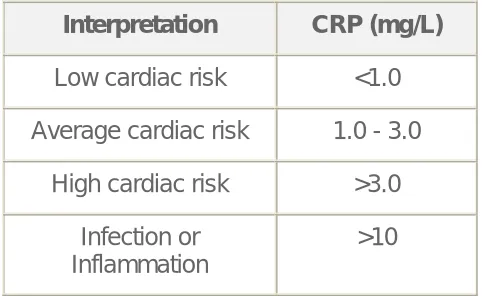
Table3.4 Reference Values of hs CRP:
Interpretation CRP (mg/L)
Low cardiac risk <1.0
Average cardiac risk 1.0 - 3.0
High cardiac risk >3.0
Infection or Inflammation
[image:40.612.186.427.167.315.2]>10
Table 3.5 ClinicalUtility of Novel Markers in CVD Risk:
Marker Assay
conditions standardized?
Prospective studies consistent?
Additive to TC and
HDL ?
Additive to Framingham
Risk ?
Lipoprotein(a) - +/- +/- -
Homocysteine + + +/- -
tPA & PAI-1 +/- + +/- -
Figure-3.2 : Relative risk of future cardiovascular events
[image:41.612.92.523.498.671.2]3.9 Stroke Scales:
Some stroke scales used to assess functional outcome are,
1. Glasgow outcome scale
2. Barthel index
3. Modified Rankin scale
4. NIH Stroke scale
5. Stroke impact scale
6. AHA Stroke out come classification
7. Scandinavian stroke scale
8. Orgogozo stroke scale
C
C
H
H
A
A
P
P
T
T
E
E
R
R
-
-
4
4
M
M
A
A
T
T
E
E
R
R
I
I
A
A
L
L
S
S
A
A
N
N
D
D
M
M
E
E
T
T
H
H
O
O
D
D
S
S
SSeettttiinngg
SSttuuddyyddeessiiggnn
SSttuuddyymmeetthhoodd
HHssCCRRPPTTeesstt
4 Materials and methods
4.1 Setting:
MEDICAL WARDS, THANJAVUR MEDICAL COLLEGE.
4.2 Study design:
This study is single centered prospective study carried out
in department of medicine of thanjavur medical college during the period
of February 2006- August 2007. Total number of patients included in
the study were 52. The detailed history regarding the risk factors like
diabetes, coronary artery disease, hypertension, hyperlipedemia, smoking,
and alcohol use were elicited from the patient. Standard approved protocol
was used for all patients.
4.2.1 Inclusion criteria:
1. Age 41-85.
2. First acute ischemic stroke were included
3. Only ischemic stroke patients confirmed by CT brain were
included.
4. Patients who got admitted within 48 hrs of stroke onset were
4.2.2 Exclusion criteria:
1. Other than ischemic stroke were excluded.
2. Patients admitted after 48 hrs of stroke onset were excluded.
3. Age less than 40 yrs and greater than 85 were excluded.
4. Patients with lymphoma, lupus, rheumatoid arthritis ,
osteomyelitis, malignancy, other connective tissue diseases
were excluded.
5. Recent infection , trauma or surgery within a month were
excluded.
6. Patients with valvular heart disease, atrial fibrillation,
thyroid disease, renal disturbance were excluded.
7. Patients with previous history of stroke , TIA , RIND were
excluded.
8. Acute myocardial infarction were excluded.
4.
3 Study Method:4.3.1 Clinical Examination:
All patients were examined for hypertension, obesity, carotid artery
thrill and bruit. A detailed cardiovascular and CNS examination were
were taken to rule out AF and valvular heart disease as well as acute MI.
BP at the time of admission were recorded and BMI were calculated .
Patients with BMI>30 were labeled as obese.
4.3.2 Investigations:
1. Hb%.
2. Total count, differential count.
3. Random blood sugar, urea , creatinine.
4. Fasting total cholesterol(TC), Fasting high density lipoprotein
cholesterol(HDL-C).
5. CT brain plain at the time of admission.
6. Hs CRP test was done within 24-48 hours of stroke onset.
4.4 Hs-CRP test:
Specimen: serum or heparinised or EDTA plasma.
Volume: 0.5 – 1.0 ml.
Storage: Refrigerate for maximum 8 days. May be frozen at
-25˚C or lower if samples are frozen within 24 hrs after collection.
Method: Nephelometric method utilizing latex particles coated with CRP monoclonal antibodies.
4.4.1 Principle of nephelometry
:
When light is passed through a turbid solution, light rays strike the
particles in the solution and change their direction of movement. This
phenomenon is called scattering. Size, concentration, and shape of
molecules altogether determine the amount of scattered light. Size and
shape determines the angle of scatter and concentration intensifies the
scattered light at the particular angle. The liquid sample is exposed to the
beam of light rays in a transparent holder. The rays get scattered and a
detector kept at right angle of the light path detects the intensity of the
rays at that angle. This is further quantified by rehearsing the phenomena
with known molecule at known concentration that is using a standard.
Polystyrene particles coated with the antibodies are agglutinated when
mixed with the samples containing the test parameter.
4.4.2 Instrument: BN-100 FROM DADE BEHRING , USA.
ADVANTAGES:
1. Fully automatic and rapid quantititative determination.
2. Fast with kinetic method. Results in few minutes.
3. Can perform 100 tests per hour.
4.5 Assessing Functional Outcome:
♣
On seventh day patients clinical and functional status were assessed using GLASGOW OUTCOME SCALE.
GlasgowOutcomeScale:
Note: The scale presented here is based on the original article by
Jennett and Bond.
SCORE DESCRIPTION
1 Death
2 Persistent vegetative state
Patient exhibits no obvious cortical function.
3 Severe Disability
(Conscious but disabled). Patient depends upon others for daily support due to mental or physical disability or both
4 Moderate Disability
(Disabled but independent). Patient is independent as far as daily life is concerned. The disabilities found include varying degrees of dysphasia, hemiparesis, or ataxia, as well as intellectual and memory deficits and personality changes.
5 Good Recovery
Resumption of normal activities even though there may be minor neurological or psychological deficits.
References
C
C
H
H
A
A
P
P
T
T
E
E
R
R
-
-
5
5
R
R
E
E
S
S
U
U
L
L
T
T
S
S
A
A
N
N
D
D
O
O
B
B
S
S
E
E
R
R
V
V
A
A
T
T
I
I
O
O
N
N
S
S
Results and observation
5.1 Age:
Patients of age > 40 yrs and < 85 yrs were included in this
study.
• Total no of patients – 52
• Mean age of patients – 60.3 yrs
• Standard deviation – 10.5 yrs
• Range – 37
• Maximum age – 80 yrs
• Minimum age – 43 yrs
[image:50.612.111.500.576.664.2]5.2 Frequency tables:
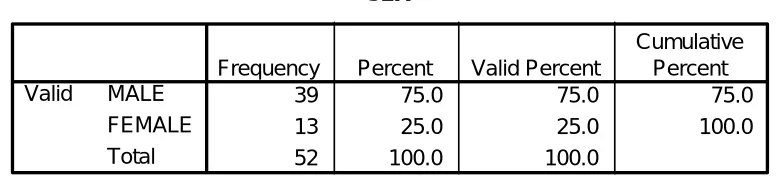
Table 5.1 : Sex
SEX
39 75.0 75.0 75.0
13 25.0 25.0 100.0
52 100.0 100.0
MALE FEMALE Total Valid
Frequency Percent Valid Percent
Cumulative Percent
Table 5.2 : Smoking
SMOKING
30 57.7 57.7 57.7
22 42.3 42.3 100.0
52 100.0 100.0
YES NO Total Valid
Frequency Percent Valid Percent
Cumulative Percent
[image:51.612.127.487.329.423.2]• 57.7 % of this study group were smokers who smokes more than one packet per day
Table 5.3 : Alcohol
ALCOHOL
8 15.4 15.4 15.4
44 84.6 84.6 100.0
52 100.0 100.0
YES NO Total Valid
Frequency Percent Valid Percent
Cumulative Percent
• Those who take more than three drinks per day were included.
• 15% of patients were alcoholics.
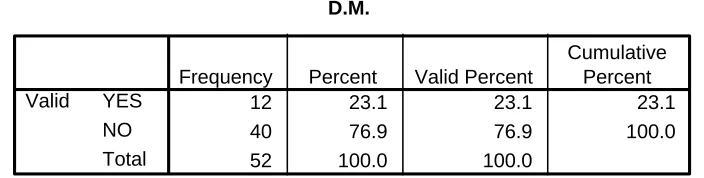
Table 5.4 : Diabetes mellitus
D.M.
12 23.1 23.1 23.1
40 76.9 76.9 100.0
52 100.0 100.0
YES NO Total Valid
Frequency Percent Valid Percent
Cumulative Percent
[image:51.612.130.482.559.648.2]Table 5.5 : Hypertension
H.T
30 57.7 57.7 57.7
22 42.3 42.3 100.0
52 100.0 100.0
YES NO Total Valid
Frequency Percent Valid Percent
Cumulative Percent
• Patients who had BP> 140/90 at the time of admission were included.
[image:52.612.123.486.349.441.2]• 57.7% found to have high BP.
Table 5.6 : CAHD
CAHD
4 7.7 7.7 7.7
48 92.3 92.3 100.0
52 100.0 100.0
YES NO Total Valid
Frequency Percent Valid Percent
Cumulative Percent
• Only 8% had previous history of CAHD.
Table 5.7 : Obesity
OBESITY
5 9.6 9.6 9.6
47 90.4 90.4 100.0
52 100.0 100.0
YES NO Total Valid
Frequency Percent Valid Percent
Cumulative Percent
[image:52.612.137.474.548.628.2]Table 5.8 : Total Cholesterol
TCL REC
37 71.2 71.2 71.2
15 28.8 28.8 100.0
52 100.0 100.0
< 200 > 200 Total Valid
Frequency Percent Valid Percent
Cumulative Percent
• 71% patients had TC<200 mg/dl.
[image:53.612.148.467.337.419.2]• Mean TC 189.6 ± 16.9 ; Median TC 190 ; Range 60
Table 5.9 : High Density Lipoprotein
HDLREC
11 21.2 21.2 21.2
41 78.8 78.8 100.0
52 100.0 100.0
> 45 <45 Total Valid
Frequency Percent Valid Percent
Cumulative Percent
• In this study only 22% had HDL >45mg/dl.
• Mean HDL 41.08 ± 3.07 ; Median HDL 41 ; Range 11
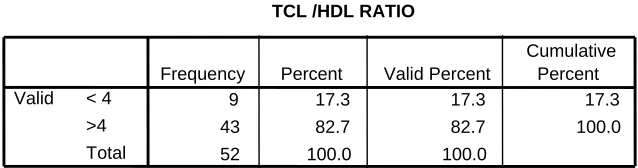
Table 5.10 : TC/HDL Ratio
• Ideally it should be less than 4.
• Mean TC/HDL 4.64 ± 0.6 ; Median TC/HDL 4.64 ; Range 2.3 • In this study only 17 % had TC/HDL < 4
TCL /HDL RATIO
9 17.3 17.3 17.3
43 82.7 82.7 100.0
52 100.0 100.0
< 4 >4 Total Valid
Frequency Percent Valid Percent
[image:53.612.138.457.538.622.2]Table 5.11 : CRP Distribution
• Mean hs CRP of all patients 5.94 ± 1.97 ; Median 6.15 ; Range 8.0 • Maximum value – 10.1mg/l ; Minimum – 2.1mg/l
CRPRECOD CRPRECOD 10-11 9-10 8-9 7-8 6-7 5-6 4-5 3-4 2-3 Frequency 14 12 10 8 6 4 2 0
Figure 5.1 : CRP Distribution
• It shows >94 % of patients had hs CRP > 3mg/l
• It shows clearly that hs CRP levels are increased in stroke
CRP DISTRIBUTION
5 9.6 9.6 9.6
5 9.6 9.6 19.2
7 13.5 13.5 32.7
7 13.5 13.5 46.2
13 25.0 25.0 71.2
7 13.5 13.5 84.6
4 7.7 7.7 92.3
3 5.8 5.8 98.1
1 1.9 1.9 100.0
52 100.0 100.0
2-3 3-4 4-5 5-6 6-7 7-8 8-9 9-10 10-11 Total Valid
Frequency Percent Valid Percent
Table 5.12 : Glasgow Outcome Scale
• 70 % had poor prognosis
• 7.7 % mortality was noted in these patients • Only 30 % had good recovery
GLASGOW SCALE REC
GLASGOW SCALE REC
MILD/ GOOD VEG / SEVERE DIS
DEATH
Frequency
40
30
20
10
0
Figure 5.2 : Glasgow Outcome Scale
• Patients with score of 2 and 3 were unable to walk • Patients with score of 4 and 5 were able to walk
GLASGOW SCALE REC
4 7.7 7.7 7.7
32 61.5 61.5 69.2
16 30.8 30.8 100.0
52 100.0 100.0
DEATH
VEG / SEVERE DIS MILD/ GOOD Total
Valid
Frequency Percent Valid Percent
5.3 RISK FACTOR COMPARISON WITH GLASGOW OUTCOME SCALE :
[image:56.612.91.592.234.293.2]5.3.1 Hs CRP level and functional outcome
:
Table 5.13 : GLASGOW SCALE REC * CRPRECOD
Crosstab
Count
1 2 1 4
3 4 13 7 4 1 32
5 5 4 2 16
5 5 7 7 13 7 4 3 1 52
DEATH
VEG / SEVERE DIS MILD/ GOOD GLASGOW
SCALE REC
Total
2-3 3-4 4-5 5-6 6-7 7-8 8-9 9-10 10-11
CRPRECOD
Total
P < 0.0005 (Statistically significant)
• Mean hs CRP of all 52 patients 5.94 ± 1.96mg/l
• Mean hs CRP of all patients who died during study 8.85 ± 1.98mg/l • Mean hs CRP of all patients who were unable to walk ( patients in
GOS score of 2 and 3 ) is 6.68 ± 1.1mg/l
• Mean hs CRP of patients who were able to walk ( patients in GOS score of 4 and 5 ) is 3.73 ± 1.1mg/l
• Total no of patients who had massive infarct in CT Brain – 9 • Mean hs CRP who had massive infarct is 8.7 ± 0.96mg/l • Total no of patients who had lacunar infarct – 10
• Mean hs CRP of patients who had lacunar infarct is 3.27 ± 0.93mg/l • Applying chi square test for association between hs CRP levels and
GOS, p < 0.0005 which is statistically significant
GLASGOW SCALE REC
MILD/ GOOD VEG / SEVERE DIS
DEATH
Mean CRP
10
9
8
7
6
5
4
3
Figure 5.3 : GLASGOW SCALE REC * CRPRECOD
• Above graph shows when hs CRP increases, worse is the prognosis.
5.3.2 Total cholesterol and functional outcome:
Table 5.14 : GLASGOW SCALE REC * TCL REC
Crosstab
Count
1 3 4
21 11 32
15 1 16
37 15 52
DEATH
VEG / SEVERE DIS MILD/ GOOD GLASGOW
SCALE REC
Total
< 200 > 200 TCL REC
Total
GLASGOW SCALE REC
MILD/ GOOD VEG / SEVERE DIS
DEATH
Count
30
20
10
0
TCL REC
< 200
> 200
Figure 5.4 : Glasgow Scale REC*TC
GLASGOW SCALE REC
MILD/ GOOD VEG / SEVERE DIS
DEATH
Mean TOTAL CHOLESTROL
210
200
190
180
[image:58.612.178.435.79.524.2]170
Figure 5.5 : Glasgow Scale REC*TC(Graph)
• 75 % of patients who died had TC > 200mg/dl
5.3.3 HDL and functional outcome :
Table 5.15 : GLASGOW SCALE REC * HDLREC
Crosstab
Count
1 3 4
1 31 32
9 7 16
11 41 52
DEATH
VEG / SEVERE DIS MILD/ GOOD GLASGOW
SCALE REC
Total
> 45 <45 HDLREC
Total
P < 0.0005 ( Statistically significant )
GLASGOW SCALE REC
MILD/ GOOD VEG / SEVERE DIS
DEATH
Count
40
30
20
10
0
HDLREC
> 45
<45
Figure 5.6 : Glasgow Scale REC* HDL REC
• 56 % of patients who were able to walk had HDL > 45mg/dl
• Only 3 % of patients who were unable to walk had HDL > 45mg/dl. • Applying chi square test p < 0.0005 statistically significant.
5.3.4 TC/HDL and functional outcome :
Table 5.16 : GLASGOW SCALE REC * TCL / HDL RATIO REC
Crosstab
Count
4 4
1 31 32
8 8 16
9 43 52
DEATH
VEG / SEVERE DIS MILD/ GOOD GLASGOW
SCALE REC
Total
< 4 >4 TCL / HDL RATIO REC
Total
P < 0.0005 (Statistically significant)
GLASGOW SCALE REC
MILD/ GOOD VEG / SEVERE DIS
DEATH
Count
40
30
20
10
0
RATIO REC
< 4
>4
Figure 5.7 : GLASGOW SCALE REC * TCL / HDL RATIO REC
• All the patients who died had TC/HDL > 4.
GLASGOW SCALE REC
MILD/ GOOD VEG / SEVERE DIS
DEATH
Mean TC/HDL
5.2
5.0
4.8
4.6
4.4
4.2
4.0
3.8
Figure 5.8 : GLASGOW SCALE REC * TCL / HDL RATIO REC(Graph)
• As TC/HDL ratio increases, worse is the outcome
5.3.5 Smoking and functional outcome:
Table 5.17 : GLASGOW SCALE AND SMOKING COMPARISION
Crosstab
Count
3 1 4
15 17 32
12 4 16
30 22 52
DEATH
VEG / SEVERE DIS MILD/ GOOD GLASGOW
SCALE REC
Total
YES NO
SMOKING
Total
p > 0.05 ( NOT SIGNIFICANT)
• Applying chisquare p>0.05, stastistically not significant.
5.3.6 Alcohol and functional outcome:
Table 5.18 : GLASGOW SCALE REC * ALCOHOL COMPARISION
Crosstab
Count
4 4
6 26 32
2 14 16
8 44 52
DEATH
VEG / SEVERE DIS MILD/ GOOD GLASGOW
SCALE REC
Total
YES NO
ALCOHOL
Total
p > 0.05 ( NOT SIGNIFICANT)
GLASGOW SCALE REC
MILD/ GOOD VEG / SEVERE DIS
DEATH
Count
30
20
10
0
ALCOHOL
YES
NO
Figure 5.9 : GLASGOW SCALE REC * ALCOHOL COMPARISION
5.3.7 HT and functional outcome:
Table 5.19 : GLASGOW SCALE REC * H.T
Crosstab
Count
4 4
20 12 32
6 10 16
30 22 52
DEATH
VEG / SEVERE DIS MILD/ GOOD GLASGOW SCALE REC Total YES NO H.T Total
p > 0.05 ( NOT SIGNIFICANT)
• Hypertension not associated with short term outcome in this study.
5.3.8 CAHD and functional outcome:
Table 5.20 : GLASGOW SCALE REC * CAHD
Crosstab
Count
1 3 4
3 29 32
16 16
4 48 52
DEATH
VEG / SEVERE DIS MILD/ GOOD GLASGOW SCALE REC Total YES NO CAHD Total
[image:63.612.145.468.528.609.2]GLASGOW SCALE REC
MILD/ GOOD VEG / SEVERE DIS
DEATH
Count
40
30
20
10
0
CAHD
YES
NO
Figure 5.10 : GLASGOW SCALE REC * CAHD
[image:64.612.187.438.76.284.2]5.3.9 Obesity and functional outcome:
Table 5.21 : GLASGOW SCALE REC * OBESITY
Crosstab
Count
1 3 4
4 28 32
16 16
5 47 52
DEATH
VEG / SEVERE DIS MILD/ GOOD GLASGOW
SCALE REC
Total
YES NO
OBESITY
Total
5.3.10 DM and functional outcome:
Table 5.22 : GLASGOW SCALE REC * D.M. COMPARISION
Crosstab
Count
2 2 4
10 22 32
16 16
12 40 52
DEATH
VEG / SEVERE DIS MILD/ GOOD GLASGOW
SCALE REC
Total
YES NO
D.M.
Total
P = 0.022 ( Statistically significant)
GLASGOW SCALE REC
MILD/ GOOD VEG / SEVERE DIS
DEATH
Count
30
20
10
0
D.M.
YES
NO
Figure 5.11 : GLASGOW SCALE REC * D.M. COMPARISION
• 50% Patients died were alcoholic .
• Applying chi square test p<0.022, statistically significant.
• So diabetes influences outcome in stroke patients.
5.4 Comparison of Hs CRP with other Known risk factors :
5.4.1 Hs CRP with age:
Mean hs-CRP of all patients: 5.94mg/l.
No of pts in age group 40-50: 10
Mean hs-CRP of pts in age group 40-50: 4.72 mg/l.
No of pts in age group 50-60: 22
Mean hs-CRP of pts in age group 50-60: 5.7 mg/l.
No of pts in age group 60-70: 11
Mean hs-CRP of pts in age group 60-70: 6.56mg/l
No of pts in age group 70-80: 4.
Mean hs-CRP of pts in age group 70-80: 7.12mg/l.
5.4.2 Hs CRP with GENDER:
Mean hs-CRP of all patients: 5.94mg/l.
Mean hs- CRP of men: 5.65mg/l.
Mean hs- CRP of women: 6.38mg/l.
( all are post menopausal)
5.4.3 Hs CRP with SMOKING:
Mean hs- CRP of men: 5.65mg/l.
Mean hs- CRP of men who were smokers: 5.85mg/l.
5.4.4 Hs CRP with DM:
Mean hs- CRP of pts who were diabetic: 7.73mg/l.
Mean hs- CRP of pts who were non-diabetic: 5.4 mg/l.
5.4.5 Hs CRP with HT:
Mean hs- CRP of pts who were hypertensive: 6.65mg/l.
Mean hs- CRP of pts who were not hypertensive: 4.98mg/l.
5.4.6 Hs CRP with CAHD
:
Mean hs- CRP of pts with h/o CAHD: 8.45mg/l.
Mean hs- CRP of pts without h/o CAHD: 5.73mg/l.
5.4.7 Hs CRP with OBESITY:
Mean hs- CRP of pts with BMI>30: 8.18mg/l.
Mean hs- CRP of pts with BMI<30: 5.72 mg/l.
5.4.8 Hs CRP with alcohol:
Mean hs- CRP of pts who were alcoholic: 6.79mg/l.
C
C
H
H
A
A
P
P
T
T
E
E
R
R
-
-
6
6
D
D
I
I
S
S
C
C
U
U
S
S
S
S
I
I
O
O
N
N
DISCUSSION
Total no of patients in this study was 52. Hs CRP estimate was
done on all patients on the second day after the onset of stroke ie, within
24 to 48 hrs after onset of stroke.
Various known risk factors of stroke like age, sex, diabetes,
hypertension, smoking, alcohol, total cholesterol level, HDL level, TC/HDL
ratio were compared with hs CRP level. Functional outcome after stroke is
analysed with hs CRP level and other risk factors.
6.1 AGE:
Of the 52 patients, 10 were in the age group of 40 to 50 yrs, and
22 were in age group of 50 to 60 yrs, 11 were in 60 to 70 yrs and 4
patients were in age group of 70 to 80 yrs.
The mean hs CRP level in each group in ascending order were
4.72mg/l, 5.7mg/l, 6.56mg/l and 7.12mg/l. Thus a gradual increase in hs
This correlates with study by M.A.Mendal et al41, Praful patel et al,
that there is an elevation in hs CRP as age advances. Another study by Seishi
yamada et al77 in Japanese population also confirmed this observation. In the
study by Nakogmi et al1 that in elderly patients there is increase in hs CRP
level which in turn increase the production of tissue factor by monocytes. The
monocyte tissue factor production is increased by several folds in elderly
patients. This tissue factor is responsible for activation of extrinsic coagulation
cascade leading to thrombus formation and cardiovascular events in elderly
population.
6.2 GENDER:
In this study 39 were male (75 %) and 13 were female (25 %).
The mean hs CRP level in male was 5.65mg/l and female was 6.38mg/l.
In a study by Nakagomi et al1 showed that as age advances the hs
CRP level gradually rises. The hs CRP levels of women of post menopausal
age were significantly greater than values in men of similar age group.
Since all the female patients in this study were postmenopausal the mean
6.3 SMOKING:
There were 39 men in this study, out of them 30 were smokers who
used to smoke greater than 10 cigarettes per day for several years.
Mean hs CRP of the men who smokes was 5.85mg/l and non
smokers was 5mg/l.
In a study by Haverkate et al, the elevation of CRP level in smokers
is about 50% more than that of non smokers. Study by
Timo.E.Strandberg81 confirmed hs CRP elevation in smokers.
The main mechanism for this elevation may be the increase in
inflammation in vessel wall which causes CRP elevation and there by
increase in atherosclerosis progression.
In this study there is no strong relationship between smoking and
short term prognosis. No study was done previously to find out association