Needs Assessment of the Elderly People in a
Rural Community in Coimbatore
A Dissertation Submitted to the Tamilnadu Dr. MGR Medical
University, Chennai in Partial Fulfillment of Requirement for the
Degree of M.D. in Community Medicine (Branch XV)
2006
By
Dr. T. Ashokkumar
Guide
Dr. Thomas V Chacko M.D
Department of Community Medicine
Needs Assessment of the Elderly People in a
Rural Community in Coimbatore
A Dissertation Submitted to the Tamilnadu Dr. MGR Medical
University, Chennai in Partial Fulfillment of Requirement for the
Degree of M.D. in Community Medicine (Branch XV)
2006
By
Dr. T. Ashokkumar
Guide
Dr. Thomas V Chacko M.D
Department of Community Medicine
CERTIFICATE
This is to certify that the dissertation entitled “Needs Assessment of the Elderly People in a Rural Community in Coimbatore” is the bonafide work of Dr. T. Ashokkumar, in the Department of Community Medicine, PSG Institute of Medical Sciences and Research, Peelamedu, Coimbatore, in partial fulfillment of requirement for the Degree of M.D. in Community Medicine from the Tamilnadu Dr. MGR Medical University, Chennai.
Prof. Dr. Thomas V Chacko Dr.N. Radhakrishnan
Guide & H.O.D Principal
Department of Community Medicine
PSG INSTITUTE OF MEDICAL SCIENCES AND RESEARCH COIMBATORE
ACKNOWLEDGEMENT
I wish to express my deep sense of gratitude to my guide Dr. Thomas. V Chacko, Professor and HOD, Department of community medicine, for his valuable guidance, continuous encouragement and support with personal interest which made my dissertation to see the light of the day.
I am extremely obliged to Dr. Subramaniyan, Professor, for his generous contribution, thoughtful suggestions and judgment.
I express my heartfelt gratitude to Dr. S.L. Ravishankar, Professor, whose thoughts, ideas, suggestions and constant encouragement were instrumental in the completion of the study.
I am very much thankful to Dr. Anil C Mathew, Associate professor in Biostatistics, for teaching me statistical methods.
I express my sincere thanks to Dr. R. Rajkumar, Associate Professor, for his consistent help and blessings.
I wish to express my special thanks to Dr. Y.S. Sivan, Senior Lecturer, for his valuable suggestions throughout the study.
I express my heartfelt thanks to Dr. K.S. Sudha, PG Student, for her valuable suggestions and inputs for improvement.
I wish to extend my gratitude to all Assistant professors, Dr. Shakila Rani, and all staff in my department for their continuous encouragement and support at every stage of the study.
I am grateful for the support extended by the field staff of Vedapatti, RHC, for their help during data collection.
Table of Contents
Content
Page No
1. Introduction 1
2. Objectives 9
3. Review of Literature 10
4. Materials and Methods 24
5. Operational Definitions 31
6. Results 33
7. Discussion 48
8. Summary 57
9. Recommendations 59
10. Reference 11. Annexure
I. Survey questionnaire - Background details
II. Survey questionnaire - A. Stanford Health Assessment Questionnaire
B. Flow Chart to Assess Unmet Needs III. Survey questionnaire - Camberwell Assessment of Need for
the Elderly (CANE)
Abbreviations used in this document
ADL
-
Activities of Daily Living
CANE
-
Camberwell Assessment of Need for the Elderly
C.I.
-
Confidence Interval
DI
- Disability Index
HAQ
-
Health Assessment Questionnaire
IADL
-
Instrumental Activities of Daily Living
NGO
-
Non Governmental Organization
NOAPS
-
National Old Age Pension Scheme
OR
-
Odds Ratio
PPS
-
Probability Proportional to Size
SPSS
-
Statistical Package for the Social Sciences
UN
-
United Nations
List of Tables and Figures
1. Tables
Table Number Title Page number
I.A Village wise distribution of elderly people 33
I.B Age - sex distribution of the study population 34
I.C Marital Status of the elderly 34
I.D Educational Status of the Elderly 35
I.E Living Arrangements 36
I.F Distribution of elderly by Financial Status 36
II.A Sex-wise distribution of physical disabilities 37
III.C Age-wise distribution of physical disabilities 38
III.A Morbidity profile of the elderly 39
III.B Morbidity load among the elderly 40
IV.A Needs - Unmet and Met needs in physical
IV.B Distribution of unmet needs in physical disabilities 42 among males and females
V Distribution of Needs among the elderly as assessed by 43-44 Camberwell Assessment of Need for the Elderly
VI Predictors of Unmet Needs in Physical Disabilities 45-46
2. Figures
Number Title
1. Distribution of villages within the catchment area of facing 24 proposed Day Care Centre
1. INTRODUCTION
All over the world the life expectation of people is increasing. Population ageing is the result of demographic transition with reduction in fertility leading to decline in the proportion of young in the population and at the same time there is increasing longevity. It indicates the triumph of public health and advancement of medical technology; this demographic transition is under way throughout the world. Unfortunately, the rapidity of population ageing is expected to continue to outpace social and economical development in developing countries particularly in countries like India.
Today, worldwide, there are some 600 million persons aged 60 and over; this total will double by 2025 and will reach virtually two billion by 2050 when there will be more people aged 60 and over than children under the age of 15.1
From a mere 5.1% in 1901, the elderly will become 21% of the population by the year 2050, estimates a United Nations projection. Most of them will be living in developing countries which are often least prepared to meet the challenges of rapidly ageing societies. In other words WHO says “Developing countries will become old before they become rich while industrialized countries became rich
Problems of the Elderly
There are plenty of health and social problems that have been addressed by different authors all over the world. The major health problems of older people are chronic, non-communicable diseases and disabilities. Any strategy designed to improve the health of older people requires a firm understanding of the factors that contribute to the development of these diseases. The health of the elderly is not only affected by medical determinants but also affected by their behaviour and by the wider environment in which they live. Values, beliefs and traditions play a central role in the health behaviour of older people and in the opportunities available to them to adopt healthy modes of behaviour.
Old age is not a disease by itself, but the elderly are vulnerable to long term diseases of insidious onset such as cardiovascular illness, cerebrovascular accidents, cancers, diabetes, musculoskeletal and mental illnesses. They have multiple symptoms due to decline in the functioning of various body functions and abilities.
health: the poorer people are, the more likely they are to suffer from ill-health – at any stage in the life course, including later life. It has been shown that older people in poverty have a much lower level of functioning than those who are financially well off. Poverty has especially important implications for health in later life. Poverty throughout the life course has a cumulative effect, whereby many of the impacts are especially evident in later life. Furthermore, poverty is more common among older people and this means that the capacity of older people to deal with health problems is more pronounced than among younger age groups. Social position also affects health because it is linked with social isolation, disempowerment and a loss of control over one’s life. The less people feel in control of their own life and future, the less likely they are to engage in health-promoting behaviour. These two factors, poverty and disempowerment, affect health through a variety of means.
In this context, Health being a fundamental human right, our goal should not
be solely to extend lives in the physical sense, but to ensure that the added years
are worth living with diminishing handicaps and disabilities, and with a greater
degree of health security.
The Elderly in India
mortality rates accompanied by an improvement in child survival and increased life expectancy, the major impact of demographic changes is population ageing i.e progressive increase in the number of elderly persons. In France, it took 120 years for the grey population to double from 7 % to 14 %. But in India, the grey population has doubled in 25 years!
The Indian aged population is currently the second largest in the world, next to China. The absolute number of the over 60 population in India will increase from 76.6 million in 2001 to 137 million by 2021. From 5.4 percent in 1951, the proportion of 60 years and above people grew to 6.4 per cent in 1981 and 7.8 per cent in 2001. The decadal percent growth in the elderly population for the period 1991-2001 would be close to 40, more than double the rate of increase for the general population.
Societal Implications on Ageing
a. The Family
female-headed households and dual earner families disrupted the traditional family norms. The community used to play a major role in the caring for aged by reinforcing the ability of the family to offer a caring environment. As a result of urbanization there is increasing lack of community support for elderly, which was in practice in the past. These factors have contributed to the deteriorated care system of the aged in India.
b. Care Services for Older Persons in Our Country
Government has taken various policies in favour of older persons. Various health care services are made available for elderly. Non-Governmental organizations such as Help Age India, Association of care of the aged, Hyderabad, Age-Care India, New Delhi, Geriatric Society of India, Lady Harding Medical College, New Delhi and Association of Gerontology (India), S.V. University, Tirupathi are playing a significant role by providing the following services
• Geriatric Out Patient Care.
• Mobile Medicare Units - Health Care at their door step.
• Day Care Centres.
Available Social Security Systems for the elderly2
Under standardized economic security policies, government is covering retirement benefits for those in the organized sector, some of them are,
i ) Old Age Pension for the General Public
National Old Age Pension Scheme (NOAPS) Old Age Pension Scheme in different States Senior Citizens Saving Scheme
(ii) Social Security Scheme for Unorganized Sector (iii) Annapurna
(iv) Post Retirement Benefits
a) Pension
Central Government Employees
Employees permanently absorbed in Public Sector undertakings/autonomous bodies (b) Family Pension
Central Government Employees
Employees permanently absorbed in Public Sector undertakings/autonomous bodies
(c) Gratuity
e) Central Government Employees Group Insurance Scheme (f ) General Provident Fund
Other available Social security system provided by NGOs like Help Age India (Advocacy etc..)
Most of these Social Security Systems are for the Organized Sectors especially living in rural areas, Help age India3 says 90% of older persons are from the unorganized sector, with no social security at the age of 60.
They also highlighted the following,
30% of older persons live below the poverty line and another 33% just marginally over it.
73% are illiterate, and can only be engaged in physical labor.
55% of women over 60 years are widows, many of them with no support whatsoever
80% live in rural areas.
The Need for a Needs Assessment Study.
Numerous attempts have been made in India over the last few years to estimate the number of elderly who are disabled,4,5. Very few studies6, however, have been done to assess the extent to which those who are disabled go without the assistance they need. Similarly very few have studied the expectations of elderly and those that did, did not cover all the needs of the elderly.
“PREVENTION IS BETTER THAN CURE” and so to be prepared for
providing services to the elderly in the community, we need to know the needs and problems (Health and social) of older people. By establishing their needs and problems, we can be better prepared to tackle the health and social problems among the elderly.
Apart from assessing needs and unmet needs of elderly, it is important to identify the target elders who need the service the most (predictors of unmet need) in order to provide the home based and community care services so that we can
2. OBJECTIVES
1.
To assess the extent of physical disabilities, the morbidity
load and unmet needs in physical disabilities for care of
elderly in a rural community.
2. To identify the predictors of unmet needs in physical
disabilities of elderly so that they can act as surrogate
3. REVIEW OF LITERATURE
“Ageing is definitely no longer a first world issue. What was a footnote in the 20th
century is on its way to becoming a dominant theme in the 21st. (Kofi Annan, UN
Secretary General)”1
Ageing is a privilege and a societal achievement. It is also a challenge, which will have an impact on all aspects of 21st century society. It is a challenge that can not be addressed by the public or private sectors in isolation: it requires joint approaches and strategies. The major health problems of older people are chronic non-communicable diseases and disabilities. Any strategy designed to improve the health of older people requires a firm understanding of the factors (chronic diseases, disabilities) that contribute to the development of these diseases.
The UN defines a country as ‘ageing’ where the proportion of people over 60 reaches 7 per cent. In India, currently 7.8% of the population are elderly and it is expected that this will reach 12.6% in 2025.11
important thing is not whether a disease is caused by intrinsic or extrinsic ageing but whether a health condition is preventable, or at least treatable. Health promotion and disease prevention programmes can only be directed at preventable conditions. It is the role of research scientists to discover the causes of diseases and whether or not they can be treated or prevented.
Measurement of ADL and IADL disability and unmet need for Home and Community Based Services:
Increased health services utilization and long term care needs arise when one or a combination of disease process and physical performance limitations such as bathing, walking etc cause long term or permanent loss of independent function. “Needs” become “unmet” when assistance from other person or special devices or equipment are unavailable or inadequate.18
Most commonly used measures of disability and need are based on subjective reporting of these items, which measure the ability to perform routine task of daily living.
There are many ways to measure functional performance limitations. The most common method used among elderly are to assess activities of daily living (ADLs) and Instrumental activities of daily living (IADLs).18 While the former attempts to measure physical ability to carryout everyday living tasks, the latter measures ability to carryout household management functions.
Tools to assess the physical abilities of elderly:
There are different tools to assess the physical abilities. The important tools being, Katz ADL Scale19 and Lawton IADL Scale.20 These tools can assess either ADL or IADL but not both. Comprehensive Assessment and Referral Evaluation (CARE)21 is a semi structured, multi dimensional interview guide to assess the community resident elderly with a primary focus on psychiatric assessment. It also covers medical, nutritional, and other problems of elderly. In 1981, The WHO has presented an International Classification of Impairment, Disability, and Handicap (ICIDH) and subsequently revised in 2001 to make further explorations in relationship between functioning, disability and health (International Classification of Functioning, Disability, and Health (ICF), WHO, 2001). 22
The newly introduced Stanford health assessment questionnaire26 has five domains, “the 5 ‘D’s” namely, Disability, Discomfort, Drug side effects, Dollar costs and Death. The version that has received the widest attention and has been most frequently used is “the short” or 2 page Health Assessment Questionnaire (HAQ),
26
which assesses the domain of disability. This tool is used to measure physical disabilities among elderly in present study. It has been, translated and validated in Tamil by the MAPI Research Institute France,27 and measures all the dimensions of physical abilities of elderly. It has gained increased acceptability as a tool to measure physical abilities. The HAQ is usually self-administered, but can also be given face-to-face in a community and clinical setting or in a telephone interview format by trained outcome assessors, and has been validated in these settings.26
Definition of Unmet Need: - As given by the different experts
Just as there is difference of opinion on how best to identify disability, differences also exists with regard to defining unmet need.
As per the definition of Dr. Manton quoted in the article by Mary E Jackson28 the
unmet needs in ADL Disability is defined to exist if a person met one of the
following criteria:
• Does not perform the activity at all
• Receives no human assistance, does not use an assistive device, but reports needing help and two additional criteria that are ADL-specific:
• Those who report (initially) that they do not bathe at all, but later in the interview state that they take a bed/basin/sink bath are not considered as having an unmet need in bathing.
However in the same study by Mary E Jackson, 28SIM 1 and SIM 2 define
the unmet need as “an elderly who receives no human assistance, does not use an assistive device, but reports needing help”.
Jiajian Chen and Russell Wilkins et al8 in their study defined the following
Unmet needs for ADL and/or IADL
People needing ADL and/ or IADL assistance, but not receiving help or needing additional help for at least one ADL and/or IADL.
All ADL and/or IADL needs met.
Other people receiving ADL and/or IADL assistance.
The sum of these two categories also equals the population with any need for help.
Camberwell Assessment of Need for the Elderly
30The Camberwell Assessment of Need for the Elderly was published on the 30th of June, 2004. This tool covers information about needs and needs assessment for older people. It also includes the completed CANE manual for the full version and short version of the instrument and a training pack. Other chapters of the book detail the application of the CANE in different settings such as, Day Care Hospitals, Primary Care, Sheltered Housing, Long-Term care facilities and Acute Hospital care and its application in foreign countries. In the present study, the shorter version of CANE, which has potential in the structured assessment
of older people in primary care, was used. The CANE can be easily used,
without extensive training, by a wide variety of professionals including doctors, nurses, clinical psychologists, occupational therapists and social workers, and the reliability remains good when used by different disciplines.
Studies on disability assessment
Kirsten Naumann Murtagh et al12 conducted survey on “Gender difference in physical disabilities among elderly” in United States of America showed that women compared with similarly aged men were significantly more likely to report functional limitations (Overall 52% vs 37%, p<.001) and had significantly greater degree of disability (Overall mean 0.30 vs 0.18). Women also reported limitation in more of the 8 functional categories than did men. They analyzed the role of socio-demographic factors, chronic disease risk factors and health conditions in explaining differences in disability among senior citizens. They identified that women have more physical disabilities compared to their male counterparts.
Another study in Villupuram district, conducted by Venkatarao et al 5 in 2005 to assess the impairments and disabilities, identified 58% of elderly people have at least one disability in their Activities of daily living (ADL) and Instrumental activities of daily living.
inpatients. 53% of those with cognitive impairment and limitations to daily activity were living in institutions.
Studies on needs assessment and predictors of unmet needs
1. Unmet needs in physical disabilities
By Moner Alam et al6 assessed the ADL difficulty and assistance required by them in their daily activities from a multistage survey of over 1000 urban households in all the nine administrative districts of Delhi. This study revealed that the unmet needs (persons with difficulty and receiving no help (Disabled/No Help) vary from 1.3% in eating to 24.4% in getting up. They also identified in most of the ADL category women is needed more personal assistance.
Mayur M Desai et al7 studied a national representative data of older adults on “Unmet Need for Personal Assistance with Activities of Daily Living among Older Adults” and have opined overall, 48.7% of older adults with ADL difficulties reported needing some sort of personal assistance with one or more ADLs, and, of those individuals with need 20.7% had an unmet need. They also identified in multivariate analysis, respondents who had less annual household income, lived alone, and had difficulty in performing an increasing number of ADLs
were at increased risk of having unmet need for personal assistance.
between unmet needs and mortality. They identified between 10% and 25% of the elderly in need reported no use of health services. After a median of 60.3 months, those with unmet health care needs presented a higher risk of mortality
Williams et al18 reviewed the article on “Unmet Long -Term Care Needs of Elderly People in the Community” in 1997 and unmet need range from around 2 percent to about 35 percent of community dwelling elders, depending on what is included or excluded from the definition. They found that living alone was one of the strongest predictor of unmet need.
Tennstedt et al43 In their study found that, among those with IADL needs, lack or withdrawal of informal care predicted unmet need. However, among those with ADL needs, the predictor of unmet need was a higher level of physical disabilities. They also identified living alone appears to be the best predictor of unmet need and formal service use.
Otero et al14 conducted study on community dwelling Spanish elderly on assessing the unmet home care needs and they reported overall, 14, 39, and 50% of subjects reported dependency for daily, weekly and monthly activities, respectively. Of these, 40, 27, and 12% reported receiving inadequate assistance. By applying logistic regression they identified unmet needs were strongly associated
with low monthly income, low educational level, living alone, and symptoms of
depression. Families were the exclusive source of almost all assistance provided,
2. By Using CANE
Orrell M et al15 conducted a feasibility study of CANE in primary care in 2000 in United Kingdom and they compared needs identified by patients, carer and health professional and they found patient most frequently felt eyesight/hearing, psychological distress and incontinence as their unmet needs. They suggested CANE schedule is a feasible tool to use in primary care and they can identify perceived needs not previously known about by health professional. They also suggested more needs assessment of elderly to be carried out in primary care to improve survival and quality of life of elderly persons.
Walters K et al16 by using CANE, conducted study among the elderly in United Kingdom to identify elderly patients’, carers’ help seeking behaviour and perceived barrier to unmet needs. They identified A total of 55/84 (65.5%) of patients and 15/17 (88%) of carers completed the initial needs assessment. For 104 unmet needs identified by 31 patients and 11 carers, a further interview was completed on the barriers to meeting that need. Help had been sought for only 25/104 (24%) of unmet needs and it had been offered in only 19/104 (18%). In those not seeking help, withdrawal, resignation and low expectations were dominant themes. In those that had sought help, there were issues of perceived failure of service delivery and rationing, with themes of resignation and withdrawal again emerging in those declining help offered.
3. Other studies on Needs Assessment of the elderly
The study was conducted by Goel P.K. et al17 in rural elderly population in Meerut in 2003 to assess the unmet needs, identified 58.5% elderly were dependent financially, and 32.2% were feeling lonely while family members of 33.9% elderly used to ignore their advice. 69.5% of elderly were having no leisure time activity outside home, 24.8% of them were not having any social contact outside home and 55.1% of elderly were having sad attitude towards their lives. The major needs of elderly were found to be economic dependence, ignorance to their advice, sad attitude towards life, loneliness, distant government health facilities and lack of awareness as well as utilization of geriatric welfare services.
The study was conducted by K.R. Rani et al10 on assessing the health care needs of elderly living in home which includes social, medical and nursing needs, They identified the social needs like Financial support is needed for about 40 percent of the elderly, Lack of social security (35%), lack of healthy family environment (37%) and not participating in social events (64%). They identified the medical and nursing needs by considering their disease status. Among those identified as having ailments nearly three-fourths are in need of an urgent detailed medical check up. For about 12 percent of persons with illness, no one was present to provide proper care. They also identified even among those having care, in about 40 percent of the cases the care given seemed to be inadequate.
In the study by Yang-Heui Ahn et al44 on assessing the health care needs of elderly in a rural community in Korea identified service need for physical care was highest, and the factors contributing to service need were gait disability, functional capabilities, nutrition status, and perceived health status. The results of this study indicates their needs are multiple and complex. The authors have recommended a well-coordinated health service system that would integrate social welfare services for elderly population who lived alone.
Mui A.C et al42 conducted study among Asian American elders on community needs assessment. Their findings suggests that Services needed but not provided were emergency psychiatric care, home attendants, home-delivered meals, legal services, medical services, and protective services. Findings of this study provide useful information for further research and program planning for Asian American elders in urban settings.
Studies on Morbidity assessment:
Kamalesh Joshi et4 al in 2003 studied the elderly people in Chandigarh and identified 88.9% reported illness based on their perceptions and of these 43.5% were seeking treatment and taking medicines, and 42.5% were diagnosed as having 4-6 morbidities. The commonly identified morbidities were Anemia, Dental problems, Hypertension, Chronic Obstructive Airway Diseases (COAD), Cataract and Osteoarthritis. They suggested assessment of morbidity pattern and its determinants will help the in the application of intervention, both medical and social, to improve the health status and thus quality of life of elderly people
Another study by Vijayakumar et al31 to assess the health of the elderly people in a community transition in Kerala in 1994 based on the reported morbidity they identified the leading morbidity were hypertension (18.4%), arthritis and joint problems (12.1%), chronic bronchitis (11.7%) and diabetes (9.5%) coronary heart disease accounted for 5.7%.
Anil Jacob Purty et al32 studied 320 rural elderly in Tamilnadu identified the average illness per person was 2.77. Pain in the joints and joint stiffness was the most common morbidity in 139 (43.4%), followed by dental and chewing complaints in 135 (42%), decreased visual acuity due to cataract and refractive errors in 182 (57%) and hearing impairment in 46 (15.4%). Other morbidities were hypertension in 42 (14%), diarrhoea in 38 (12%), chronic cough in 37 (12%), skin diseases in 38 (12%), heart illness in 27 (9%), diabetes in 26 (8.1%), asthma in 19 (6%) and urinary complaints in 18 (5.6%).
In the study by M.K. Sharma et al33 in 2005 on assessing the pattern of life style and morbidity profile of elderly population in urban areas of Chandigarh identified 57.2 % had osteoarthritis, 40.4% had hypertension, 33.5% were overweight, 25.5% were diabetics, 67.4% had cataract and 34.2% had respiratory problems.
4. MATERIALS AND METHODS
The objectives of this study were to assess the extent of physical disabilities, morbidity load and unmet needs in physical disabilities of the elderly in a rural community. This study also aimed to identify the predictors of above unmet needs so that they can act as a surrogate marker to identify those in need of the service. Study design:
Cross sectional study Study period:
The study was conducted for a period of one year from July, 2005 to June, 2006.
Study area:
Seven villages coming under the field practice area of PSG Rural Health centre, Vedapatti served as the study area. These villages are planned to be covered by “PSG Geriatric Day Care Centre”.
Estimation of sample size:
CI, was calculated to be 278. Allowing for 20% non respondent, the required sample size was calculated to be 347 (p = 23.7%, q = 76.3% and d = 5)
Sampling method:
Seven villages, which are to be covered by the “PSG Geriatric Day Care Centre”, come under field practice area of PSG Rural Health Centre were included in the study. The complete list of all residents of those villages is available at the centre in the form of Family registers. With the help of the above key information, all households which have elders were given serial numbers. This constituted the sampling frame.
To arrive at the required sample size of 347, elders from 7 villages were selected using the Probability Proportional to Size (PPS) sampling technique.
Total number of households with the elderly people = 1204
Number of households to be surveyed in each village (probability proportional to size (PPS))
No. of households with elders x required sample size = ---
Total no. of household with elders in all villages
1) Ajjanur = 86x347/1204 = 25
2) Nambialgampalayam = 84x347/1204 = 24
4) Kalikkanyakkanpalayam = 230x347/1204 = 66
5) Kurumpalayam = 142x347/1204 = 41
6) Sundapalayam = 268x347/1204 = 77
7) Vanniyampalayam = 161x347/1204 = 47
The required number of households for each village was decided, as mentioned above. Among the total households in each village, the sample households were randomly selected using SPSS 11.5 version. If a household had more than one elder person one of them selected for the study by using lots. The elderly persons residing in the selected sample households were visited and the study was conducted. Those who were either non-cooperative or could not be contacted despite making three attempts to contact them were not included in the study. The remaining elderly people were included and studied.
Tools used in data collection
I. Physical instruments
(E Chart) was used to assess the visual acuity. Those who were unable to read were further examined for cataract and corneal opacity.
II. Survey Questionnaire
The Survey Questionnaire contained the following details: A. Background details
Certain socio-demographic details of the study population such as gender, age, religion, marital status, educational status of the elderly, occupation, living arrangement, monthly income (personal and family), financial status and the availability of carer.
B. Assessment of physical disabilities - By using Stanford Health Assessment Questionnaire
during the past week were scored as 0 (no difficulty), 1 (some difficulty), 2 (much difficulty), or 3 (unable to do). Ratings such as some difficulty, much difficulty, or
unable to do were deliberately not defined for the patients; patients were instructed
to respond idiomatically, using their own frame of reference. For example, if a patient asked what “SOME” means, an appropriate response would be “Whatever you think ‘SOME’ means to you”.
The activity with the greatest perceived difficulty within a particular functional category determined the category score. An overall disability index that ranged from 0 (no disability) to 3 (most severe disability) was then obtained by averaging the 8 category scores.
Subjects also informed whether they used an aid, device, or got help from another person within each functional category for assessing their unmet need in that category.
C. Assessment of unmet needs in physical disabilities:
Subjects with disability/disabilities were assessed for their unmet needs based on the model described by Mayur M Desai et al.7 (Annexure-II.A).
D. Morbidity Load assessment
Subjects were clinically evaluated based on the steps given by the
“Handbook on Health Care of the Elderly: A Manual for Physician in Primary
and Secondary Health Care Facilities",34 i.e. by their reported illness (Existing
diagnosis), medication held by the subjects, history and clinical examination.
E. Camberwell Assessment of Need for the Elderly (CANE)
The CANE is a comprehensive, person-centred needs assessment tool that has been designed for use with the elderly.30 It is suitable for use in a variety of clinical and research settings. It has 24 areas / items of needs assessment. It has been shown that the CANE is a valid and reliable tool, which is suitable for use in various settings.9
It was developed from the Camberwell Assessment of Need (CAN) to incorporate the special needs posed by the elderly. Twenty-four areas of possible individual needs are assessed by the CANE, as well as two questions aimed at assessing the needs of the person’s carer. The CANE tool collects information about the elderly individual’s needs from various perspectives such as the persons themselves (Felt needs), those of a key staff member, and those of a carer. A summary of met and unmet needs is then produced from the information gathered, which can lead directly to possible interventions and preparation of the care plans. This study mainly focused on assessing only the felt needs of elderly.
F. Identifying Predictors of unmet needs
The socio-demographic factors, carer status, number and level of physical disability and number of chronic health condition were found to be predictors of unmet needs.6, 7, 14, 18, 43. Specifically we included the following socio-demographic variables in our analysis: sex, age, educational status, marital status, financial status, living arrangement, monthly family income, carer status, presence of cognitive impairments, number of morbidity, number and level of physical disabilities
Details of each variable are given in Annexure - I.
The mean family income of the 305 elderly subjects was Rs. 4350 per month. Those with income below Rs 4350 were classified as the low-income group and those with income Rs 4350 and above were classified as high income group.
III. Data Analysis
The data were expressed as number and percentage. Chi - Square test
and Multivariate logistic regression analysis were performed to identify
predictors of unmet needs. In the analysis using Multivariate logistic regression, odds ratios (ORs) with 95% Confidence Intervals (CIs) were calculated and p
value less than 0.05 were considered as statistically significant. Analyses were
5. OPERATIONAL DEFINITIONS
Elderly person:
A person, either male or female, aged 60 years and above is considered as elderly person.
Illiterate:
A person, who can neither read nor write or can only read but cannot write in any language, is considered as illiterate.
Carer:
A carer is someone who has the responsibility for providing or arranging care for the elderly person who is not able to care for him or herself, because of long-term illness / disability.
‘Unmet need’ in physical disabilities: An elderly person, who
a) needs help for ADL and/ or IADL, but not receiving help. or
6. RESULTS
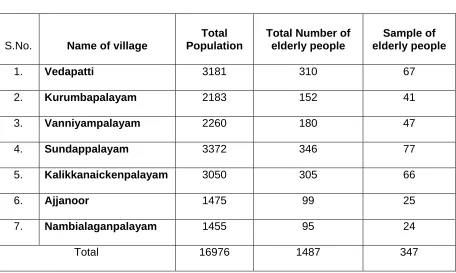
The study was conducted in 7 villages, shown in table I.A. These villages had a total population of 16976 including 1487 elderly people (8.8%). Among the elderly, 347 were selected for the study sample. However 42 were either non-cooperative or could not be contacted despite making 3 attempts to contact them. The remaining 305 elderly people were contacted and studied, thus forming the respondent rate of 87.9%.
[image:41.612.87.543.345.618.2]I. Background Demographic Details
Table I.A: Village wise distribution of elderly people
S.No. Name of village
Total Population
Total Number of elderly people
Sample of elderly people
1. Vedapatti 3181 310 67
2. Kurumbapalayam 2183 152 41
3. Vanniyampalayam 2260 180 47
4. Sundappalayam 3372 346 77
5. Kalikkanaickenpalayam 3050 305 66
6. Ajjanoor 1475 99 25
7. Nambialaganpalayam 1455 95 24
Total 16976 1487 347
Table I.B: Age - sex distribution of the study population
Male (n=143) Female(n=162) Total (n=305) Age groups
(in years)
No. % No. % No. %
60 to 64 55 38.5 45 27.8 100 32.8
65 to 69 39 27.3 44 27.2 83 27.2
70 to 74 24 16.8 34 21.0 58 19.0
75 to 79 12 8.4 18 11.1 30 9.8
80 and above 13 9.1 21 13 34 11.1
Total 143 100 162 100 305 100
In the present study, out of 305 elderly, major proportions (32.8%) of elderly were between age group of 60 - 64 years. A sizable proportion (11.1%) elderly were aged 80 years and above. Females were more in number 162(53.1%) than male (143(46.9%))
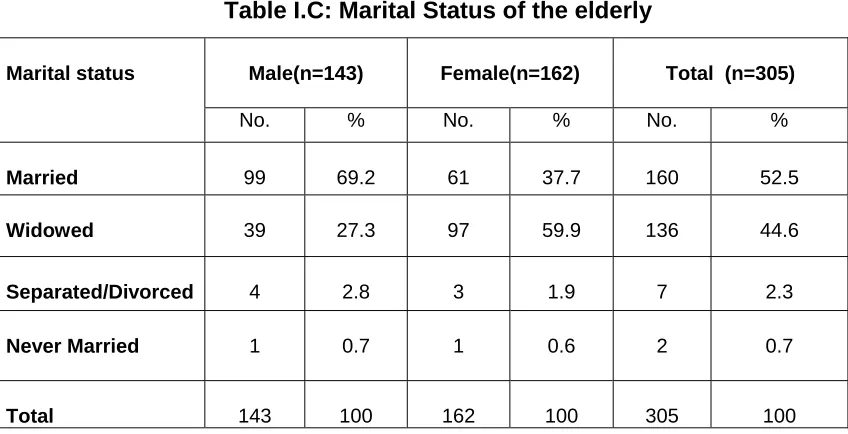
Table I.C: Marital Status of the elderly
Male(n=143) Female(n=162) Total (n=305) Marital status
No. % No. % No. %
Married 99 69.2 61 37.7 160 52.5
Widowed 39 27.3 97 59.9 136 44.6
Separated/Divorced 4 2.8 3 1.9 7 2.3
Never Married 1 0.7 1 0.6 2 0.7
[image:42.612.87.511.435.652.2]In the sample studied, 160(52.5%) elderly people were currently married. Remaining 134 (44.6%) were widowed, 7(2.3%) were separated and divorced and 2(0.7%) were never married.
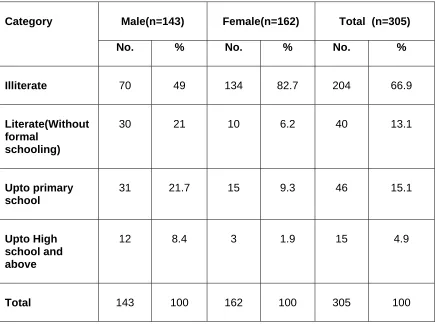
Table I.D: Educational Status of the Elderly
Male(n=143) Female(n=162) Total (n=305)
Category
No. % No. % No. %
Illiterate 70 49 134 82.7 204 66.9
Literate(Without formal
schooling)
30 21 10 6.2 40 13.1
Upto primary school
31 21.7 15 9.3 46 15.1
Upto High school and above
12 8.4 3 1.9 15 4.9
Total 143 100 162 100 305 100
This study also found that illiteracy is more among the females (82.7%) as compared to the males (49%).
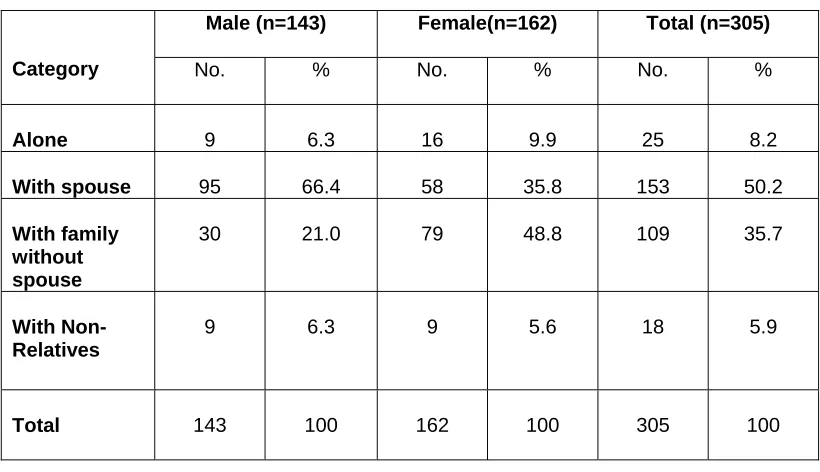
Table I.E: Living Arrangements
Male (n=143) Female(n=162) Total (n=305)
Category No. % No. % No. %
Alone 9 6.3 16 9.9 25 8.2
With spouse 95 66.4 58 35.8 153 50.2
With family without spouse
30 21.0 79 48.8 109 35.7
With Non-Relatives
9 6.3 9 5.6 18 5.9
Total 143 100 162 100 305 100
[image:44.612.84.497.614.710.2]Table I.E revealed nearly half (49.5%) of the elderly living with their spouse, 111 (36.4%) of elderly living without spouse but with their family members and 5.4% living with non-relatives. A sizable proportion (8.2%) of elderly were living alone.
Table I.F: Distribution of elderly by Financial Status
Male (n=143) Female(n=162) Total (n=305) Financial
status
No. % No. % No. % Fully
Dependent
Partially dependent
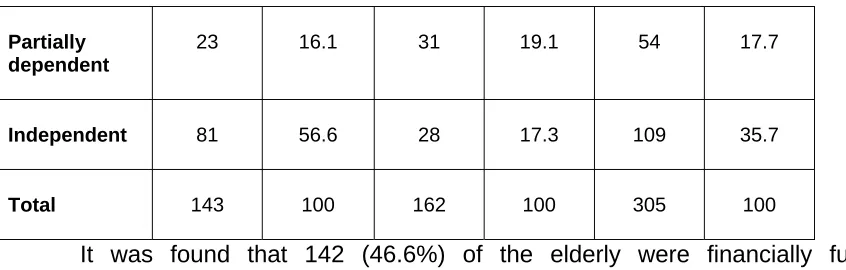
23 16.1 31 19.1 54 17.7
Independent 81 56.6 28 17.3 109 35.7
Total 143 100 162 100 305 100
It was found that 142 (46.6%) of the elderly were financially fully dependent and 54 (17.7%) were partially dependent. The proportion of females were fully dependent on others was 63.6% as compared to 27.3% among male.
[image:45.612.86.509.69.204.2]
II. Physical disabilities of the elderly
Table II.A: Sex-wise distribution of Various Physical disabilities
Male (n=143) Female(n=162) Total (n=305)
S.No Category
No. (%) No. (%) No. (%)
1
Dressing and grooming
28(19.6) 36(22.2) 64(21)
2 Arising 24(16.8) 39(24.1) 63(20.7)
3 Eating 21(14.7) 30(18.5) 51(16.7)
4 Walking 25(17.5) 42(25.9) 67(22)
5
Hygiene 13(9.1) 24(14.8) 37(12.1)
6 Reach 19(13.3) 40*(24.7) 59 (19.3)
7 Grip 22(15.4) 31(19.1) 53(17.4)
9
One or More Activity Limitation
59(41.3) 103(63.6) 162**(53.1)
* P< 0.01 by Chi square test ** P< 0.001by Chi square test
**Going to the shop, Able to use personal and public transport, Household
chores
[image:46.612.85.508.453.722.2]It was found that 162(53.1%) elderly had limitation in their activity in one or more categories. This study also identified women compared with similarly aged men had more activity limitation (Overall 63.6% vs 41.3%, p< 0.001). Gender differences also were significant in 2 of the 8 categories of physical function (Reach 24.7% vs 13.3%, p<0.01 and other activities 30.25 vs 13.3%, p<0.001).
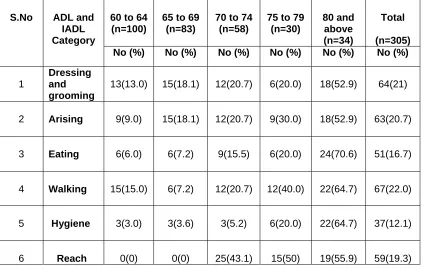
Table II.B: Age-wise distribution of various Physical disabilities (Age in years)
60 to 64 (n=100)
65 to 69 (n=83)
70 to 74 (n=58)
75 to 79 (n=30) 80 and above (n=34) Total (n=305) S.No ADL and
IADL Category
No (%) No (%) No (%) No (%) No (%) No (%)
1
Dressing and grooming
13(13.0) 15(18.1) 12(20.7) 6(20.0) 18(52.9) 64(21)
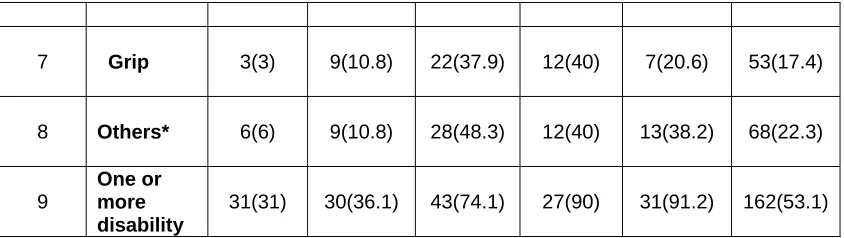
7 Grip 3(3) 9(10.8) 22(37.9) 12(40) 7(20.6) 53(17.4) 8 Others* 6(6) 9(10.8) 28(48.3) 12(40) 13(38.2) 68(22.3) 9
One or more disability
31(31) 30(36.1) 43(74.1) 27(90) 31(91.2) 162(53.1)
[image:47.612.85.507.71.190.2]*Going to the shop, Able to use personal and public transport, Household chores
Table II.B shows that disabilities are common in the age group 80 years and above and the percent of people with disability also increasing as the age increases.
[image:47.612.81.529.429.714.2]III. Morbidity Load
Table III.A: Morbidity profile of the elderly.
Male (n=143) Female(n=162) Total (n=305) S.No Physical Health Condition No. (%) No. (%) No. (%)
1 Eye Problems* 88 (61.5) 103(63.6) 191 (62.6)
2 Hypertension 72(50.3) 63 (38.9) 135 (44.3)
3 Respiratory diseases** 48(33.6) 56(34.6) 104 (34.1)
4 Psychological distress and symptoms
38(26.6) 51(31.5) 89 (29.2)
11 Deafness 7(4.9) 9(5.6) 16(5.2) 12 Oral lesions (Dental caries
and oral carcinoma)
5(3.5) 7(4.3) 12(3.9)
13 Stroke 2(1.4) 1(0.62) 3(0.99)
* Eye problems include cataract, corneal opacity
** Respiratory diseases include Chronic Obstructive Airway Diseases (COAD)
and Pulmonary Tuberculosis
*** Musculoskeletal disorders include Osteoarthritis, Rheumatoid arthritis,
[image:48.612.82.530.72.143.2]Kyphosis and Spondylitis
Table III.A shows distribution of morbidity load diagnosed by History, clinical examination and medical records held by the subjects. The most common morbidity identified among them were Eye problems (62.6%) Hypertension (44.3%) Respiratory diseases (34.1%), Psychological distress and symptoms (29.2%) and musculoskeletal disorders (23.6%).
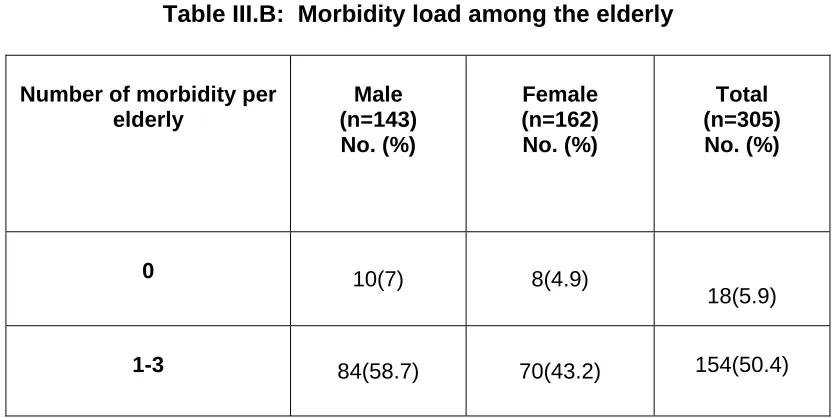
Table III.B: Morbidity load among the elderly
Number of morbidity per elderly
Male (n=143) No. (%)
Female (n=162) No. (%)
Total (n=305) No. (%)
0 10(7) 8(4.9)
18(5.9)
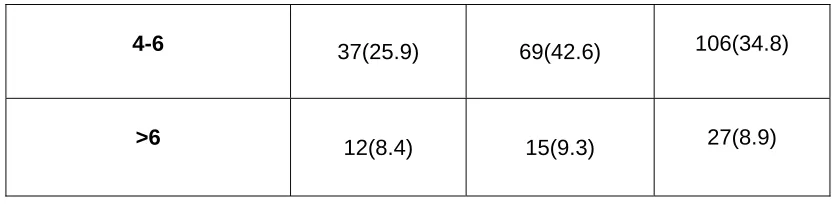
[image:48.612.97.515.502.711.2]4-6 37(25.9) 69(42.6) 106(34.8)
>6 12(8.4) 15(9.3) 27(8.9)
About half of the subjects (50.4%) were diagnosed as having 1-3 morbidities and 34.8% of elderly having 4-6 morbidities. There are few (8.9%) elderly people having more than 6 morbidities. A small number (5.9%) of elderly is free from disease.
[image:49.612.97.517.70.172.2]IV. Unmet Needs in Physical Disabilities
Table IV.A: Needs - Unmet and Met needs in physical disabilities among the study population (n=305)
S.No ADL and IADL Category
Disabled persons No. (%)
Unmet needs No. (%)
Met needs No. (%)
1 Dressing and
grooming
64(21) 30(9.8) 34 (11.1)
2 Arising 63(20.7) 42(13.8) 21 (6.9)
3 Eating 51(16.7) 30(9.8) 21(6.9)
5 Hygiene 37(12.1) 13(4.3) 24(7.9)
6 Reach 59(19.3) 25(8.2) 34(11.1)
7 Grip 53(17.4) 4(1.3) 49(16.1)
8 Others*** 68(22.3) 37(12.1) 31(10.2)
9 One or More
Category
[image:50.612.82.530.70.313.2]162(53.1) 100(32.8) 62(20.3)
Table IV.B: Distribution of unmet needs in physical disabilities among males and females
S.No ADL and IADL
Category
Male (n=143) Female(n=162) Total (n=305)
1 Dressing and grooming
9(6.3) 21*(13.0) 30 (9.8)
2 Arising 12(8.4) 30*(18.5) 42 (13.8) 3 Eating 12(8.4) 18(11.1) 30(9.8) 4 Walking 9(6.3) 15(9.3) 24(7.9) 5 Hygiene 1(0.7) 12*(7.4) 13(4.3)
7 Grip 1(0.7) 3(1.9) 4(1.3) 8 Others*** 13(9.1) 24(14.8) 37(12.1) 9 Unmet need in one or
more Activity Limitation
31(21.7) 69**(42.6) 100 (32.8)
* P< 0.05 by Chi square test ** P<0.001 by Chi square test
*** Going to the shop, Able to use personal and public transport, Household chores
The results in Tables IV.A and IV.B show that nearly one third (32.8%) of elderly have unmet need for one or more physical disabilities. The highest prevalence of unmet needs was present in “arising” (13.8%). Like disability, unmet needs were also more common among women as compared to men (42.6% vs 21.7%, p <0.001). Gender differences also were significant in 3 of the 8 categories of physical function (Dressing and Grooming, Arising and Hygiene).
[image:51.612.88.528.71.204.2]V. Camberwell Assessment of Need for the Elderly (CANE)
Table V: Distribution of Needs among the elderly as assessed by CANE
S.No Category Unmet need
No. (%)
Met need No. (%)
No need No. (%)
6 Day time activities 149(48.9) 43(14.1) 113(37) 7 Memory 88(28.9) 74(24.3) 143(46.9) 8 Eyesight / Hearing
/Communication
177(58) 36(11.8) 92(30.2)
9 Mobility / Falls 41(13.4) 48(15.7) 216(70.8) 10 Continence 11(3.6) 13(4.3) 281(92.1) 11 Physical health 131(42.9) 145(47.5) 29(9.5) 12 Drugs 66(21.6) 132(43.3) 107(35.1) 13 Psychotic symptoms 55(18) 41(13.4) 209(68.5) 14 Psychological Distress 42(13.8) 65(13.4) 198(64.9)
15 Information (On Condition and treatment)
68(22.3) 67(22) 170(55.7)
S.No Category Unmet need
No. (%)
Met need No. (%)
No need No. (%)
16 Safety to self (Deliberate self-harm)
27(8.9) 6(1.9) 272(89.2)
17 Safety to self (Inadvertent self-harm)
15(4.9) 7(2.3) 283(92.8)
[image:52.612.87.528.69.726.2]22 Intimate relationships 19(6.2) 42(13.8) 244(80) 23 Money / Budgeting 119(39) 89(29.2) 97(31.8) 24 Benefits* 165(54.1) 67(22) 73(23.9)
[image:53.612.84.532.71.180.2]* Benefits given by the government and NGOs
Table V shows frequencies of “Need” (unmet and met need) and “No need” identified among the elderly in the present study. Most of the unmet needs among the elderly were in the areas of accommodation (59.3%), Eyesight / Hearing (58%), Benefits (54.1%), Day time activities (48.9%) and Physical health (42.9%), closely followed by companionship(34.1%), looking after the home (33.1%),and self care (32.1%). Regarding met needs the most common are with reference to Physical health (47.5) Drugs (43.3) looking after the home (30.5), and caring for someone else (30.2%).
Table VI: Predictors of Unmet Needs in Physical Disabilities
Number of elderly people Number of elderly with Unmet need Variable No. (%) Unadjusted Odds Ratio (95 % Confidence interval)
Adjusted odds ratio
(95 % Confidence interval) Level of Significa nce (p value) Sex Male Female 143 162 31 (21.7) 69 (42.6) 1.00 2.68 (1.61 - 4.44)
1.00 2.23(0.98 - 5.07)
p = 0.055
Age (in years)
< 70
70 and above
183 122
30 (16.4) 70 (57.4)
1.00 6.86(4.03 - 11.67)
1.00
2.86(1.20 - 6.82)
[image:53.612.76.539.476.715.2]Educational status Literate (Non-Formal Schooling and others) Illiterate 101 204 19(18.8) 81(39.7) 1.00
2.84(1.60 - 5.04)
1.00
0.62 (0.25 - 1.53)
p=0.305 Marital status Married Others* 160 145 39(24.4) 61 (42.1) 1.00
2.25(1.38 - 3.67)
1.00
2.56(1.13 - 5.80)
p=0.024 Financial status Others (Partially dependent and Independent) Fully dependant 163 142 22(13.5) 78(54.9) 1.00
7.81(4.47 - 13.64)
1.00
5.86 (2.74 - 12.56)
p<0.001 Variable Number of elderly people Number of elderly with Unmet need No. (%) Unadjusted Odds Ratio (95 % Confidence interval)
Adjusted odds ratio
(95 % Confidence interval) Level of Significa nce (p value) Living arrangement Alone Living with other(s) 27 278 18(66.7) 82(29.5)
4.78(2.06 - 11.08)
1.00
7.74 (2.27 - 26.60)
1.00
p=0.001
Monthly Family income
[image:54.612.74.538.68.725.2]98 15(15.3) 1.00 1.00 p=0.697
>Rs 4350(High)
<Rs 4350(Low)
207 85(41) 3.85(2.08 - 7.13) 1.186(0.50 - 2.80)
Elder have carer
Yes No 106 199 24(22.6) 76(38.2) 1.00 2.11(1.23 - 3.61)
1.00 2.02 (0.96 - 4.24)
p=0.062 Cognitive impairment No Yes 193 112 49(25.4) 51(45.5) 1.00 2.45(1.50 - 4.02)
1.00 0.79 (0.34 - 1.83)
p=0.585 Number of morbidity < 3 4-6 >6 150 128 27 23(15.3) 59(46.1) 18(66.7) 1.00 11.01(4.42 - 27.58)
4.72(2.67 - 8.29)
1.00
6.91(1.86 - 25.77) 4.18(1.81 - 9.67)
p=0.002
Number of physical disability
<3
3 and above
226 79
46(20.4) 54(68.4)
1.00 8.45(4.76 - 15.00)
1.00
3.30 (1.14 - 7.54)
p=0.005
* Others include Widowed, separated and divorced and never married
fully dependent elderly, those elderly had more number(level) of disability and elderly having more morbidity.
7. DISCUSSION
functions, unmet needs especially that of physical activity and increasing social support.
Here, the background details of the sample population, health problems, physical disabilities, unmet need for disabilities and predictors of unmet needs are discussed.
1. Background Details
Using the data from representative sample of community dwelling elderly of 7 villages, we found 53.1% of them are female and 46.9% of them are male.
Literacy is an important determinant of the well being of an individual. In the present study about 83% of women and 49% of men are illiterate. However the national level literacy status shows that 90% of elderly women and two third of elderly men are illiterate. This is due to better educational system in Tamilnadu state. The findings are similar to Rani K et al.10
al,10 but it is still higher than the national level and study by Shashi Kant et al.46 This is in contrast with the situation in western countries7, 14, 18, 43 where the proportion of elderly living alone is much more.
The human life cycle begins and ends with stages of dependency. This dependency may be either physical or financial. Financial dependency is one of the major social problems of the elderly. Dependency is an important factor influencing of physical and mental health of the elderly. In the present study found 47% of the elderly was financially fully dependent to others. These findings are lower than the study by Shashi Kant et al.46 This is explained by the fact that rural elderly continue to be active until physical incapacity prevents them from working. The latter study was done in an urban setting.
The present study shows that 162 (53%) of the elderly were currently married. Among the male 69% and among the female 38% were currently married. This difference is due to the higher life expectancy among the female. This difference is also noted (75% vs 25%) in the study by Rani K et al. 10
Physical Health Problems
chronic or long-term disease, more people with long-term disabilities, and more non-communicable diseases than infectious disease. Multiple pathology in one person is also very common among the elderly.
Health problems in the present study were assessed by history taking, clinical examination and medical records held by the subjects. On the whole, in the present study 6% of elderly presented with no morbidity. Kamalesh Joshi et al4 in their study found only 0.5% of elderly presented with no morbidity. In contrast, Vijayakumar et al31 in their study identified 42% of sample subjects were free from any disease. This difference can be explained due to the difference in the tools they used.
It was found that 63% of elderly were suffering from one or more eye problems, which is slightly lower than Prakash R et al.13 They found 70% of their sample had one or more eye problems. The lower prevalence in the present study can be due the different to inclusion criteria used for eye problems. The present study included only cataract, corneal opacity and refractive errors.
Hypertension is one of the major chronic conditions29 affecting elderly people. It can occur at any age, but the risk increases with age. This study found that 44% of the elderly were suffered from hypertension. This is consistent with the findings in other studies.4, 10, 13
affected by these disorders and osteoarthritis ranked first among these disorders. These findings are slightly higher than the study done by Prakash R et al13, but this prevalence is lower than the study done by Kamalesh Joshi et al4 and K.R. Rani et al10. Similar to other studies, 4, 10, 13 the present study has also identified women are more prone ton this disorder.
Physical Disabilities and unmet needs in physical disabilities
Disability is a complex phenomenon that manifests itself in many ways and evolves over a much longer time span. Attempt to measure disabilities is important because of its association with a decreased functional autonomy and the increased demand for long term care. If the need for assistance to disability goes unmet, elderly may be at risk for a variety of adverse outcomes, including increased health service utilization and depression.40 Disability is strongly associated with age. Disability comes in degrees, and a key threshold is the requirement for frequent help from other people, beyond what would be expected by virtue of family or social ties (i.e. ‘dependency’).
It is difficult to compare estimates of limitation of activity (Physical disabilities) unmet need for disabilities with various studies, because of considerable difference in study methods, such as sample characteristics, definitions of disability, need and unmet need. Our estimates of unmet need differ from those previously reported both in total and individual categories.
al.5 In their study they found 58% of elderly people had at least one disability in their Activities of daily living (ADL) and Instrumental activities of daily living. Kamalesh Joshi et al4 in their study found that a total of 87.5% of elderly had minimal to severe disabilities.
The present study also found that women were having more disability (63.6% vs 41.3 %) than men. These findings are consistent with other studies. 6,
12, 41
In their study the gender difference was significant in physical disabilities (52% vs 37%).
Consistent with other studies5, 6, 41 our study also shows that disability occurrence was more with increasing age. The number of disabilities and severity of disabilities increases with age.
The prevalence of unmet needs in disabilities in this study was 33%. This finding is similar to the study done by Moner Alam et al6 and is in contrast to the several studies in western countries.7, 8, 18 The prevalence were much lower than our study. This can be due to availability of formal carer to assist the elderly for their Activities and Instrumental activities. Also the use of equipments/aids were much high in their study. In our study we could not find many aids other than cane/walking stick.
In this study in a particular activity the highest prevalence of unmet needs was in “arising” and this is similar to the study by Moner Alam et al6 and is in contrast to Mayur M et al.7 This is due to the fact that the latter study was conducted where there are more equipments available.
The present study found that elderly who lived alone were four times as likely as those who lived with others to report unmet needs for their disability. These findings are consistent with several authors.7, 14, 18, 43 It shows that living alone is one of the best predictors of unmet need and future formal care services. This factor is important to note because more number of elderly will be living alone in the rural area in future due to urbanization and youngsters moving to urban area.
After adjusting with other variables, there is no significant gender difference in the unmet needs in this study. This is similar to most other studies.7, 14, 18, 43, 45,
There have been studies like the one by Moner Alam et al6 where most of the ADL category women needed more personal assistance.
Age is the important predictor of unmet needs as identified by our study. Especially the aged 70 years and above had significantly more unmet needs for their disabilities. Surprisingly many studies7, 14, 18, 43 did not find any relationship between chronological age and unmet needs. In India spouse will be the primary caretaker followed by others. In this study we found that single were more likely to have unmet needs compared to currently married.
This study did not find an association between monthly family income and unmet need, similar to Tennstedt el al.43 In contrast to our study, Mayur M Desai7 et al and Otero et al14 found elderly having low income were at increased risk of having an unmet need. This may be explained, may be in part that our study assessed the monthly income of the family, which is having less recall bias in contrast to other studies, which assessed the annual income.
In contrast to the some other authors our study found as number of morbidity increases the unmet needs also increasing.
incontinence. The common needs identified by some other authors10, 17, 44 are Lack of social security (35%), lack of healthy family environment (37%) and not participating in social events (64%).
This study has identified the predictors of unmet needs and subsequently can be used to identify the elders who need the service most. CANE was then used to assess the unmet and met needs of elderly thus leading to assess the type of common services needed by the elderly.
Limitation of this study:
8. SUMMARY
305 elderly people aged 60 years and above were studied with the objective of finding out the extent of physical disabilities, the morbidity load , the unmet needs in physical disability and the predictors of unmet needs in physical disabilities.
Morbidity load was identified by using the guidelines provided in the “Handbook on the Health Care of the Elderly” by WHO. Physical disability was assessed by using the “Stanford Health Assessment Questionnaire” and by applying the standard definition, unmet need of physical disability was identified.
A broad variety of socio-demographic and factors like morbidity load, level of cognitive impairment and disability load were taken to identify predictors of unmet needs. CANE tool was used to identify common needs of the elderly to plan the services for the elderly.
Most of them (94.9%) have some morbidity. Most common morbidity identified among them were Eye problems (62.6%) Hypertension (44.3%) Respiratory diseases (34.1%), Psychological distress and symptoms (29.2%) and musculoskeletal disorders (23.6%).
Of the 305 elderly studied, 53.1% were disabled and 32.8% elders have unmet needs for their disability. The Unmet needs are commonly for Arising (13.8%), for Home Activities (12.1%), in Dressing & Grooming (9.8%) and Eating (9.8%).
The common needs identified by using CANE were lack of age-friendly accommodation (62.3%) , lack of companionship and day time activities (41.6%). Difficulty in looking after the home (17.7%) as well as being abused and neglected (14.8%) were also common among the elderly. Some of the elderly (10.8%) were not aware of benefits given by the government under various schemes.
9. RECOMMENDATIONS
1. Since there is high morbidity load among the rural elderly, hence it is recommended that we need to provide them with elderly-friendly primary geriatric care services.
2. Since it is also clear that large number of needs of the disabled are unmet, there is a need for a new policy initiative focusing on strengthening of Community Based Rehabilitation Services (Family oriented programs, day care centers), support for family caregivers and social support interventions.
3. Greater, targeted efforts are needed to identify at-risk elderly people living in the community and to provide services (e.g. home care, community based rehabilitation services) that may reduce the burden of unmet need.
5. Availability of tools like the Stanford Health Assessment Questionnaire in all the major Indian languages to identify functional disability and unmet needs will provide an opportunity to do a comparable study in different parts of India.
10. REFERENCE
1. World Health Organization. Active ageing: Towards age-friendly primary health care. Geneva WHO Publications 2004; 3 - 4.
2. Helpage India. Senior citizens guide. New Delhi, Research and Strategic Development Division Helpage India; 2005.
3. http://www.helpageindia.org/ageingScenario.php, Accessed on 25.08.04
4. Kamalesh Joshi, Rajesh Kumar, Ajit Avasthi. Morbidity profile and its relationship with disability and psychological distress among elderly people in northern India.International Journal of Epidemiology2003; 32:978-987.
5. Venkatarao T, Ezhil R, Jabbar S, Ramakrishnan R. Prevalence of disability and Handicaps in geriatric population in rural south India. Indian Journal of Public Health 2005 Jan - Mar; 49 (1): 11 - 17.
6. Moneer Alam, M. Mukherjee. Ageing, Activities of daily living disabilities and the need for public health initiatives: Some evidence from a household survey in Delhi. Asia-Pacific Population Journal 2005 August; 20 (2), 47 - 77.